Résumés
Abstract
The Oak Ridges Moraine in southern Ontario is a ca. 160 km long east-west trending ridge of sand and gravel situated north of Lake Ontario. Study of the Oak Ridges Moraine in the Humber River watershed was undertaken to assess its role in the groundwater system of the buried Laurentian Valley. The Oak Ridges Moraine is interpreted to have been deposited in three stages. Stage I records rapid deposition from hyperconcentrated flows where tunnel channels discharged into a subglacial lake in the Lake Ontario basin. Low-energy basin sedimentation of Stage II was in a subglacial and ice-contact setting of a highly crevassed ice sheet. Stage III sedimentation is characterized by rapid facies changes associated with esker, subaqueous fan, and basinal sedimentation. Detailed sediment analysis challenges the concept that the Oak Ridges Moraine was deposited principally from seasonal meltwater discharges, climatic modulated ice-marginal fluctuations, or in an interlobate position. Instead it is interpreted to have formed in response to late-glacial ice sheet events associated with subglacial meltwater ponding, episodic and catastrophic subglacial meltwater discharge, and subsequent seasonal meltwater discharge. The moraine probably formed as the glacial-hydraulic system re-equilibrated to the presence of a thinned, grounded ice shelf and a subglacial lake in the Lake Ontario basin.
Résumé
La moraine de Oak Ridges, sud de l’Ontario, est une crête de sable et de gravier orientée est-ouest d’une longueur de 160 km au nord du lac Ontario. L’étude de la moraine de Oak Ridges dans le bassin de la rivière Humber permet de comprendre son rôle dans le système de drainage de la vallée Laurentienne. La moraine de Oak Ridges a été édifiée en trois phases. La phase I consiste en une sédimentation rapide par hyperconcentration des écoulements, où les chenaux en tunnel se déversent dans un lac sous-glaciaire du lac Ontario. Le bassin de sédimentation de faible énergie de la phase II est sous-glaciaire et touche à un inlandsis ayant d’importantes crevasses. La phase III se caractérise par un changement de faciès très rapide, par la présence d’eskers, de cônes aquatiques et de bassins sédimentaires. Les analyses sédimentaires détaillées ébranlent l’hypothèse que la moraine de Oak Ridges ait été formée par la fonte des glaces saisonnière, les fluctuations climatiques près des marges glaciaires, ou dans une position interlobaire. Notre interprétation indique plutôt qu’elle a été mise en place en réponse à des événements de fonte sous-glaciaire de nature épisodique et catastrophique, et par des apports subséquents d’eau de fonte saisonnière. La moraine s’est probablement formée lors de la ré-équilibration du système glacio-hydraulique en présence d’un inlandsis mince, en contact avec le substrat et alimentant un lac sous-glaciaire dans le bassin du lac Ontario.
Corps de l’article
Introduction
Moraines form a prominent element of the southern Ontario landscape. The location and distribution of the moraines was outlined early in the 20th century by Taylor (1913). Subsequent work has refined the extent and form of these moraines (Barnett, 1992). Moraines in the area have been classified by Chapman and Putnam (1943) as either till or kame moraines (Fig. 1) and related to specific genetic processes. Kame moraines have been inferred to be deposited at the margin of inactive ice, whereas, till moraines are inferred to be thrust into position by advancing ice, and to mark the extent of ice-advance (Chapman and Putnam, 1943). There have been few studies of the sediment composition of either kame or till moraines. Consequently, 60 years after Chapman and Putnam work, understanding of many moraines in southern Ontario is incomplete. Two exceptions are the Waterloo and Oak Ridges moraines (Karrow and Paloschi, 1996). In particular, the ca. 160 km long Oak Ridges Moraine (ORM) has been the focus of extensive sedimentological study aimed at understanding the geological history of the landform (Barnett et al., 1998; Sharpe et al., 2002).
Many moraines in Ontario are important areas of groundwater recharge. Moraine topography and internal sedimentary architecture controls the transmission of water from ground surface to groundwater and regional aquifers. Planning efforts to protect source water in Ontario watersheds need better information on moraine landscapes and their hydrogeological function. An improved understanding of moraines in southern Ontario is of particular interest due to increased concern over source water protection (Technical Experts Committee, 2004). Studies that emphasize geological controls on the groundwater system, such as those in the ORM (Howard et al., 1995; Sharpe et al., 2002; Meriano and Eyles 2003; Holysh et al., 2004), north of Lake Ontario (Figs. 1‑2), are of importance as ORM forms the principal recharge area for groundwater flow to watersheds in the Greater Toronto Area. It provides recharge to lower aquifers due to infill of deep valleys, with coarse sediment, that provide connecting to lower sediment (Sharpe et al., 2002). The ORM also provides abundant water to streams and to watershed ecosystems, in addition to a large domestic groundwater supply (Sibul et al., 1977; Howard et al., 1995). Thus, improved information on sediment extent, composition and variability is needed to better manage these vital watershed activities. The Humber River watershed which includes the western extent of the ORM and underlying portions of the buried Laurentian Valley is one such watershed worthy of study (Figs. 2‑3).
Moraine origin can be inferred from its sediment composition and architecture. The ORM has been interpreted as an interlobate moraine deposited between converging flow of the Lake Simcoe ice-lobe to the north and the Lake Ontario lobe to the south (Chapman and Putnam, 1984). The proposed inter-lobe re-entrant and increased meltwater and sediment flux in this reconstruction was attributed to climatic warming during the Mackinaw Interstadial (Karrow, 1974; Duckworth, 1979). The proposed ice lobes and interstadial ice retreat implied sedimentary events, structures and depositional trends unique to each lobe. This classic interpretation for the origin of the ORM is at odds with accumulating evidence of large-scale erosional and depositional meltwater events in the area and formation of the ORM from short-lived flood discharge events (Shaw and Gilbert, 1990; Barnett et al., 1998).
The integration of landform and sedimentary analysis is required to address moraine genesis and to provide geological insight for groundwater flow system analysis and landuse planning in the ORM area (Warren and Ashley, 1994). The ORM provides an opportunity to study a large moraine using a range of geoscience data. Development activities are providing abundant surface and subsurface data that permit the moraine to be studied from three key perspectives: terrain analysis, sedimentology, and subsurface mapping (Russell et al., 1996).
Figure 1

(A) Location of study area in southern Canada. The province of Ontario is shown in grey and study area as a black box. (B) Digital elevation model of southern Ontario with till and stratified moraines highlighted.
(A) Carte de localisation de la zone d’étude au Canada. L’Ontario est en gris et la zone d’étude est indiquée par le carré noir. (B) Carte des élévations du sud de l’Ontario, où les tills et les moraines stratifiées sont accentuées.
Figure 2

Digital elevation model of the ORM with the four moraine segments labeled. The 270 m contour is used to outline the approximate landform expression of the ORM. Note tunnel channels defined by northeast-southwest trending valleys with low surface roughness north of the ORM and intervening drumlinized terrain. Humber River watershed study area is outlined in black.
Modèle numérique d’élévation de la moraine de Oak Ridges avec les segments de moraine. La courbe d’élévation de 270 m montre la forme de la moraine de Oak Ridges. Les chenaux en tunnel sont définis par des vallées orientées NE‑SO ayant une faible rugosité de surface et se manifestent sur un terrain de drumlins. Le bassin de la rivière Humber est surligné en noir.
Figure 3
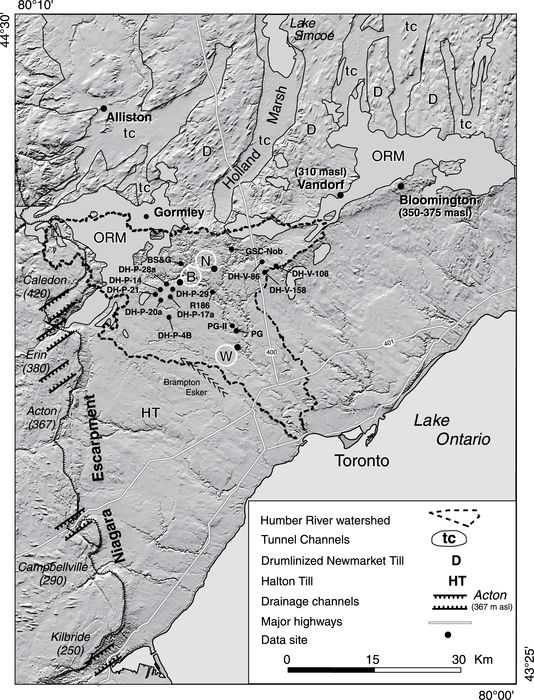
Location of the Humber River watershed study area and the ORM northwest of Toronto. Drill core, river section and aggregate pit section sites are shown. Background DEM shows contrasting landscape of area with tunnel channels (tc) and drumlinized Newmarket Till uplands (D) north of the moraine and Halton Till plain (HT) south of the moraine. Selected towns are indicated by letters in circles, N = Nobleton, B = Bolton, W = Woodbridge. Drainage channels across the Niagara Escarpment are from Chapman (1985) with their respective elevations above sea level (asl).
Localisation du bassin de la rivière Humber et de la moraine de Oak Rigdes au nord-ouest de Toronto. Le modèle numérique d’élévation met en évidence un contraste de paysage entre les chenaux en tunnels (tc) et les drumlins des hautes-terres du till de Newmarket (D), au nord de la moraine, et la plaine du till de Halton (HT), au sud de la moraine. Les villes sélectionnées sont indiquées par les lettres encerclées : N = Nobleton, B = Bolton, W = Woodbridge. Les chenaux de l’escarpement du Niagara et leurs élévations au-dessus du niveau moyen des mers (asl) proviennent de Chapman (1985).
Objectives
This paper describes the morphology and sedimentary facies of the ORM within the Humber River watershed (Figs. 2‑3). Landform and sedimentological analysis is used to develop a three-stage depositional model of the ORM: (1) tunnel channel fill, (2) low-energy glaciolacustrine sedimentation, and (3) esker-subaqueous fan sedimentation. Sedimentary facies and stratal architecture are used to address questions of the origin of the ORM and its relationship with a Late Wisconsinan regional unconformity. Sediment facies analysis indicates sedimentation was from both large magnitude outburst subglacial discharge and from low-energy annual glaciolacustrine processes. The origin of the moraine, therefore, is related to regional deglacial ice-sheet hydraulic dynamics rather than short-term climatic fluctuations.
Geological setting
The Lake Ontario region is underlain by Paleozoic bedrock. East of the Niagara Escarpment much of the bedrock is buried by up to 200 m of Quaternary sediment deposited since the Illinoian glaciation (Fig. 4). Pre-Wisconsinan deposits and Lower Wisconsinan deposits are recognized based on their fossiliferous content, organic content and/or stratigraphic position beneath the Newmarket Till (Karrow, 1967; Eyles and Williams, 1992). The overlying, regionally extensive, Late Wisconsinan Newmarket Till has a drumlinized and channelized upper erosional surface (Sharpe et al., 1997; Boyce and Eyles 2000). Tunnel channels incise the till and locally may extend to bedrock (Russell et al., 2003b; Sharpe et al., 2004). Part of the erosional topography is an anabranched pattern of tunnel channels that has been mapped north and east of the ORM (Figs. 2‑3). Channels are 10’s of km long, up to 5 km wide, and steep sided with maximum depths of ca. 150 m (Barnett, 1990; Brennand and Shaw, 1994; Russell et al., 2003b). Based on seismic reflection surveys (Pugin et al., 1996, 1999) and drillholes (Barnett et al., 1998; Russell et al., 2003a) the channels have been mapped beneath the ORM. The drumlinized Newmarket Till surface and tunnel channels define a regional Late Wisconsinan unconformity interpreted to have been formed by subglacial meltwater erosion events (Shaw and Gilbert, 1990; Sharpe et al., 2004). The unconformity is overlain locally by a discontinuous ridge of ORM sediment, which extends from the Niagara Escarpment eastward to Trenton. The moraine comprises four wedge-shaped landform elements (Rice Lake, Pontypool, Uxbridge, Albion Hills) that generally broaden from east to west (Fig. 2). Sedimentological studies of core and surface exposures have found the moraine to consist of silt, sand and gravel with only minor clay and diamicton (White, 1975; Duckworth, 1979; Paterson, 1995; Gilbert, 1997; Barnett et al., 1998; Russell and Arnott, 2003). Recent interpretations of moraine genesis recognize it to represent several stages of sedimentation in a variety of subglacial and ice-contact glaciolacustrine depositional environments (Barnett et al., 1998; Russell et al., 2003a; Sharpe et al., 2003). Early moraine sedimentation was predominantly within tunnel channels and consists of coarse-grained gravel and diffusely graded sand (Shaw and Gorrell, 1991; Barnett et al., 1998; Russell et al., 2003a). Channel-fill strata are characterized by a number of seismic facies interpreted to be high-energy scour and fill, bedform foresets, and slump or mass-flow deposits (Pugin et al., 1999). A succession of low-energy glaciolacustrine silt and clay rhythmites overlies the channel fill sediment (Russell et al., 2003a). The rhythmite succession is, in turn, overlain by sand and gravel deposited from east to west during the main esker-subaqueous fan, ridge-building stage of the ORM (Paterson, 1995; Barnett et al., 1998; Russell and Arnott 2003). Along the southern flank of the moraine muddy lacustrine-rich Halton Till forms the final episode of moraine sedimentation (Barnett et al., 1998). Adjacent to the moraine, glaciolacustrine sand and silt were deposited in post glacial lakes Algonquin and Iroquois (Karrow et al., 1995). The timing of ORM deposition is well constrained stratigraphically to the Late Wisconsinan stage by the underlying Newmarket Till and overlying glaciolacustrine sediment.
Figure 4
A

B

Stratigraphic column and conceptual architectural model of the ORM area. (A) Stratigraphic framework modified by Karrow (1974). (B) Conceptual stratigraphic model of the central ORM area. Original art work by J. Glew.
Coupe stratigraphique et modèle conceptuel de l’architecture de la moraine de Oak Ridges. (A) Coupe stratigraphique modifiée par Karrow (1974). (B) Modèle conceptuel de la partie centrale de la moraine de Oak Ridges. Oeuvre originale de J. Glew.
Methodology
This study focuses on the western ORM within the 900 km2 Humber River watershed, located directly east of the Niagara Escarpment. A comprehensive understanding of the sediment facies and sediment facies associations of the western ORM is developed from outcrop and borehole data within the framework of a basin analysis approach (Potter and Pettijohn, 1963). Supplemental data includes a digital elevation model (Kenny et al., 1999), surficial geological mapping (Barnett and Gwyn, 1997; Russell and Dumas, 1997; Russell and White, 1997; Sharpe and Barnett, 1997), Ontario Ministry of Environment (MOE) water well records, geotechnical records (Russell et al., 1996), and seismic profiles (Fig. 5; Pugin et al., 1999; Pullan et al., 2004). Field observations have been classified into sediment facies and sediment facies associations based on texture and sedimentary structures (Eyles et al., 1983; Miall, 1984). Structural and isopach surfaces are from a regional stratigraphic model (Logan et al., 2005, in press).
To characterize the ORM morphology within the Humber River watershed a 100 m grid cell DEM (Fig. 6; Kenny et al., 1999) was used in conjunction with seven north-south topographic profiles ca. 25 km long and spaced 4.5‑8 km apart. The ORM area indicated on cross-sections is based on geological mapping, surface roughness, and elevation (Fig. 7).
Figure 5
A
Surficial Mapping Field Stations
B
Hydrogeology Drillhole Sites
C
Geotechnical and Seismic Data
D
MOE Water Well Data

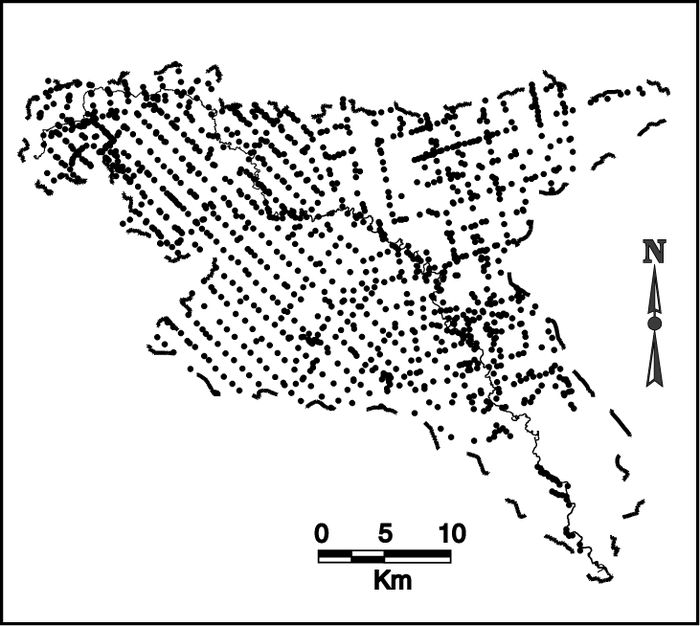
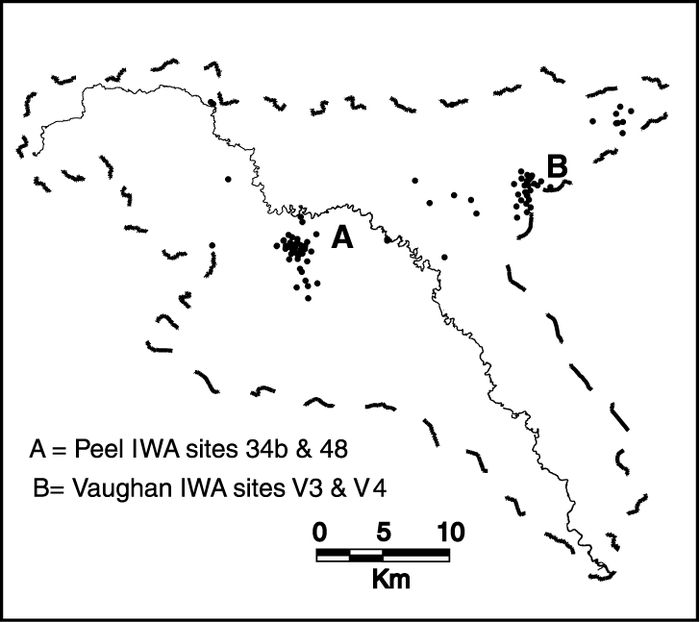
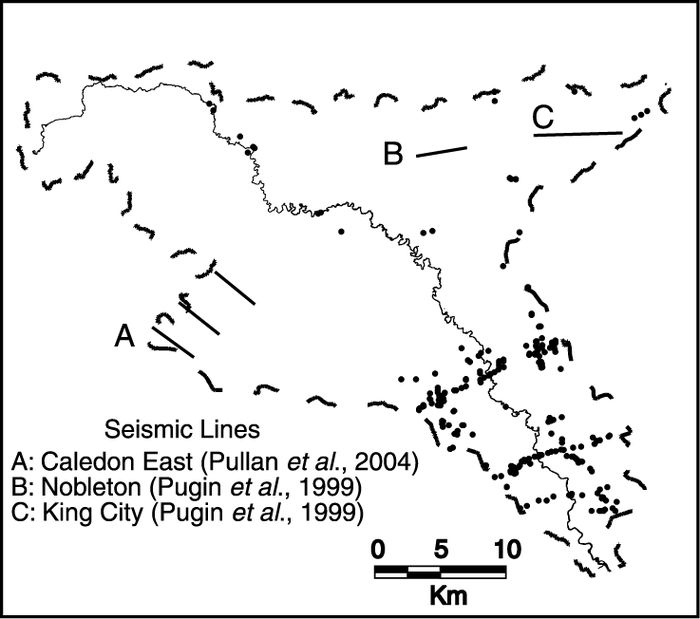
Datasets used to create the ORM structural and isopach maps. (A) Surficial geology field stations (n = 1 344) of Russell and White (1997). (B) Hydrogeology borehole data (n = 92) and location of two Interim Waste Authority (IWA) site. (C) Geotechnical borehole sites (n = 500) and location of seismic profiles (n = 5). (D) Selected Ministry of Environment (MOE) water well date based on deepest hole per 500 m grid cell (n = 2 028).
Données utilisées pour la création de la structure et des cartes de la moraine de Oak Ridges. (A) Géologie de surface (n = 1 344) de Russell et White (1997). (B) Données d’ydrogéologie (n = 92) et localisation de sites du Interim Waste Authority (IWA). (C) Données géotechniques (n = 500) et localisation de profils sismiques (n = 5). (D) Données de puits d’eau du Ministry of Environment (MOE) basées sur le puit le plus profond dans une cellule de 500 m (n = 2 028).
Figure 6

DEM of the Humber River watershed indicated by the solid line with the location of seven 25 km long north-south topographic cross-sections. Note irregular topography of the moraine between sections A and C. Steeper slopes on the southern moraine flank are indicated by deeper drainage incision. Smoother topography of moraine occurs where Halton Till is exposed at the surface. Elements of the regional physiography are labeled: (1) Niagara Escarpment, (2) tunnel channels, (3) ORM, and (4) Halton Till. Interpreted northern and southern position of ORM glaciolacustrine basin during formation of moraine ridge is shown by lines a‑a’ and b‑b’ respectively. Approximate minimum extent of grounded ice during stage III of deposition of the moraine and Brampton esker is shown by line c‑c’. White lines are major highways.
Modèle numérique d’élévation du bassin de la rivière Humber (ligne pleine) et localisation de sept sections transversales nord-sud de 25 km. Notez l’irrégularité de la moraine entre les sections A et C. Les pentes abruptes du flanc sud de la moraine sont liées à une incision profonde. La topographie plus douce de la moraine se produit aux endroits où le till de Halton est exposé. L’escarpement du Niagara, les chenaux en tunnel (tc), la moraine de Oak Ridges et le till de Halton sont localisés sur la figures. Les limites nord et sud du bassin glaciolacustre lors de la formation de la moraine de Oak Ridges sont montrées par les lignes a‑a’ et b‑b’. La ligne c‑c’ montre la superficie minimale de la moraine et de l’esker Brampton durant la phase III. Les lignes blanches représentent les autoroutes.
Geomorphology and surficial geology
Based on topography, surface roughness, and orientation of roughness elements four main regional physiographic elements are identified on the digital elevation model by: (1) the Niagara Escarpment and cuesta on the west, (2) drumlinized Newmarket Till, (3) steep-walled tunnel channels, (3) ORM, and (4) smooth Halton Till plain (Fig. 6). Within the 900 km2 Humber River watershed, the surficial sediment consists of Oak Ridges Moraine (140 km2, 15%), Halton Till (450 km2, 50%), and bedrock, where Newmarket Till and glaciolacustrine units account for the remaining 250 km2 (35%). In the watershed, the ORM forms an east-west ridge that has a maximum elevation of ca. 420 m asl where it onlaps the Niagara Escarpment, and a relief of ca. 100 m above the Halton Till plain to the south. The moraine ranges in width from 3 to 24 km (Fig. 7) and has an asymmetric cross-section with a steeper, ca. 3° northern flank that is commonly <5 km long, and a gentler southern flank that extends for 10‑20 km. The steepest ORM slopes are ca. 14°, but about 97% of the area has slopes <5°. Steep slopes commonly occur where Halton Till crops out along the sides of stream valleys. Adjacent to the Niagara Escarpment, the ORM surface sediment is sand and the landscape consists of disorganized, internally drained depressions and fluvially dissected topography (Fig. 7A). To the east, the ORM is extensively incised where sand crops out (Fig. 7B), but is significantly less dissected where Halton Till is exposed (Fig. 7D‑E).
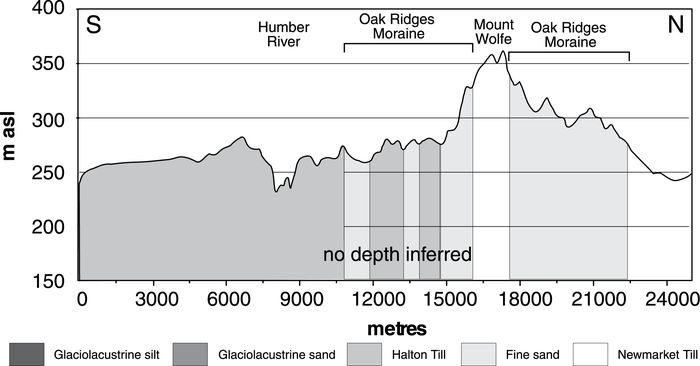
Figure 7
A

B

C
D

E

F

Six, 25 km long north-south topographic cross-sections spaced 4‑8 km apart. Note the ORM consists predominantly of sand and Halton Till at the surface. Surface sediment types are indicated only for the ORM area. Vertical exaggeration is ~23 times, axis scales are in metres. Note that no depth is inferred for shadded areas of surficial sediment.
Localisation de six coupes transversales nord-sud de 25 km de long et espacées de 4 à 8 km. La moraine de Oak Ridges est composée de sable et le till de Halton la recouvre. Les types de sédiments de surface sont seulement indiqués pour la région de la moraine de Oak Ridges. L’exagération verticale est d’environ 23 fois et les axes sont en mètres. L’estimation de la profondeur des sédiments de surface est inconnue dans les zones ombragées.
Stratigraphic architecture
The basal contact of the ORM stratigraphic unit has been mapped using seismic reflection, continuous core, geotechnical data and waterwell records (Fig. 5). The seismic reflection profiles are up to 4 km long and provide a continuous image of the sediment architecture. These data record key elements associated with the lower contact of the moraine sediment, bedrock valleys, sediment-hosted tunnel channels that extend to bedrock, shallow tunnel channels underlain by Newmarket Till or Lower sediment, and interchannel uplands with drumlins. Interpolation of stratigraphic picks from the combined data permits a continuous structural surface to be generated (Logan et al., 2005) and isopach map derived (Fig. 8A). The ORM sediment unit underlies an area of 645 km2 (72%) of the watershed. Of the well records reporting ORM sediment, 95% have a sediment thickness <89 m (Fig. 8B). From the structural and isopach surfaces the ORM is up to 245 m thick, but is <50 m thick over 75% of the area (Fig. 8C). Thickness of the ORM sediment decreases dramatically where it onlaps the Niagara Escarpment (northwest corner) and south of the Humber River beneath Halton Till (Figs. 8‑9). The thickest ORM sediment occurs in topographic lows along the basal unconformity (Figs. 8‑9). The buried northeast-southwest trending bedrock Caledon East valley, for example, is filled with sediment >150 m thick (Fig. 8). In the north-central part of the watershed, the northwest-southeast trend of >100 m sediment thickness is the buried valley intercepted by the Nobleton borehole and seismic line. A small semicircular, >100 m, sediment thickness, on the east boundary of the watershed coincides with the buried valley intercepted by the Vaughan borehole (Fig. 8).
Figure 8

Maps and histograms of ORM thickness. (A) Isopach map with 50 m contour intervals. (B) Histogram of ORM thickness in primary data. (C) Histogram of ORM thickness in interpolated data with a 30 m grid cell.
Cartes et histogrammes de l’épaisseur de la moraine de Oak Ridges. (A) Carte avec des lignes de contour à chaque 50 m. (B) Histogramme de l’épaisseur de la moraine de Oak Ridges à partir des données primaires. (C) Histogramme de l’épaisseur de la moraine de Oak Ridges à partir d’une grille d’interpolation de 30 m.
The ORM overlies an irregular surface that is correlated with a regional unconformity consisting of tunnel channels and drumlinized Newmarket Till north of the ORM (Shaw and Gilbert, 1990; Sharpe et al., 2004). Three topographic lows are interpreted to be tunnel channels based on the downflow projection of exposed tunnel channels north of the ORM (Figs. 2‑3), character of strata in continuous core (Russell et al., 2003a), and seismic data (Pugin et al., 1999). From east to west these channels are informally referred to as the King City, Holland Marsh and Caledon East tunnel channels (Fig. 8).
Sedimentology
Sediment facies composition
Sediment obtained from 600 m of drillcore at 11 sites, and ca. 150 m of vertical profiles from outcrop were described in detail (Figs. 3, 10‑13). These data have been grouped into six sediment facies, and are summarized in Tables I, II and III, for more detailed discussion see Russell (2001), Russell et al. (2003a), and Russell and Arnott (2003). Consequently, discussion of sediment facies is summarized as sediment facies associations. Overlying the southern flank of the ORM stratigraphic unit is Halton Till. Halton Till is a unit of interbedded diamicton and glaciolacustrine-glaciofluvial sediment that have been interpreted to be a late-stage episode of ORM sedimentation (Barnett et al., 1998). It is not discussed further here (see Russell and Arnott, 1997). In continuous drillcore the predominant ORM sediment facies is graded fine-sand to silt (ca. 56%) and small-scale, cross-laminated, fine sand (ca. 17%). Other sediment facies are common locally, for example, in drillcore DH‑Nob 32% is gravel, in DH‑V‑158 30% is sand facies, and in DH‑P‑14 small-scale, cross-laminated sand facies is ca. 32%. Lack of exposed ORM sediment limits the ability to map sediment facies continuity laterally. In two aggregate pits, however, relatively coarse textured sediment facies have rapid sediment facies changes in both flow-transverse and flow-parallel directions (Fig. 13). Along the Humber River, in less laterally extensive river cut exposure (<100 m), finer grained sediment facies appear to form tabular units.
Paleoflow
Paleoflow measurements derived from imbricate gravel-clast fabric and cross-stratified sand were collected at five sites across the ORM. All measurements were made in the upper part of the ORM unit within 10 m of the contact with overlying Halton Till. At three sites separated by ca. 1‑6 km on the south side of the ORM, and along the Humber River, a total of 267 paleoflow measurements were made in climbing cross-laminated, fine sand (Fig. 10B). Locally, measurements have a preferred orientation, but in general the pattern is highly variable. In the stratigraphically lowest strata paleoflow directions are toward the west, northwest, and north (Fig. 10B). In contrast, measurements higher in the stratigraphy, for example, at sites 186 and PG, are toward the southeast, and toward the northwest at site PG‑II (Fig. 10B). Measurements taken ca. 8 km to the north, near Bolton, in cross-stratified sand indicate a westerly direction. Ten kilometers to the north, on the north side of the ORM, paleoflow measurements have a bimodal distribution with modes toward the west and northwest (Fig. 13).
Figure 9
A

B
C
D

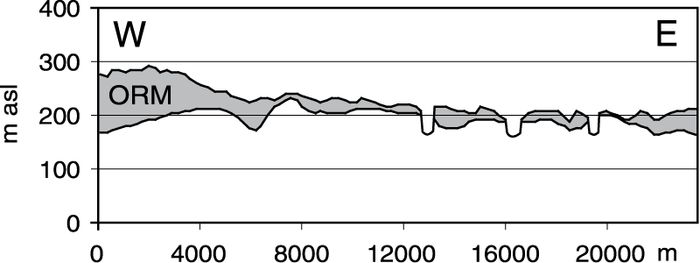
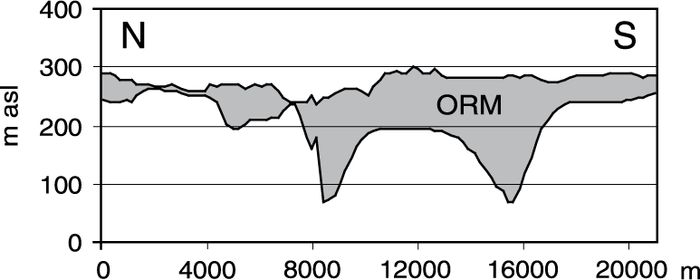
Cross-sections of the ORM showing top and bottom surfaces. (A) East to west cross-section of the ORM crest. (B) East to west cross-section across the Halton Till plain. (C) North to south cross-section downflow of the Holland Marsh and including the Caledon East buried valley. (D) North to south cross-section of the eastern side of the watershed.
Coupes transversales de la moraine de Oak Ridges. (A) Coupe transversale est-ouest de la crête de la moraine de Oak Ridges. (B) Coupe transversale est-ouest de la plaine du till de Halton. (C) Coupe transversale nord-sud du marais de Holland et de la vallée de Caledon East. (D) Coupe transversale nord-sud de la partie est du bassin.
Sediment distribution
The integration of new field data with archival data permits a comprehensive overview of the sediment distribution within the ORM. Estimates of the gravel-sand-silt-clay composition of the ORM are well supported by respective datasets (Logan et al., in press). Identification of sediment grain size finer than fine sand in waterwell records are unreliable (Russell et al., 2001; Logan et al., in press). Consequently, only percentages of sand and gravel in records are discussed here as these textures are consistently reported across all datasets (Logan et al., in press). Of a total of 2 299 records interpreted as penetrating ORM sediment, 19% and 82% have no gravel or sand, respectively. The gravel distribution is strongly associated with the basal contact of the ORM stratigraphic unit: 50% of gravel units directly overlie the basal unconformity and ca. 75% occur within 10 m of the basal contact (Fig. 14A). This distribution is consistent with observations from several hundred shallow (<4 m deep) sites that contain little gravel (Fig. 5A). At depth, gravel is concentrated within the ridge area of the ORM defined by the 270 m contour with relatively little gravel beneath Halton Till south of this elevation. Gravel units are predominantly <10 m thick (60%), with units thicker than 20 m being rare (7%; Fig. 14B). As a percentage of total ORM sediment thickness, sand and gravel exceeds 50% of the unit thickness for 25% of the records. The complete stratigraphic thickness of ORM is formed of gravel in 5% of the data and sand ca. 15%. The net sand and gravel in individual records is <20 m for 80% of the data.
The abundance of gravel overlying the regional unconformity in waterwell records correlates well with observed gravel deposits in continuous core (Fig. 10A) seismic interpretations, and field mapping (cf. Russell and Dumas, 1997; Pugin et al., 1999; Sharpe et al., 2003). At DH‑Nob (Fig. 10A) gravel overlies the unconformity on truncated Thorncliffe Formation, whereas in seismic profiles to the east, gravel overlies drumlinized Newmarket Till (Pugin et al., 1999). The distribution of gravel at the base of the ORM correlates with observed gravel occurrence north of the ORM on Newmarket Till uplands (Russell and Dumas, 1997). Gravel overlying the regional unconformity is interpreted as being deposited during initial stages of tunnel channel formation; that is during the transition from subglacial sheet flow to channelized flow. Gravel occurring high in the ORM unit is interpreted to have been deposited in proximal environments such as the core deposits of subaqueous fan or esker deposits (see below).
Figure 10

Graphic stratigraphic log of DH‑Nob core and three vertical sections along the Humber River. Legend is the same for Figures 11‑12. Note thick gravel deposit overlying the unconformity in DH‑Nob. See Figure 4 for location.
Coupe stratigraphique du forage de DH‑Nob et de trois autres sections situées dans le bassin de la rivière Humber. La légende est également la même pour les figures 11 et 12. Notez la présence d’un dépôt graveleux épais qui surmonte l’inconformité dans la coupe DH‑Nob. Voir la figure 4 pour la localisation du forage.
Figure 11

Graphic stratigraphic logs of three continuous cores from the Vaughan IWA site, northeastern Humber River watershed. Interbedded glaciolacustrine and diamicton Halton Till overlies ORM sediment. Note the ca. 40 m thick diffusely graded sand in the lower part of DH‑V‑158. See Figure 10 for description of symbols.
Coupe stratigraphique de trois forages continus au site de IWA Vaughan, nord-est du bassin de la rivière Humber. Des sédiments glaciolacustres entrecroisés et le diamicton du till de Halton surmontent les sédiments de la moraine de Oak Ridges. Notez la présence d’une couche diffuse de sable d’environ 40 cm dans la partie inférieure du forage DH‑V‑158. Voir la figure 10 pour la description des symboles.
Figure 12
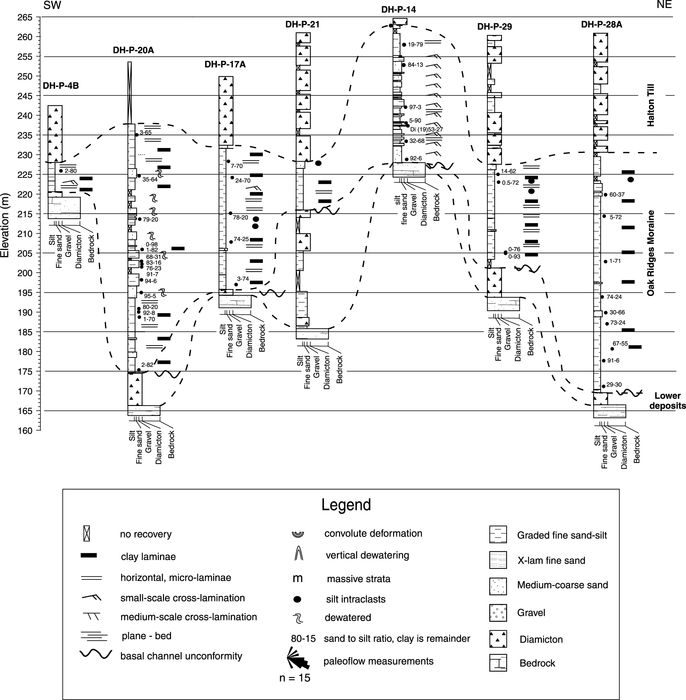
Graphic stratigraphic logs of seven continuous cores from the Peel IWA sites, southwestern Humber River watershed (Figs. 4‑5B). Halton Till overlies ORM. Note how Halton Till complex drapes underlying deposits. Clay laminae are only observed in valleys.
Coupe stratigraphique de sept forages continus au site de IWA Peel, sud-ouest du bassin de la rivière Humber (Figs. 4‑5B). Le till de Halton surmonte la moraine de Oak Ridges et remarquez sa complexité de recouvrement des sédiments. Des argiles laminées sont seulement observées dans les vallées.
Sediment facies associations
The complete ORM unit or parts of the succession have been attributed to a number of different sediment facies associations, including: tunnel channel fill (Barnett et al., 1998), suspension and turbidite basin sediment (Gilbert, 1997), subaqueous fan (Paterson and Cheel, 1997), and deltaic and braided stream deposits (Duckworth, 1979). Three sediment facies associations are recognized in the Humber River watershed (Fig. 15); tunnel channel, basin rhythmite, and subaqueous fan associations (Russell and Arnott, 2003; Russell et al., 2003a).
Tunnel channel fill association
The ORM tunnel channels are asymmetric in cross-section, locally overdeepened, and may erosionally overlie Newmarket Till, lower sediment, or bedrock (Fig. 15). The Humber River watershed tunnel channels are 10‑20 km long, <5 km wide and up to 170 m deep (Pugin et al., 1999). Channel fills consist of four sediment facies that have a distinctive spatial and stratigraphic organization. Gravel distribution in the basal part of tunnel channels is highly variable. In the Caledon East buried bedrock valley/tunnel channel, gravel is common in a unit about 40 m thick, 1 500 m wide, and 6‑8 km long (Russell et al., 2004). Elsewhere, gravel has been intercepted along the elevated tunnel channel margin at DH‑Nob where it forms a broad tabular deposit 500 m wide and ca. 20 m thick (Figs. 10, 15). On the basis of high resolution seismic reflection data with borehole control, this unit is interpreted to consist of stacked, >4 m high, mesoforms and low-relief gravel sheet deposits emplaced by flows from the north (Russell et al., 2003a). The most common strata in the channel axis have a chaotic seismic facies signature. West of the borehole DH‑Nob, downflow of the exposed Holland Marsh tunnel channel to the north, the deposits are 80‑100 m thick and extend laterally across the channel for 3‑4 km (Pugin et al., 1999). The chaotic seismic facies has been correlated with diffusely graded/massive and interbedded cross-stratified sand forming a 50 m thick tunnel channel fill ca. 8 km to the southeast at DH‑V‑158 (Fig. 11; Russell et al., 2003a). The DH‑V‑158 site occurs in the terminal reaches of a separate channel that is part of a regional channel network and is inferred to be the proximal equivalent of more distal, climbing, small-scale, cross-stratified fine sand observed in Humber River valley sections (Fig. 10B).
Figure 13

Graphic stratigraphic logs for the Gormley aggregate pit. Sections are arranged from west to east. Regional paleoflows is from east to west (right to left). Figure has been modified from Russell and Arnott (2003).
Coupes stratigraphiques du site de Gormley. Les coupes sont alignées de l’ouest vers l’est. Les paléoécoulements vont de l’est vers l’ouest (de droite à gauche). La figure a été modifiée à partir de Russell et Arnott (2003).
Table I
Summary of diamicton and gravel lithofacies in the western Oak Ridge Moraine
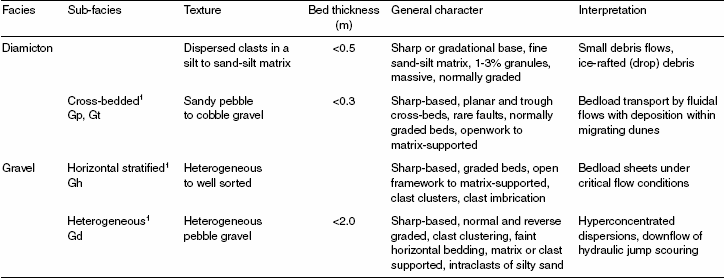
Sediment sub-facies described in detail in previous publications (Russell and Arnott, 2003; Russell et al., 2003a).
Subaqueous fan association
Proximal subaqueous fan deposits are described from aggregate pits, whereas distal subaqueous fan are intercepted in drillcore and river-cuts. The proximal subaqueous fan deposits consist of medium-scale cross-stratified, horizontally bedded and massive sand and gravel (Russell and Arnott, 2003). More distal deposits are predominantly small-scale cross-stratified fine sand, silt, and rare clay laminae. Strata fine rapidly in a streamwise direction and fine upward (Fig. 13). The proximal part of the fan is lithologically diverse and consists of five sediment facies sub-associations (Russell and Arnott 2003). The most proximal fan-core sub-association consists of massive heterogeneous and horizontal-bedded cobble and pebble deposits (Fig. 16A‑B). Facies change stratigraphically upward from cross-stratified to massive or planar-stratified gravel and commonly have abrupt contacts. Downflow facies change rapidly from massive gravel grading to cross-stratified sand in less than 10 m. The flanking fan-core association consists of downlapping, low-angle cross-stratified sand and cross-stratified sand with minor gravel (Fig. 16C). Locally, these strata are truncated by the steep-walled scour sub-association that in most places occurs downflow of the fan-core sub-association (Fig. 16D). The steep-walled scours are up to 10 m wide and 3 m deep and filled mostly with diffusely graded sand. The steep-walled scour sub-association defines an important hydraulic boundary in the streamwise facies arrangement, beyond which no gravel was transported (Russell and Arnott, 2003). Downflow, the gently-inclined bedset sub-association is up to 8 m thick and consists of 5‑10° dipping surfaces overlain by planar cross-stratified, medium sand and small-scale cross-laminated, fine sand. Climbing, medium-scale cross-strata are common; more distally small-scale cross-lamination predominates (Figs. 16E‑F, 17A). The medium-scale cross-stratified sand generally fines upward. The more distal lower fan succession is overlain locally by a shallow-channel sub-association, which consists of broad (depth-width <1:5), nested channels that truncate underlying sandy strata. These channels are mostly filled with planar and trough cross-stratified, medium sand. Subaqueous fan deposits are commonly capped by rhythmically bedded silt and clay.
Table II
Summary of sand lithofacies in the western Oak Ridge Moraine

Table III
Summary of sand-silt and clay lithofacies in the western Oak Ridge Moraine

Individual subaqueous fan associations have not been mapped within the ORM unit. Proximal parts of the association can extend, 10’s to 100’s of metres in a streamwise direction, whereas the finer, more distal part, extend for 1 000’s of metres. An individual fan association can be 10’s of metres thick, but typically are <30 m thick. Transverse to flow, the width of the association is highly variable depending upon the scale of discharge, conduit diameter, and periodisity of discharge. In the proximal zone, widths are probably 10’s of metres expanding to 100’s of metres downflow.
Basin rhythmite association
The basin sediment facies association consists of a rhythmic succession of small-scale cross-laminated sand, graded sand-silt, and clay. Commonly, the coarsest strata occur in the lower part of the rhythmite and form one or more fining-upward cycles that are overlain by a clay layer. The basin rhythmite association occurs between 170‑270 m elevation with >70% occurring between 190 and 230 m. In outcrop, units can be traced for tens of metres laterally with only minor change in character. Small-scale, cross-laminated and graded fine sand and silt (Si, Sr) form >95% of the association and range in thickness from 1 cm to 4‑5 m. The maximum thickness is 16 m. Two different rhythmite assemblages are observed: one dominated by normally-graded sand-silt strata (Fig. 17), and a second thicker but less common assemblage including massive, normally-graded sand-silt, and small-scale cross-laminated sand.
Figure 14
A
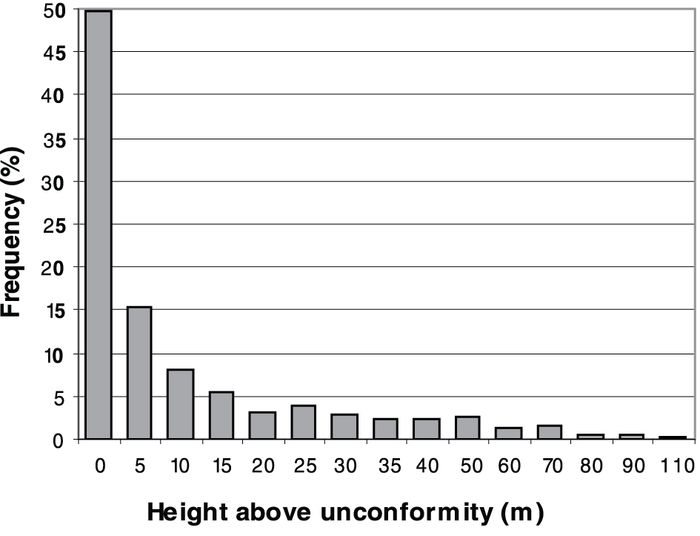
B

C

Characterisation of ORM composition. (A) Height of gravel units above the regional unconformity below the ORM. (B) Net gravel thickness in ORM dataset. (C) Net sand thickness in ORM dataset.
Composition de la moraine de Oak Ridges. (A) Hauteur des unités de graviers au-dessus de l’inconformité régionale et en-dessous la moraine de Oak Ridges. (B) Épaisseur nette des graviers dans la moraine de Oak Ridges. (C) Épaisseur nette des sables dans la moraine de Oak Ridges.
In core the number of clay-topped rhythmites ranges from 6 to 69 (Figs. 10‑12, 18). A total of 300 rhythmites with clay tops was measured. Of the total, ca. 80% are <1 m thick. Of the rhythmites >1 m thick, 75% (n = 51) contain some amount of missing core. This suggests that thicker intervals with missing core may represent multiple amalgamated clay topped rhythmites where drill-core sampling failed to recover some clay horizons. Using a qualitative technique of matching thickness, sequence rhythms, and number, rhythmites can be correlated between a number of cores in the Peel IWA site (Figs. 4A, 5, 18). For example, cores DH‑P‑20a and DH‑P‑17a are separated by ca. 2 km, and in the two cores 22 rhythmites can be matched (Fig. 18). This correlation is possible even where individual rhythmite thickness varies by more than an order of magnitude between sites. Elsewhere, correlating over distances <500 m can be tenuous.
The areal distribution of the basin rhythmite association is poorly constrained because it is only recognized in continuous core. Archival data, particularly waterwell records, lack the resolution to reliably interpret this association. The rhythmite association has been interpreted to overlie the tunnel-channel-fill association and to be generally restricted to channel areas (Russell et al., 2003a). Where correlation of rhythmites is possible it suggests similar depositional controls between sites, and consequently deposition in a single basin. Individual rhythmite thickness varies substantially but correlation of rhythmite patterns at the Peel site suggests a single depositional control such as annual meltwater-sediment flux. Such a control suggests surface connection of the meltwater system and the basin.
Depositional model
A depositional model for the western ORM must integrate the sedimentological data presented in this study, as well as regional physiography, surficial geology, and the deglacial history from previous workers (Barnett, 1992). Sediment facies and sediment facies associations of ORM strata constrain interpretations of the local depositional processes, in addition to the timing, and magnitude of formative processes. Paleoflow measurements provide local constraints on the direction of the depositional flow, whereas, elements of the regional physiography provide a framework for the depositional and erosional events during the Late Wisconsinan stage. Landform and sediment associations also provide evidence for the reconstruction of a regional unconformity upon which the ORM occurs in the Humber River watershed. Within the paleogeographic setting a three stage depositional model for the ORM is presented: (I) subglacial channel fill, (II) rhythmite sedimentation, (III) esker-subaqueous fan development. The stages generally form a depositional continuum; however, it is possible that depositions of some elements of stage II and stage III are contemporaneous but separated spatially.
Figure 15

Sketch of sediment facies associations logs along an east-west cross-section of the ORM architecture, in the Humber River watershed. Upper case roman numerals and letters indicate the main sediment facies associations; I, tunnel channel, II, basin rythmite, and III, subaqueous fan. Lower case roman numerals indicate elements of the subaqueous fan association defined within the figure. Fan is shown as fining from east to west.
Illustration des associations de faciès sédimentaires d’une coupe transversale est-ouest de la moraine de Oak Ridges, dans le bassin de la rivière Humber. Les chiffres romains en majuscules et les lettres indiquent les principaux faciès; où I sont les chenaux en tunnel, II, les varves et III, le cône subaquatique. Les chiffres romains en minuscules indiquent les éléments du cône subaquatique. Le cône s’amincit de l’ouest vers l’est.
The unconformity
The surface of drumlinized Newmarket Till and exposed tunnel channels north of the study area are elements of a regional unconformity that can be traced from Georgian Bay eastward ca. 240 km to the Kingston area (cf. Sharpe et al., 2004). This unconformity has been traced beneath the ORM on seismic data (Pugin et al., 1999) and in continuous core (Russell et al., 2003a). A variety of erosional forms along the unconformity suggest that during the Late Wisconsinan a subglacial outburst flood swept southward from the Canadian Shield and extensively eroded the terrain of this part of southern Ontario (Sharpe et al., 2004), the Niagara Escarpment (Kor and Cowell, 1998), and probably beyond (Shaw and Gilbert, 1990; Munro-Stasiuk et al., 2005). Drumlins were eroded by this regional sheet flood (Fig. 19A) and localized erosion of Newmarket Till was related to spatial and temporal variations in turbulent flow structure and large-scale vortices (Fig. 19B; Shaw, 1996). Discharge became more focused as the sheet flow evolved quickly to a channelized flow forming tunnel channels (Brennand and Shaw, 1994). Once formed, tunnel channels may have preferentially captured ongoing meltwater discharge events (Shoemaker, 1999). North of the ORM, exposed Newmarket Till has a hierarchy of channel scales, from shallow channels to km wide and 10’s km long tunnel channels, which locally are eroded to bedrock (Russell et al., 2003b). Shallow channels are interpreted to represent the incipient stage of channel formation (Russell et al., 2003b; Sjogren et al., 2002).
Stage I: Subglacial channel fill
Shallow channel sedimentation
Northwest of the Holland Marsh, shallow channels on the Newmarket Till upland are partially filled with sand and gravel (Russell and Dumas, 1997). Southward, and at the base of the ORM, gravel deposits which are up to 20 m thick and account for 50% of gravel in the stratigraphic unit, are here interpreted to be shallow channel fills. Gravel in interfluvial areas of shallow channels was deposited during the incipient stages of channel formation. Deposition in shallow channels on the uplands occurred as the regional sheet flood collapsed and preferentially eroded wide, deep channels that captured most of the meltwater discharge (Brennand and Shaw, 1994; Shaw, 1996; Fisher et al., 2005).
Deep channel sedimentation
Channel erosion and deposition was incremental and responded to changes in the outburst flood discharge and ice sheet dynamics (Fig. 19B). An initial high-sediment flux along channels is indicated by large gravel bedforms observed in channels north of the moraine (Shaw and Gorrell, 1991) and buried channels beneath the ORM (Sharpe et al., 2003). Gravel was also deposited on raised channel margins (e.g. at Nobleton) within migrating gravel dunes which based on intepretation of seismic reflection data were of the order of 4‑5 m high and consequently deposited in flow depths of ca. 20 m (Fig. 19C). A seismic transect across the Nobleton channel indicates that the channel thalweg was eroded an additional 100 m following emplacement of the gravel deposits on the east channel flank (Pugin et al., 1999). The extent of channel erosion, and most probably the rate of channel incision, varied along and across channels. Localized erosion was potentially aided by over-pressurized sandy aquifers that caused groundwater to flow toward lower pressure areas that coincided with newly formed scours/channels (Piotrowski, 1997). Accordingly, extensive sediment piping along the scour margins entrained additional sediment into the flow and significantly accelerated vertical and lateral scour/channel growth. Locally, these zones of intense scour erosion may have occurred at channel confluences or the margins of subglacial cavities where flow underwent rapid expansion. Within confined subglacial conduits supercritical flows upon encountering zones of flow expansion could have been sites of hydraulic jumps. These zones likely ranged from localized features 10’s‑100’s m long to large regional features such as the proposed subglacial lake within the Lake Ontario basin (Shoemaker, 1999). For hydraulic jumps to form in the absence of stratified flow, open connection to the glacier surface would be necessary to permit flow expansion. Under conditions of either hydraulic jumps or channel confluences, large-scale vortices would scour, entrain, and transport sediment downflow. Because of the high sediment load, the flow most probably became stratified with an upper fully turbulent region and an underlying thinner hyperconcentrated region (Sohn, 1997). Depending upon the rate of sedimentation and the thickness of the flow, massive, inverse-, or normal-graded strata were deposited (Figs. 11B, 19C). Similar stratal characteristics have been interpreted from seismic data from the Holland Marsh channel at Nobleton (Pugin et al., 1999). To the southeast of the Nobleton site, within the King City channel, diffusely graded sand (Fig. 11B) is interpreted to have been deposited within a zone of flow expansion at the margin of a subglacial lake in the Lake Ontario basin (Russell et al., 2003a). Interbeds of cross-laminated sand within the diffusely graded sand succession indicate that flow energy fluctuated temporally and/or spatially between hyperconcentrated and bedload depositional conditions. Thick accumulations of climbing small-scale, cross-laminated sand at sites PG and PG‑II (Fig. 12), ca. 10 km downflow to the southwest of site DH‑V‑158, were probably deposited by the same events that deposited the diffusely graded and reverse-graded sand in the more proximal part of the Holland Marsh and King City tunnel channels. The apparent divergent paleoflow directions, northwest, north, and southwest at sites PG and PG‑II may be explained by the radially expanding flow within a subglacial basin, deposition from deflected flows, or deposition within a large reverse-flow eddy. Variable paleoflow directions are a common element of many subaqueous fan deposits (Gorrell and Shaw, 1991) and submarine turbidite systems (Pickering et al., 1989). This necessitates the evaluation of these data in a regional context. On a southerly downflow trajectory of the King City tunnel channel, within Lake Ontario, ca. 50 m thick glaciolacustrine sand and silt deposits overlying the regional unconformity have been identified (Lewis et al., 1997a). The sediment may be distal equivalents of channel fill deposits presented in this study. Stratigraphically upward, the diffusely graded sand of stage I is intercalated with small-scale, cross-laminated, fine-sand and the first appearance of clay strata that define the rhythmite association. The transition to the rhythmite association records a decrease in sedimentation rate, flow energy and a reduction in meltwater discharge within the tunnel channel system.
Figure 16
A

B
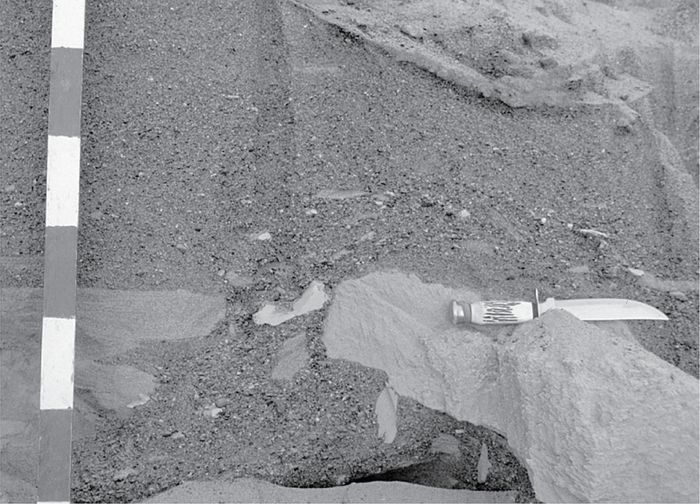
C
D

E
F

Photos of selected elements of the subaqueous fan facies assemblage. (A) Planar-stratified gravel with upward fining couplets, clast clusters, and open-work pebble beds; paleoflow toward the right. (B) Unconsolidated sand intraclast in massive and inverse-graded sandy gravel; paleoflow to the right. (C) Low-angle cross-stratified medium sand interpreted as antidune cross-stratification. (D) Diffusely graded fine sand filling a steep-walled scour. (E) Succession of climbing ripple-scale cross-laminated fine sand; paleoflow is from right to left. (F) Stoss-depositional, climbing ripple-scale cross-lamination; note the steep angle of climb and well-graded beds, coin is 2.5 cm in diameter. One metre scale stick has 10 cm divisions.
Photographies des faciès sédimentaires du cône subaquatique. (A) Gravier plat et stratifiés avec des couplets fins orientés vers le haut, amas d’erratiques et lits de galets remaniés; le paléoécoulement est orienté vers la droite. (B) Inclusions de sable non-consolidé dans du sable graveleux massif et inversé; le paléoécoulement est orienté vers la droite. (C) Lits entrecroisés de sable moyen à faible pendage interprétés comme une stratification entrecroisée typique aux antidunes. (D) Sable fin diffus dans une zone de surcreusement. (E) Succession de sable fin laminé en rides; le paléoécoulement est orienté vers la gauche. (F) Rides laminées ondulées; remarquez l’ange d’inclinaison des lits, la pièce a un diamètre de 2,5 cm. L’échelle métrique est graduée à chaque 10 cm.
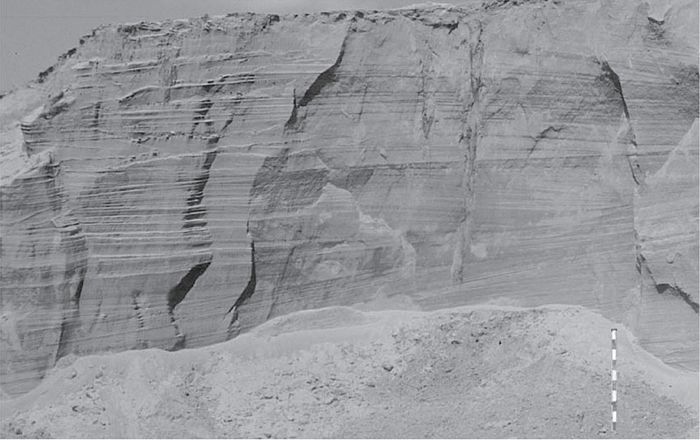
Figure 17
A

B

C

Photos of sediment facies of the basin rhythmite association. (A) Normally graded beds of fine sand and silt with minor drilling-induced deformation. (B) Normally graded, microlaminated, fine sand and silt. (C) Normally graded fine sand and silt overlain by a clay bed.
Photographies des faciès sédimentaires des varves. (A) Lits normaux de sable fin et de limon avec une faible déformation associée au forage. (B) Lits normaux de sable fin et de limon microlaminés. (C) Lits normaux de sable fin et de limon surmontés d’un lit argileux.
Stage II: Rhythmite sedimentation
Rhythmites gradationally overlie stage I channel fill sediment within bedrock and sediment-walled tunnel channels (Figs. 9, 19D). The succession forms a 25‑50 m thick interval within buried tunnel channels but is absent or thin, <8 m thick, beyond the tunnel channel margins. Initially rhythmite deposition consisted of small-scale cross-laminated sand that fines upward and is progressively overlain by the fine sand to silt facies that culminates in a clay lamina. At DH‑V‑158, the interval consists of ca. 60 rhythmites that thin and fine upward for 25 m and then coarsen and thicken upward (Fig. 18). The upward-fining trend is locally interrupted by thicker rhythmites interpreted to record seasonal variation in discharge, or point-source sediment input and an order of magnitude increase in sedimentation rate (Fig. 18). The gradational transition from channel fill to rhythmite deposition was probably in response to the end of the stage I outburst flood event and the onset of seasonal meltwater discharge and sedimentation in a glaciolacustrine setting. Graded laminae most probably record deposition by unsteady underflows related to the diurnal meltwater flux (Gilbert, 1997). The graded, fine-sand and silt that form the rhythmites correspond to b and c division of a Bouma turbidite whereas the overlying clay corresponds to the d-division (Pickering et al., 1989). The upper clay lamina of each rhythmite records deposition by low-energy suspension sedimentation during winter. Each clay laminae, therefore, may represent the culmination of a single year of sedimentation and thus the rhythmites are tentatively interpreted to be varves (Banerjee, 1973; Ashley, 1975; Gustavson, 1975; Gilbert, 1997).
Figure 18
A
Peel IWA Site

B
Vaughan and Nobleton sites
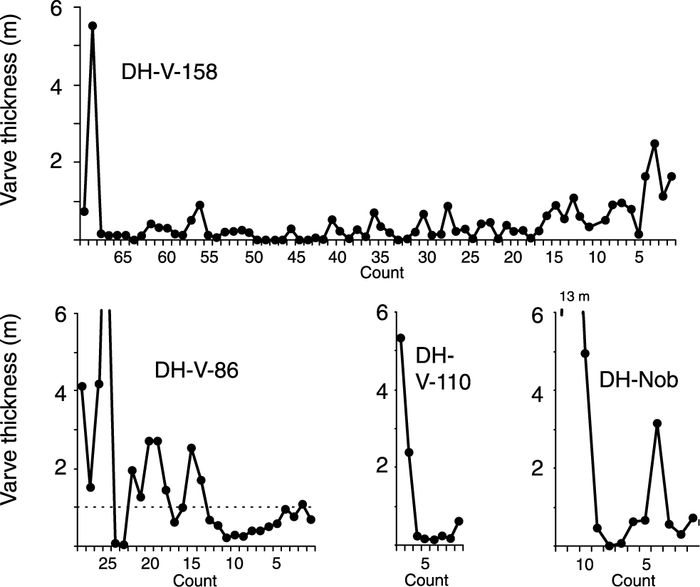
Varve diagram for core data showing varve thickness and varve count from lowest varve (right) upward (left). Arrows indicate potentially correlative varves. Note the thicker varves in DH‑P‑20a compared to DH‑P‑17. Italized numbers are elevation above sea level.
Diagramme de l’épaisseur et du comptage des varves, de la varve inférieure (droite) vers le haut (gauche). Les flèches indiquent la corrélation possible des varves. Comparez la différence de l’épaisseur des varves des sites DH‑P‑20a et DH‑P‑7. Les chiffres en italique indiquent l’élévation du niveau de la mer.
Across the area individual varves in bedrock valleys and in tunnel channels may not be coeval and may have been deposited in isolated basins or cavities instead of in a single contiguous glaciolacustrine setting. Regional reconstructions of the ice-sheet margin at this time (ca. 13‑14 ka) do not indicate occurrence of subaerial lakes (Barnett, 1992). Consequently, a subglacial setting is interpreted with ice attached to the substrate across interfluves and bedrock highs but not in the channels. Deposition was restricted to ponded water (glaciolacustrine) within tunnel channels and bedrock valleys. Varves record a period of low-energy sedimentation that in the southwest part of the watershed (Peel site) lasted for <40 years and 20 km to the northeast at the Vaughan site for ca. 60 years. Direct correlation of varves across the study area, or beyond to more easterly parts of the moraine (Gilbert, 1997), may not be possible; however, there is an emerging similarity of varve counts in the range of 60 to 100 along the length of the ORM. In the southwest part of the watershed, the rhythmite association of stage II is overlain gradationally by Halton Till which records fluctuating grounded-ice conditions and minimal meltwater-sediment influx to this area during the remainder (Stage III) of ORM deposition. At other locations within the ORM, stage II rhythmites are gradationally overlain by coarser grained strata deposited during stage III.
Stage III: Ridge construction (esker-subaqueous fan)
The change from stage II to stage III is marked by upward-thickening and coarsening of the varve succession and eventually an absence of suspension deposits that record an increase in the meltwater discharge. This stage of ORM formation occurred in an ice-marginal basin controlled by the Niagara Escarpment to the west. Ridge morphology (Fig. 6), the extent of exposed surficial sediment (Fig. 7), and areal variation in ORM thickness (Fig. 8) suggest that stage III deposition was restricted to the ORM ridge in a basin that was 30‑40 km long (east-west) and <20 km wide (Fig. 19E).
The location of the northern basin margin and ice margin grounding line is constrained north of the ORM by the underlying Newmarket Till that crops out along the edge of exposed ORM sediment (Fig. 6; Sharpe et al., 1997). The southern basin margin and grounding line is defined approximately by changes in ORM thickness (Figs. 8‑9), surface slope in the vicinity of the 250 m contour (Fig. 6), and the Brampton esker (Figs. 3, 6). This interpretation is further supported by relatively thin, discontinuous ORM sediment beneath the Halton Till suggesting that ice was grounded below this elevation. To the south of the ORM, the Brampton esker provides paleogeographic control (Saunderson, 1975, 1976). The esker is stratigraphically equivalent to the upper ORM sediment and was deposited in an ice-cover conduit. The northwest paleoflow direction indicates south to north hydraulic gradient. To sustain this esker conduit grounded ice would likely be required along the 30‑40 km length of the landform. Consequently, if a subglacial lake existed in the Lake Ontario basin during ORM ridge construction, the Brampton esker provides some constraint on the width of the grounding zone adjacent to the subglacial lake.
Figure 19
A
Sheet-flood erosion

B
Tunnel channel erosion
C
Stage I : channel fill

D
Stage II : rhythmite sedimentation
E
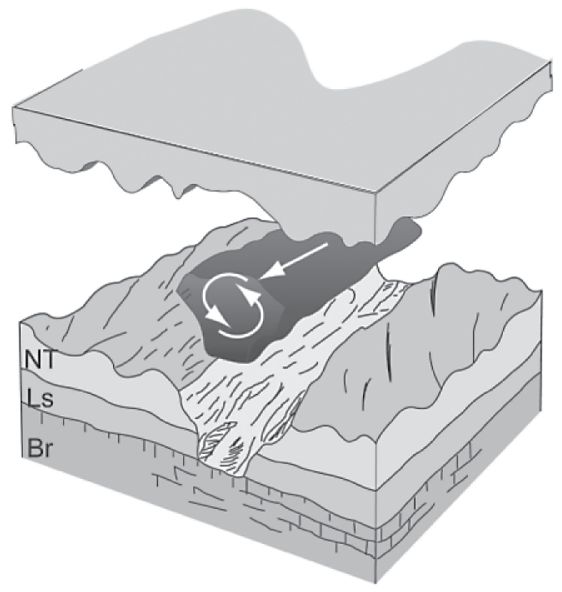
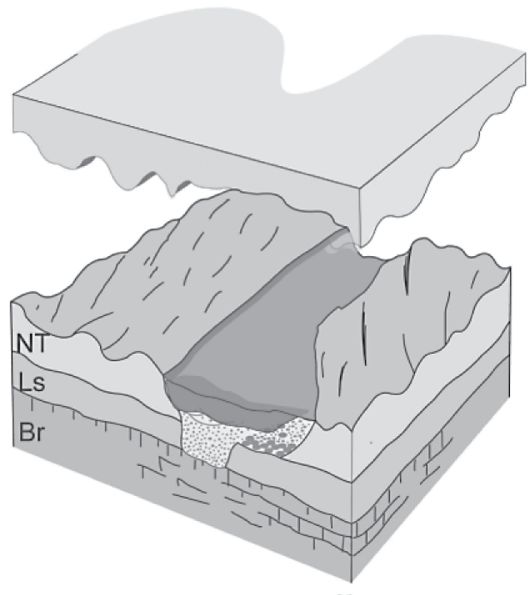
Stage III : basin setting

F
Stage III : subaqueous fan sedimentation

Diagrams outlining the depositional history of the ORM. (A) Sculpting of Newmarket Till into drumlins by regional sheet floods. (B) Tunnel channel erosion by episodic outbreak floods. (C) Stage I channel fill showing diffusely-graded sand along channel axis and gravel deposits along channel margin. (D) Stage II rhythmite deposition from seasonal meltwater discharge into flooded, subglacial tunnel channels. (E) Ice-contact basin model for stage III sedimentation of the ORM ridge. (F) Subaqueous fan sedimentation during stage III of flood discharge from subglacial conduits.
Schémas de la mise en place de la moraine de Oak Ridges. (A) Modelage du till de Newmarket en drumlins par des inondations régionales. (B) Érosion en chenaux par des inondations épisodiques. (C) Phase I: remplissage des chenaux avec du sable diffus dans l’axe des chenaux et par des dépôts graveleux le long des marges des chenaux. (D) Phase II: déposition des varves par les eaux de fonte saisonnières et par les chenaux en tunnel sous-glaciaires. (E) Zone de contact glaciaire pendant la formation de la crête de la moraine de Oak Ridges. (F) Sédimentation du cône subaquatique par des conduits sous-glaciaires durant la Phase III.
The ice-bounded basin (corridor) within which the ORM ridge was deposited may have been subglacial or subaerial (Fig. 19E). Presently, there is no sedimentological or landform evidence that unequivocally supports either interpretation in the Humber River watershed. Ponded water levels in this basin were controlled by the location at which ice impinged on the Niagara Escarpment and the ice thickness. Maximum water levels of ca. 420 m asl are indicated by the highest meltwater channel at Caledon (Fig. 4A; Chapman, 1985). Fluctuations of basin water depth would have been related to changes in the rate of meltwater discharge into the basin and rates of basin drainage. Basin drainage would have been closely related to the thickness of ice, ice sheet profile, and the pressure seal along the Niagara Escarpment. A thin, low-profile ice sheet would have been more susceptible to buoyancy induced lift-off and subglacial drainage, or development of ice-marginal channels along or across the Niagara Escarpment and connection to drainage systems that flowed to the south-southwest (Chapman, 1985).
A number of key facies within the ORM ridge sediment provide evidence that the glaciohydraulic system was supplied by episodic outburst flood discharges. For example, deposits of massive gravel, diffusely graded strata, low-angle cross-stratified sand and steep-walled scours are probably diagnostic of jökulhlaup (outburst) flood events (Maizels, 1997). These outburst flood discharges may have drained supraglacial or subglacial reservoirs or alternatively may have been triggered by anomalous precipitation events (Cowan et al., 1988; Gilbert, 1997).
Stage III ORM formation is characterized by esker-subaqueous fan sedimentation marginal to and within an ice-bounded glaciolacustrine setting. With the exception of the Brampton Esker, there are few observations of esker deposits in the western ORM (Saunderson, 1975). The following discussion focuses on the subaqueous fan deposits deposited predominantly from a plane-wall jet with jump. Subaqueous fan deposits record two contrasting but streamwise continuous depositional settings: (1) high-energy, coarse-grained proximal jet-efflux, and (2) low-energy, fine-grained distal jet-efflux.
Proximal jet efflux
Two types of jet-efflux geometries are possible where conduits debouched into a glaciolacustrine environment: a subcritical plane jet, or a supercritical plane-wall jet with an associated hydraulic jump (Russell and Arnott 2003). Depending on conduit diameter, flow velocity, flow density and interfacial friction, the jet may extend for up to 10’s km into the basin. In general, a plane-wall jet and a plane-wall jet with jump have a broad semicircular form (Russell and Arnott, 2003). Deposits from a plane-wall jet will grade rapidly downflow from massive, clast-supported and matrix-supported gravel to plane bed gravel. The abrupt loss of flow competence and capacity contributes to rapid bed aggradation and results in a rapid change in the streamwise direction from massive to plane-bed and then cross-bedded coarse sand over distances as short as 10 m (Russell and Arnott, 2003). Under comparatively low-flow energies, antidune cross-stratification was deposited beneath inphase waves. In contrast, higher-energy flow conditions formed steep-walled scours that were infilled by diffusely graded sand beneath or downflow of oscillatory hydraulic jumps. Steep-walled scour and fill record the most rapid rates of erosion and sedimentation; for example, overhangs formed in unconsolidated sand along scour margins. Downflow of the hydraulic jump, medium-scale, planar-tabular cross-strata predominate and locally show moderate (ca. 15°) angles of climb.
Distal jet efflux
More distal jet efflux deposits are commonly characterized by small-scale cross-lamination (Rust and Romanelli, 1975; Gorrell and Shaw, 1991) and by graded fine-sand to silt. These strata are interpreted to be intermediate or distal subaqueous fan deposits. Where small-scale, cross-laminated facies form metre-scale cosets, deposition is interpreted to have been from semicontinuous outburst flood discharge. On the other hand, where thinner sets occur and are upward-fining graded fine sand to silt deposition from surge-type turbidity currents are interpreted. In the latter case, the stratal assemblage is similar to the Tbc and locally Td Bouma turbidite divisions (Pickering et al., 1989).
Stage III deposition marks a major change in the style of ORM sedimentation. Following the low sedimentation rates and meltwater discharge of stage II, there was a significant but gradual increase in energy, and a change in the style of meltwater delivery. Discharge into the basin was most likely dominated by axial east to west flow with secondary discharge from small conduits to the north and south. Within the study area, this lateral discharge is documented from the Gormley study site (Russell and Arnott 2003) and to the south at the Brampton esker (Saunderson, 1976). Evidence of the east-west axial discharge, on the other hand, is based on westerly paleoflows measured in coarse-grained deposits, 10‑30 km to the east of the study area (Paterson, 1995; Barnett, 1997). Within the study area, distal strata related to this east-west discharge consists of fine-sand and silt deposits. The dimensions of the ice-bounded basin most probably varied significantly as the ice responded to thermal, and/or mechanical erosion of the meltwater discharge and buoyancy generated by increased water levels. During periods of high discharge, the basin grew larger as ice was either eroded or locally lifted off from the bed. During periods of low discharge, on the other hand, the basin shrank as ice became grounded and sedimentation became confined along the ORM ridge.
Discussion
Origin of the ORM
Several depositional models have been proposed for the formation of the ORM. The most generally accepted model suggests that the ORM is an interlobate deposit formed between flow from the Lake Ontario lobe and flow from the Simcoe or main Laurentide ice lobe (Chapman and Putnam, 1984). Alternatively, other authors have suggested that the ORM is, at least partly, a subaerial braid plain deposit (Gwyn and Dilabio, 1973; Duckworth, 1979). More recently, however, detailed landform and sediment studies complemented by seismic profiles lead Barnett et al. (1998) to suggest that the ORM is a landform of subglacial and ice-marginal origin formed mostly of glaciofluvial and glaciolacustrine sediment built above a regional unconformity. A subglacial origin for the ORM and the presence of a subglacial lake in Lake Ontario was suggested by Shoemaker (1999). The sedimentological results of this study support the multi-staged origin of the ORM and also provide evidence that the ORM was deposited, at least in part, in a subglacial setting.
Refining the stages of ORM formation
The following discussion refines the four stage model of ORM formation proposed by Barnett et al. (1998), and elaborates on stratigraphic and depositional details within the study area. The suggestion by Shoemaker (1999) that the ORM origin was controlled by a subglacial lake in the Lake Ontario basin is also considered. The channel fill sediment facies, stage I in this study, corresponds with stage I of the Barnett et al. (1998) model. Deposition was from subglacial outburst floods along north-south trending tunnel channels. Strata were deposited at a zone of rapid flow expansion with commensurate rapid and voluminous sedimentation within a subglacial glaciolacustrine setting. This was followed by transition to stage II, which, in this study, corresponds to a period of low-energy seasonal meltwater discharge and varve formation. Subaqueous fan sedimentation may not be ruled out in stage II of the eastern ORM; however, it is not characteristic of the low meltwater flux associated with this interval. This differs from the Barnett et al. (1998) definition of stage II as a phase of subaqueous fan sedimentation. Consequently, rapid and voluminous sedimentation associated with subaqueous fan processes is more appropriately placed at the base of stage III which Barnett et al. (1998) termed subaqueous fan to delta. Previous descriptions of stage III are consistent with the stage III strata in the current study except that deltaic deposits were not observed in the Humber River watershed. This is not unexpected as deposition of subaqueous fans or deltas are commonly controlled by the depth of water at the ice-front, and the position of the conduit within the glacier (i.e. subglacial, englacial or supraglacial). For example, outlet channels on the Niagara Escarpment are at 420 m asl, which is above most of the Humber River watershed. For the same meltwater discharge, variation in basin geometry, basin depth, and ice-sheet drainage can produce different stratal architectures (Fyfe, 1990). Subaqueous fan and deltaic deposits, although lithologically similar, can commonly be differentiated on the basis of vertical facies succession, and styles of stratal architecture. Furthermore, streamwise facies changes in subaqueous fans are generally much more rapid and generally fine, rather than coarsen, upward. Stage IV of the Barnett et al. (1998) model described ice-marginal sedimentation of the Halton Till which gradationally overlies the ORM strata. This stage of moraine sedimentation is not addressed in this study.
Controls on the geographic location of the ORM
In the depositional model presented by Barnett et al. (1998) little discussion was given to the mechanisms that may have controlled the location of ORM deposition. Traditionally, the ORM has been attributed to the development of an interlobate re-entrant formed due to ablating and thinning ice along the ice-margins of the Lake Ontario and Lake Simcoe ice lobes. This re-entrant was suggested to have formed in response to climatic forcing of ice-marginal retreat during the Mackinaw Interstadial (Duckworth, 1979). Recent developments in the understanding of ice-streams (Hart, 1999), surging glaciers (Kamb et al., 1985), and subglacial lakes (Shoemaker, 1999) indicates that the origin of the ORM is more likely controlled by ice sheet conditions. Using a regional subglacial meltwater model, Shoemaker (1999) suggested that a subglacial lake developed within Lake Ontario and that the ORM may have formed at the grounding line of this lake. Evidence presented in this study supports this suggestion, but only for the lowest tunnel channel fill succession (Stage I). Subsequent stages appear to have responded to the glaciohydraulic regime of the ice sheet. The inferred control on formation of the ORM by a subglacial lake is important and sufficiently controversial that a brief review of the evidence for a subglacial lake is discussed.
Subglacial lakes
Subglacial lakes are well documented beneath the ice sheets of Antarctic and Greenland (Dowdeswell and Siegert, 1999), and Icelandic icecaps (Björnsson, 2002). The Antarctic Lake Vostok is the largest documented subglacial lake with a similar size as modern day Lake Ontario (Dowdeswell and Siegert, 1999). These lakes are maintained by geothermal heat flux and thick ice producing a warm-based glacial regime where there is little supraglacial meltwater delivery to the base of the ice sheet. During the Laurentide deglaciation there was likely abundant supraglacial meltwater production (Patterson, 1994). Consequently, the development of subglacial lakes during the Late Wisconsinan Laurentide deglaciation is plausible in light of its warm-based character, large volumes of supraglacial meltwater, and interconnected englacial meltwater system (Shoemaker, 1991; Shaw, 1996). In fact, sedimentological studies are beginning to record evidence for the existence of lakes beneath the Laurentide Ice Sheet (Munro-Stasiuk, 1999) and also beneath other former ice sheets (McCabe and O’Cofaigh, 1994).
Formation of a subglacial lake in the Lake Ontario basin most probably post-dated the formation of regional drumlin fields located north and south of modern Lake Ontario (Shaw and Sharpe, 1987; Boyce and Eyles, 1991), and that have also been mapped on the bottom of Lake Ontario (Lewis et al., 1997b). Irrespective of whether the drumlins were formed by deforming till (Boyce and Eyles, 1991), or as a result of regional meltwater floods (Shaw and Sharpe, 1987; Shaw, 1996; Shoemaker, 1999), a late glacial ice-stream and consequent thinning of the ice sheet would have occurred. Rapid flow within ice sheets has been shown to coincide with increased storage of basal meltwater, subsequent meltwater discharge, and associated thinning of the ice sheet from modern (Kamb et al., 1985) and inferred for Pleistocene examples (Patterson, 1997). Evidence of extensive meltwater flow following the regional drumlin forming episode is supported by the presence of tunnel channels that traverse the drumlin fields (Mullins and Hinchey, 1989; Barnett, 1990; Brennand and Shaw, 1994; Mullins and Eyles, 1996; Pugin et al., 1999; Russell et al., 2003b; Sharpe et al., 2004). Tunnel channels are interpreted to form subglacially by either steady state meltwater discharge or due to episodic, catastrophic meltwater discharge (Cofaigh, 1996). North of Lake Ontario, tunnel channel formation has been interpreted to be by episodic outburst floods (Barnett, 1990; Brennand and Shaw, 1994). The channel width, depth and stratal character of the fill (Shaw and Gorrell, 1991; Pugin et al., 1999) indicate that large quantities of meltwater discharged southward along tunnel channels into and through the Lake Ontario basin. Concentration of meltwater flow within tunnel channels would have coincided with the end of fast glacial flow conditions and with the development of a thin ice shelf across the Lake Ontario basin (Shoemaker, 1999). This change in the ice-sheet thickness would have produced conditions favourable for the accumulation of meltwater in the Lake Ontario basin and development of a subglacial lake (Shoemaker, 1991, 1999). The absence of well defined channels south of the ORM, and further south within Lake Ontario is additional support for the occurrence of a subglacial lake in the lake Ontario basin (cf. Sharpe et al., 1996; Kenny, 1998). Consequently, the abrupt change in landform styles across the ORM suggests a major change in the subglacial erosional regime and glaciohydraulic character of the ice sheet in the area of the ORM. This change was unrelated to a glacial margin because ice was well to the south of the ORM area prior to formation of postglacial Lake Iroquois (Karrow and Occhietti, 1989). Glacial Lake Iroquois is interpreted to have formed ca. 500 years after deposition of the ORM (Barnett et al., 1991).
The confining ice lid
A subglacial lake the size of Lake Ontario would have significantly influenced the surface topography of the overlying ice sheet in a fashion similar to that documented from the Antarctica Ice Sheet (Siegert and Ridley, 1998). The largest documented subglacial lake beneath the Antarctic Ice Sheet is Lake Vostok and is overlain by ice with a surface topography of 0.004° slope (0.25 m km‑1; Siegert 2000). Consequently, to reconstruct regional ice sheet dynamics during Laurentide deglaciation requires three important conditions for formation of the ORM: (1) a thin extended low-gradient ice sheet, (2) a subglacial lake within the Lake Ontario basin, (3) a grounded ice shelf across the Lake Ontario basin. The thinned ice sheet would have permitted more water to accumulate in Lake Ontario as the lithostatic pressure of the confining ice was reduced. Furthermore, a low ice-sheet gradient over a subglacial lake results in a lower hydraulic gradient in the area and reduced subglacial meltwater pressures outward from the centre of the Lake Ontario basin to the grounded margins (e.g. Brampton esker). Once established, a subglacial lake would have been difficult to drain without build-up of considerably thicker ice in the lake area (Shoemaker, 1999). A thinned ice-shelf over the lake would also have been more susceptible to changes in water depth within the basin. The influence of changing water depth in subglacial lakes on the overlying ice-lid is poorly understood. It is plausible that the ice may have fractured extensively around the lake margin forming crevasses; in a fashion similar to that in ice-covered reservoirs with fluctuating water levels. The number and width of the crevasses might be related to the thickness of the ice-cover, the underlying basin geometry and topography, and the rate and amplitude of water level change. Although such crevassing of lake ice may involve the whole thickness of the ice-cover, it is unlikely that this would be the case with an ice-shelf. For example, to support the ORM ridge sediment at an elevation of 400 m asl requires a minimum ice-shelf thickness of >300 m. Dry crevasses in temperate glaciers generally only extend to a depth of 25‑30 m. Below this depth the horizontal stress in the ice sheet generates rapid ice flow which closes crevasses (Paterson, 1981). An exception to this occurs where the crevasses fill with water and in this case crevasses may extend to the bottom of the glacier (Paterson, 1981). With a low gradient ice-shelf and supraglacial ponding of water, it is possible that crevasses formed in the vicinity of the grounding line would have filled with water and provided an additional control on the location of the ORM. Crevassing may have localized thermal and meltwater erosion and consequently development of the ice-walled glaciolacustrine environment into which stage III of the ORM was deposited. Shoemaker (1999) postulated that the ORM may have formed at a grounding line where discharge into subglacial lakes underwent flow expansion and consequently lost transport competence. Is there evidence to support this subglacial lake hypothesis in the case of the ORM?
Evidence for a subglacial lake in the Lake Ontario basin
Observations of sediment thickness and fill from tunnel channels beneath the western ORM support the hypothesis that this part of the ORM was deposited subglacially. The lowermost channel fill strata of diffusely graded to massive sand that grade downflow into climbing small-scale cross-laminated sand are interpreted to have been deposited beyond the grounding line within a subglacial cavity – possibly a subglacial proto Lake Ontario (Russell et al., 2003a). Based on the elevation of these strata the water level in this subglacial lake would have approached ca. 180 m asl compared to the current Lake Ontario level of ca. 74 m. This subglacial lake would have been several hundred metres deep and extended, 10’s km further inland than modern day Lake Ontario.
Additional evidence of rapid sedimentation at a zone of flow expansion is provided by the chaotic seismic facies in the Holland Marsh channel at Nobleton, interpreted to be correlative with massive and diffusely graded strata from the subparallel King City tunnel channel (Pugin et al., 1999; Russell et al., 2003a). These tunnel channel fills represent the initial stages of ORM formation, possibly related to the last significant flow along the tunnel channels before reorganization of the ice-sheet hydrology and development of axial east-west flow along the ORM, accompanied by secondary north and south lateral inflow.
Applications
The ORM forms an important regional aquifer system in the Humber watershed and the buried Laurentian valley. The aquifer size and properties are controlled by the stratigraphic architecture and sediment facies of the depositonal environments of the ORM. The combination of moraine extent, topographic position, hummocky terrain, predominantly sandy sediment, and channelized basal contact means that ORM is a major area of recharge. The ORM captures ca. 300‑400 mm of water a year when this is available (Howard et al., 1995). Some of this recharge can flow to deeper regional aquifers in lower sediment along tunnel channels eroded through Newmarket Till (Fig. 15). In places therefore, this allows complete hydraulic connection between upper sediment of the ORM ridge and lower sediment that fills the older, underlying Laurentian valley.
The distribution of coarse sediment reflects the depositional origin of the ORM. Coarse permeable sediment occurs in three stratigraphic positions within the ORM, (1) tunnel channels, (2) overlying the unconformity between tunnel channels, and (3) in the apex of fans and eskers, dispersed stratigraphically high (Stage III) in ORM sediment. The understanding of coarse sediment distribution (a predicative model) is poor due to an over reliance on waterwell records. This lack of a predictive model is highlighted by the improved delineation of the Caledon East buried valley by continuous core and seismic data. With new data collection the depth of the valley was increased by ca. 100 m over previous estimates from waterwell data. Furthermore, previously unidentified sandy gravel fill within the bedrock valley is up to 40 m thick, extends laterally for ca. 1 500 m, and may have longitudinal continuity for 6‑8 km. Municipal groundwater studies in the area, relying on waterwell data, had previously dismissed the area as having no potential for additional groundwater resources (cf. Russell et al., 2005). Similar unidentified buried valleys likely occur elsewhere within the Humber River watershed and the depositional models proposed here should help better delineate these features.
Improved knowledge of sediment facies distribution will also improve understanding of aquifer heterogeneity. For the three settings noted above, differences in depositional setting and associated paleoflow directions produce differences in the orientation and dimensions of aquifer heterogeneity. In deep tunnel channels, aquifer orientation will parallel the north-south trend of the channel network, with coarser sediment located toward the proximal, northern end. Current understanding of this aquifer setting is poor due to the limited deep data collection. In contrast to the poor understanding of gravel distribution in deep channels, the distribution in shallow channels on Newmarket Till interfluves is much better. Like in the deep tunnel channels, gravel in shallow channels most likely trend north to south. Gravel in this setting may also have a subsidiary east-west trend. With height above the unconformity the east-west gravel trend is likely to become dominant. Prospecting models for aquifers within ORM sediment can be improved by applying the 3‑D stratigraphic model (Logan et al., 2005). This model can be used to help constrain the extent and thickness of stratigraphic units, and the location of specific targets within respective ORM. Such information can then be integrated with improved conceptual knowledge of depositional trends within the ORM to aid in identifying drilling targets.
Watershed resources in the Greater Toronto Area are under increasing pressure from urban development and water supply demands. To respond to these land use issues will need continued improvements in the understanding of the moraine sediment/hydrostratigraphic framework discussed in this paper to address surface water–groundwater concerns. Improvements to framework models, for example, increased understanding of vertical recharge fluxes from the ORM to Lower sediment fill of the Laurentian valley.
Conclusion
The western segment of the ORM, in the Humber River watershed, is predominantly a glaciofluvial-glaciolacustrine deposit that accumulated in an ice-supported environment 200‑400 m above Lake Ontario. The ORM overlies an irregular erosional unconformity with relief of 80‑100 m, and has a highly variable thickness of >150 m. Regional models of landform development for both drumlins and tunnel channels suggest that the Late Wisconsinan Laurentide Ice Sheet underwent fast flow and as a consequence was extended and thinned. Tunnel channels formed following drumlin formation and record large volumes of meltwater discharged south along these corridors. The lack of tunnel channels south of the ORM in the Humber River watershed suggests that the position of the ORM marks a significant change in the hydraulic regime of the ice sheet. From north to south changes in landforms of the ORM area may support the suggestion by Shoemaker (1999) that a subglacial lake formed in the Lake Ontario basin. The extent and depth of this lake is poorly constrained, but it was probably larger than Lake Ontario and as much as several hundred metres deep. This subglacial lake, in conjunction with tunnel channels, may have provided the primary control on the formation of the ORM.
Formation of the ORM is interpreted to have occurred in three stages, each reflecting changes in meltwater discharge, location and orientation of subglacial or proglacial basins, conduit efflux location, and ice cover. Deposition during stage I was from waning outburst discharges through subglacial tunnel channels. At this time, enhanced erosion of the tunnel channel(s) upflow from the grounding line was probably related to supercritical flows that discharged into subglacially ponded water in the Lake Ontario basin. Meltwater discharges were focused at the mouth of these tunnel channels and hydraulic jumps developed as the flow underwent rapid flow expansion and mixing. This caused it to transform into a subcritical flow. Meltwater discharge was from the north and the predominant channel fill sediment facies consisted of diffusely graded/ massive sand deposited from hyperconcentrated flows (Russell et al., 2003a). Stage II marked a change to low-energy, annual meltwater flux and varve formation in a subglacial environment. Deposits consist mostly of normal-graded fine sand to silt deposited from weak diurnal discharge. These strata are then overlain by a clay unit interpreted to record deposition from suspension related to annual meltwater cycles. Stage III sedimentation may have been strongly controlled by crevassing along the grounding line of the thinned ice cover over the lake as water levels within the subglacial lake dropped. Stage III represented a return to higher sediment flux and the development of lateral sediment point sources into an axial meltwater system that flowed westward. Coarse-grained sedimentation was predominantly within subglacial conduits (eskers) and proximal parts of subaqueous fans. Distally, these deposits consist entirely of medium and fine sand commonly with climbing cross-stratification.
The ORM formed in response to a complex sequence of events related to the Late Wisconsinan Laurentide deglaciation. Regional events, possibly involving broad regional catastrophic meltwater floods caused enhanced glacial flow conditions, possibly along with rapid glacial flow, that culminated in the thinning of the ice sheet and excavation of a tunnel channel network discharging meltwater into the Lake Ontario basin. The presence of a subglacial lake provides a primary control on the location of the ORM through development of an ice shelf, grounding line, a zone of grounded ice, and extensive crevasses along the grounding line. These regional scale, episodic hydraulic events caused rapid and voluminous sedimentation and deposition of the ORM in a relatively short period of time. Deposition related to annual, diurnal, steady-state meltwater discharge due to seasonal climatic fluctuations was secondary.
Parties annexes
Acknowledgements
Field assistance was provided by D. Cummings, S. Dumas, A. Grignon, L. Maurice, and C. Helmer. Access to core collected for the IWA site investigation was provided by M. Gomer and R. Blair. The Nobleton core collection was supervised by G. Gorrell. Database and GIS support was provided by C. Logan. Field discussions with T. Brennand, G. Gorrell, J. Shaw, and P. Barnett advanced the authors understanding of the regional geology of the ORM. Review of earlier versions of the manuscript by R. Knight, R. Gilbert, and R. Rainbird helped improve the paper. Constructive commentary by journal reviewers T. Fisher, R. Kelly, and A. Plouffe are much appreciated. Funding for this work was provided by the Geological Survey of Canada (GSC) National Mapping Program (NATMAP), the GSC hydrogeology program, and a Natural Sciences and Engineering Research Council research grant to R.W.C. Arnott.
Note
-
[*]
Geological Survey of Canada contribution number 2005129
References
- Ashley, G.M., 1975. Rhythmic sedimentation in glacial Lake Hitchcock, Massachusetts-Connecticut, p. 450‑455. In R.P. Goldthwait, ed., Glacial Deposits. Dowden, Hutchinson & Ross, Stroudsburg, 464 p.
- Banerjee, I., 1973. Part A: Sedimentology of Pleistocene glacial varves in Ontario, Canada; Part B: Nature of grain-size distribution of some Pleistocene glacial varves in Ontario, Canada. Geological Survey of Canada, Ottawa, Bulletin 226, 60 p.
- Barnett, P.J., 1990. Tunnel valleys: evidence of catastrophic release of subglacial meltwater, central-southern Ontario, Canada. Abstracts with Programs, Northeastern Section, Geological Society of America, Syracuse, 22 : 3.
- Barnett, P.J., 1992. Quaternary geology of Ontario, p. 1011‑1088. In P.C. Thurston, H.R. Williams, R.H. Sutcliffe and G.M. Stott, eds., Geology of Ontario. Ontario Geological Survey, Toronto, Special Volume 4, Part 2, 1525 p.
- Barnett, P.J., 1997. TRT sand and gravel pit, p. 34‑36. In D.R. Sharpe and P.J. Barnett, eds. Where is the Water? Regional Geological/Hydrogeological Framework, Oak Ridges Moraine Area, Southern Ontario. Geological Association of Canada, Field Trip A1 Guidebook, 17‑18 May, Ottawa.
- Barnett, P.J., Cowan, W.R. and Henry, A.P., 1991. Quaternary Geology of Ontario, southern sheet. Ontario Geological Survey, map 2556, scale 1:1 000 000.
- Barnett, P.J. and Gwyn, Q.H.J., 1997. Surficial Geology of the Newmarket Area, NTS 31 D/3, southern Ontario. Geological Survey of Canada, Ottawa, Open File 3329, scale 1:50 000.
- Barnett, P.J., Sharpe, D.R., Russell, H.A.J., Brennand, T.A., Gorrell, G., Kenny, F.M. and Pugin, A., 1998. On the origins of the Oak Ridges Moraine. Canadian Journal of Earth Sciences, 35 : 1152‑1167.
- Björnsson, H., 2002. Subglacial lakes and jökulhlaups in Iceland. Global Planetary Change, 35 : 255‑271.
- Boyce, J.I. and Eyles, N., 1991. Drumlins carved by deforming till streams below the Laurentide Ice Sheet. Geology, 19 : 787‑790.
- Boyce, J.I. and Eyles, N., 2000. Architectural element analysis applied to glacial deposits: internal geometry of a late Pleistocene till sheet, Ontario, Canada. Geological Society of America Bulletin, 112 : 98‑118.
- Brennand, T.A. and Shaw, J., 1994. Tunnel channels and associated landforms, south-central Ontario: Their implications for ice-sheet hydrology. Canadian Journal of Earth Sciences, 31 : 505‑522.
- Chapman, L.J., 1985. On the origin of the Oak Ridges Moraine, southern Ontario. Canadian Journal of Earth Sciences, 22 : 300‑303.
- Chapman, L.J. and Putnam, D.F., 1943. The moraines of southern Ontario. Transactions of the Royal Society of Canada, 37 : 33‑41.
- Chapman, L.J. and Putnam, D.F., 1984. The Physiography of Southern Ontario. Ontario Geological Survey, Toronto, Special Volume 2, 270 p.
- Cofaigh, C.O., 1996. Tunnel valley genesis. Progress in Physical Geography, 20 : 1‑19.
- Cowan, E.A., Powell, R.D. and Smith, N.D., 1988. Rainstorm-induced event sedimentation at the tidewater front of a temperate glacier. Geology, 16 : 409‑412.
- Dowdeswell, J.A. and Siegert, M.J., 1999. The dimensions and topographic setting of Antarctic subglacial lakes and implications for large-scale water storage beneath continental ice sheets. Geological Society of America Bulletin, 111 : 254‑263.
- Duckworth, P.B., 1979. The late depositional history of the western end of the Oak Ridges Moraine, Ontario. Canadian Journal Earth Sciences, 16 : 1094‑1107.
- Eyles, N., Eyles, C.H. and Miall, A.D., 1983. Lithofacies types and vertical profile models; an alternative approach to the description and environmental interpretation of glacial diamict and diamictite sequences. Sedimentology, 30 : 393‑410.
- Eyles, N. and Williams, N.E., 1992. The sedimentary and biological record of the last interglacial-glacial transition at Toronto, Canada, p. 119‑137. In P.U. Clark and P.D. Lea, eds., The Last Interglacial-Glacial Transition in North America. Geological Society of America, Boulder, Special Paper 270, 317 p.
- Fisher, T.G., Jol, H.M. and Boudreau, A.M., 2005. Saginaw Lobe tunnel channels and their significance in south-central Michigan, USA. Quaternary Science Reviews, 24 : 2375‑2391.
- Fyfe, G.J., 1990. The effect of water depth on ice-proximal glaciolacustrine sedimentation: Salpausslka I, southern Finland. Boreas, 19 : 147‑164.
- Gilbert, R., 1997. Glaciolacustrine sedimentation in part of the Oak Ridges Moraine. Géographie physique et Quaternaire, 7 : 55‑66.
- Gorrell, G. and Shaw, J., 1991. Deposition in an esker, bead and fan complex, Lanark, Ontario, Canada. Sedimentary Geology, 72 : 285‑314.
- Gustavson, T.C., 1975. Sedimentation and physical limnology in proglacial Malaspina Lake, southeastern Alaska, p. 249‑263. In A.V. Jopling and B.C. McDonald, eds., Glaciofluvial and Glaciolacustrine Sedimentation. Society of Economic Paleontologists and Mineralogists Special Publication, Tulsa, 320 p.
- Gwyn, Q.H.J. and Dilabio, R.N.W., 1973. Quaternary geology of the Newmarket area, Southern Ontario. Ontario Division of Mines, Toronto, Preliminary Map 836, scale 1:50 000.
- Hart, J., 1999. Identifying fast ice flow from landform assemblages in the geological record: A discussion. Annals of Glaciology, 28 : 59‑66.
- Holysh, S., Davies, S.D. and Goodyear, D., 2004. Project Unit 04‑028. An investigation into buried valley aquifer systems in the Lake Simcoe Area. Ontario Geological Survey, Toronto, Open File Report, Report 6145, 6 p.
- Howard, K.W.F., Eyles, N., Smart, P.J., Boyce, J.I., Gerber, R.E., Salvatori, S.L. and Doughty, M., 1995. The Oak Ridges Moraine of southern Ontario: A ground-water resource at risk. Geoscience Canada, 22 : 101‑120.
- Kamb, B., Raymond, C.F., Harrison, W.D., Engelhardt, H., Echelmeyer, K.A., Humphrey, N., Brugman, M.M. and Pfeffer, T., 1985. Glacier surge mechanism: 1982‑1983 surge of Variegated Glacier, Alaska. Science, 227 : 469‑479.
- Karrow, P.F., 1967. Pleistocene Geology of the Scarborough Area. Ontario Ministry of Natural Resources, Toronto, Report 46, 108 p.
- Karrow, P.F., 1974. Till stratigraphy in parts of southwestern Ontario. Geological Society of America Bulletin, 85 : 761‑768.
- Karrow, P.F., Anderson, T.W., Delorme, L.D., Miller, B.B. and Chapman, L.J., 1995. Late-glacial paleoenvironment of Lake Algonquin sediments near Clarksburg, Ontario. Journal of Paloelimnology, 14 : 297‑309.
- Karrow, P.F. and Occhietti, S., 1989. Quaternary geology of the St. Lawrence Lowlands of Canada, p. 321‑389. In R.J. Fulton, ed., Quaternary Geology of Canada and Greenland. Geological Survey of Canada, Ottawa, 839 p.
- Karrow, P.F. and Paloschi, G.V.R., 1996. The Waterloo kame moraine revisited: New light on the origin of some Great Lake region interlobate moraines. Zeitschrift für Geomorphologie, 40 : 305‑315.
- Kenny, F., 1998. A chromostereo enhanced digital elevation model of the Oak Ridges Moraine area, southern Ontario. Geological Survey of Canada and Ontario Ministry of Natural Resources, Ottawa, Open File 3423, scale 1:200 000.
- Kenny, F., Paquette, J., Russell, H.A.J., Moore, A.M. and Hinton, M.J., 1999. A digital elevation model of the Greater Toronto Area, southern Ontario and Lake Ontario bathymetry. Geological Survey of Canada, Ontario Ministry of Natural Resources, and Canadian Hydrographic Service; Geological Survey of Canada, Ottawa, Open File D3678, CD‑ROM.
- Kor, P.S.G. and Cowell, D.W., 1998. Evidence for catastrophic subglacial meltwater sheetflood events on the Bruce Peninsula, Ontario. Canadian Journal of Earth Sciences, 35 : 1180‑1202.
- Lewis, C.F.M., Cameron, G.D.M. and Todd, B.J., 1997a. Seismostratigraphy of western Lake Ontario: Quaternary geology and implications for groundwater discharge. In GAC/MAC Ottawa’97 Annual Meeting May, 19‑21, Ottawa, Ontario. Geological Association of Canada, Ottawa, p. A‑89.
- Lewis, C.F.M., Cameron, G.D.M., Mayer, L.A. and Todd, B.J., 1997b. Drumlins in Lake Ontario, p. 48‑49. In A.D. Thomas, ed., Glaciated Continental Margins: An Atlas of Acoustic Images. Chapman and Hall, London, 315 p.
- Logan, C., Russell, H.A.J. and Sharpe, D.R., 2005. Regional 3‑D structural model of the Oak Ridges Moraine and Greater Toronto area, southern Ontario: Version 2.0. Geological Survey of Canada, Ottawa, Open File, Report 4329.
- Logan, C., Russell, H.A.J., Sharpe, D.R. and Kenny, F.M., in press. The role of expert knowledge, GIS and geospatial data management in a basin analysis, Oak Ridges Moraine, southern Ontario. In J. Harris, ed., GIS Applications in the Earth Sciences. Geological Association of Canada, Ottawa, Special Publication 44.
- Maizels, J., 1997. Jökulhlaup deposits in proglacial areas. Quaternary Science Reviews, 16 : 793‑819.
- McCabe, A.M. and O’Cofaigh, C., 1994. Sedimentation in a subglacial lake, Enniskerry, eastern Ireland. Sedimentary Geology, 91 : 57‑95.
- Meriano, M. and Eyles, N., 2003. Groundwater flow through Pleistocene glacial deposits in the rapidly urbanizing Rouge River-Highland Creek watershed, City of Scarborough, southern Ontario, Canada. Hydrogeology Journal, 11 : 288‑303.
- Miall, A.D., 1984. Principles of sedimentary basin analysis. Springer-Verlag, New York, 490 p.
- Mullins, H.T. and Hinchey, E.J., 1989. Erosion and infill of New York Finger Lakes: Implications for Laurentide Ice Sheet deglaciation. Geology, 17 : 622‑625.
- Mullins, H.T. and Eyles, N., 1996. Subsurface Geological Investigations of New York Finger Lakes: Implications for Late Quaternary Deglaciation and Environmental Change. Geological Society of America, Boulder, Special Paper 311, 89 p.
- Munro-Stasiuk, M.J., 1999. Evidence for water storage and drainage at the base of the Laurentide Ice Sheet, south-central Alberta, Canada. Annals of Glaciology, 28 : 175‑180.
- Munro-Stasiuk, M.J., Fisher, T.G. and Nitzsche, C.R., 2005. The origin of the western Lake Erie grooves, Ohio: Implications for reconstructing the subglacial hydrology of the Great Lakes sector of the Laurentide Ice Sheet. Quaternary Science Reviews, 24 : 2305‑2420.
- Paterson, J.T., 1995. Sedimentology of the Bloomington fan complex, Oak Ridges Moraine, southern Ontario, M.Sc. thesis, Brock University, 199 p.
- Paterson, J.T. and Cheel, R.J., 1997. The depositional history of the Bloomington Complex, an ice-contact deposit in the Oak Ridges Moraine, southern Ontario, Canada. Quaternary Science Reviews, 16 : 705‑719.
- Paterson, W.S.B., 1981. The Physics of Glaciers, 2nd Edition. Pergamon Press, New York, 480 p.
- Patterson, C.J., 1994. Tunnel-valley fans of the St. Croix Moraine, east-central Minnesota, USA, p. 69‑87. In W.P. Warren and D.G. Croot, eds., Formation and Deformation of Glacial Deposits. Balkema, Rotterdam, 223 p.
- Patterson, C.J., 1997. Southern Laurentide ice lobes were created by ice streams: Des Moines Lobe in Minnesota, USA. Sedimentary Geology, 111 : 249‑261.
- Pickering, K.T., Hiscott, R.N. and Hein, F.J., 1989. Deep Marine Environments; Clastic Sedimentation and Tectonics. Unwin Hyman, London, 416 p.
- Piotrowski, J.A., 1997. Subglacial hydrogeology in north-western Germany during the last glaciation: Groundwater flow, tunnel valleys and hydrogeological cycles. Quaternary Science Reviews, 16 : 169‑185.
- Potter, P.E. and Pettijohn, F.J., 1963. Paleocurrents and Basin Analysis. Academic Press, New York, 269 p.
- Pugin, A., Pullan, S.E. and Sharpe, D.R., 1996. Observations of tunnel channels in glacial sediments with shallow land-based seismic reflection. Annals of Glaciology, 22 : 176‑180.
- Pugin, A., Pullan, S.E. and Sharpe, D.R., 1999. Seismic facies and regional architecture of the Oak Ridges Moraine area, southern Ontario. Canadian Journal of Earth Sciences, 36 : 409‑432.
- Pullan, S.E., Hunter, J.A., Russell, H.A.J. and Sharpe, D.R., 2004. Delineating buried-valley aquifers using shallow seismic reflection profiling and downhole geophysical logs-an example from southern Ontario, Canada, p. 39‑43. In Progress in Environmental and Engineering Geophysics: Proceedings of the International Conference on Environmental and Engineering Geophysics, Wuhan, China.
- Russell, H.A.J., 2001. The record of episodic high-energy sedimentation in the western Oak Ridges Moraine, southern Ontario. Ph.D. thesis, University of Ottawa, 297 p.
- Russell, H.A.J. and Arnott, W.R.C., 1997. Halton Complex, Humber watershed, p. 18‑22. In D.R. Sharpe and P.J. Barnett, eds, Where is the Water? Regional Geological/Hydrogeological Framework, Oak Ridges Moraine Area, Southern Ontario. Geological Association of Canada, Field Trip A1 Guidebook, 17‑18 May, Ottawa, 49 p.
- Russell, H.A.J. and Arnott, W.R.C., 2003. Hydraulic jump and hyperconcentrated flow deposits of a glacigenic subaqueous fan: Oak Ridges Moraine, Southern Ontario. Journal of Sedimentary Research, 73 : 887‑905.
- Russell, H.A.J., Arnott, R.W.C. and Sharpe, D.R., 2003a. Evidence for rapid sedimentation in a tunnel channel, Oak Ridges Moraine, southern Ontario, Canada. Sedimentary Geology, 160 : 33‑55.
- Russell, H.A.J., Sharpe, D.R. and Bajc, A.F. 2006. Sediment architecture and composition of the Waterloo Moraine, southern Ontario: Emerging insights. p. 71‑74. In H.A.J. Russell, R.C. Berg and L.H. Thorleifson, eds., Three-Dimensional Geological Mapping for Groundwater Applications: Workshop Extended Abstracts. Geologial Survey of Canada, Ottawa, Open File 5048.
- Russell, H.A.J. and Dumas, S., 1997. Surficial geology of the Alliston area, NTS 31D/4, southern Ontario. Geological Survey of Canada, Ottawa, Open File 3334, scale 1:50 000.
- Russell, H.A.J., Logan, C., Brennand, T.A., Hinton, M. and Sharpe, D.R., 1996. A regional geoscience database: An example from the Oak Ridges Moraine NATMAP/Hydrogeology Project. Geological Survey of Canada, Ottawa, Current Research, 1996‑E, p. 191‑200.
- Russell, H.A.J., Pullan, S.E., Hunter, J.A., Sharpe, D.R. and Holysh, S., 2004. Buried valley aquifers: Delineation and characterization from seismic and core data at Caledon East, Ontario. Illinois State Geological Survey, Open File Series 2004‑8, p. 73‑76.
- Russell, H.A.J., Sharpe, D.R., Brennand, T.A., Barnett, P.J. and Logan, C., 2003b. Tunnel channels of the Greater Toronto and Oak Ridges Moraine areas, Southern Ontario. Geological Survey of Canada, Ottawa, Open File 4485, scale 1:200 000.
- Russell, H.A.J., Sharpe, D.R., Logan, C. and Brennand, T.A., 2001. Not without sedimentology: Guiding groundwater studies in the Oak Ridges Moraine, Southern Ontario, Illinois State Geological Survey, Open File Series 2000‑1, Bloomington-Normal, p. 38‑41.
- Russell, H.A.J. and White, O.L., 1997. Surficial geology of the Bolton area, NTS 30M/13, southern Ontario. Geological Survey of Canada, Ottawa, Open File 3299, scale 1:50 000.
- Rust, B.R. and Romanelli, R., 1975. Late Quaternary subaqueous outwash deposits near Ottawa, Canada, p. 177‑192. In A.V. Jopling and B.C. McDonald, eds., Glaciofluvial and Glaciolacustrine Sedimentation. Society of Economic Paleontologists and Mineralogists Special Publication, Tulsa, 320 p.
- Saunderson, H.C., 1975. Sedimentology of the Brampton Esker and its associated deposits; an empirical test of theory, p. 155‑176. In A.V. Jopling and B.C. McDonald, eds., Glaciofluvial and Glaciolacustrine Sedimentation. Society of Economic Paleontologists and Mineralogists Special Publication, Tulsa, 320 p.
- Rust, B.R., 1976. Paleocurrent analysis of large-scale cross-stratification in the Brampton Esker, Ontario. Journal of Sedimentary Petrology, 46 : 761‑769.
- Sharpe, D.R. and Barnett, P.J., 1997. Surficial Geology of the Markham Area, NTS 30M/14, southern Ontario. Geological Survey of Canada, Ottawa, Open File 3300, Scale 1:50 000.
- Sharpe, D.R., Barnett, P.J., Brennand, T.A., Finley, D., Gorrell, G., Russell, H.A.J. and Stacey, P., 1997. Surficial geology of the Greater Toronto and Oak Ridges Moraine area, southern Ontario. Geological Survey of Canada, Ottawa, Open File 3062, Scale 1:200 000.
- Sharpe, D.R., Dyke, L.D., Hinton, M.J., Pullan, S.E., Russell, H.A.J., Brennand, T.A., Barnett, P.J. and Pugin, A., 1996. Groundwater prospects in the Oak Ridges Moraine area, southern Ontario: Application of regional geological models. Geological Survey of Canada, Ottawa, Current Research, 1996‑E, p. 181‑190.
- Sharpe, D.R., Hinton, M.J., Russell, H.A.J. and Desbarats, A.J., 2002. The need for basin analysis in regional hydrogeological studies: Oak Ridges Moraine, Southern Ontario. Geoscience Canada, 29 : 3‑20.
- Sharpe, D.R., Pugin, A., Pullan, S.E. and Gorrell, G., 2003. Application of seismic stratigraphy and sedimentology to regional investigations: An example from Oak Ridges Moraine, southern Ontario, Canada. Canadian Geotechnical Journal, 40 : 711‑730.
- Sharpe, D.R., Pugin, A., Pullan, S.E. and Shaw, J., 2004. Regional unconformities and the sedimentary architecture of the Oak Ridges Moraine area, southern Ontario. Canadian Journal of Earth Sciences, 41 : 183‑198.
- Shaw, J., 1996. A meltwater model for Laurentide subglacial landscapes, p. 181‑236. In S.B. McCann and D.C. Ford, eds., Geomorphology Sans Frontières. John Wiley & Sons, Chichester, 245 p.
- Shaw, J. and Gilbert, R., 1990. Evidence for large-scale subglacial meltwater flood events in southern Ontario and northern New York State. Geology, 18 : 1169‑1172.
- Shaw, J. and Gorrell, G., 1991. Subglacially formed dunes with bimodal and graded gravel in the Trenton drumlin field, Ontario. Géographie physique Quaternaire, 45 : 21‑34.
- Shaw, J. and Sharpe, D.R., 1987. Drumlin formation by subglacial meltwater erosion. Canadian Journal of Earth Sciences, 24 : 2316‑2322.
- Shoemaker, E.M., 1991. On the formation of large subglacial lakes. Canadian Journal of Earth Sciences, 28 : 1975‑1981.
- Shoemaker, E.M., 1999. Subglacial water-sheet floods, drumlins and ice-sheet lobes. Journal of Glaciology, 45 : 201‑213.
- Sibul, U., Wang, K.T. and Vallery, D., 1977. Ground-water resources of the Duffins Creek-Rouge River drainage basins. Ontario Ministry of Environment, Water Resources Branch, Toronto, Report 8, 109 p.
- Siegert, M.J., 2000. Antarctic subglacial lakes. Earth-Science Reviews, 50 : 29‑50.
- Siegert, M.J. and Ridley, J.K., 1998. An analysis of the ice-sheet surface and subsurface topography above the Vostok Station subglacial lake, central East Antarctica. Journal of Geophysical Research B: Solid Earth, 103 : 10195‑10207.
- Sjogren, D.B., Fisher, T.G., Taylor, L.D., Jol, H.M. and Munro-Stasiuk, M.J., 2002. Incipient tunnel channels. Quaternary International, 90 : 41‑56.
- Sohn, Y.K., 1997. On traction-carpet sedimentation. Journal of Sedimentary Research, 67 : 502‑509.
- Taylor, F.B., 1913. The moraine systems of southwestern Ontario. Royal Canadian Institute Transactions, 10 : 57‑79.
- Technical Experts Committee, 2004. Watershed-Based Source Protection Planning, Science-based Decision-making for Protecting Ontario’s Drinking Water Resources: A Threats Assessment Framework. Technical Experts Committee Report to the Minister of the Environment, PIBs 4935e, 320 p.
- Warren, W.P. and Ashley, G.M., 1994. Origins of the ice-contact stratified ridges (eskers) of Ireland. Journal of Sedimentary Research, A64 : 433‑449.
- White, O.L., 1975. Quaternary Geology of the Bolton area, southern Ontario, Ontario Division of Mines, Toronto, Geological Report 117, 119 p.
 10.7202/004824ar
Liste des figures
Figure 1
(A) Location of study area in southern Canada. The province of Ontario is shown in grey and study area as a black box. (B) Digital elevation model of southern Ontario with till and stratified moraines highlighted.
(A) Carte de localisation de la zone d’étude au Canada. L’Ontario est en gris et la zone d’étude est indiquée par le carré noir. (B) Carte des élévations du sud de l’Ontario, où les tills et les moraines stratifiées sont accentuées.
Figure 2
Digital elevation model of the ORM with the four moraine segments labeled. The 270 m contour is used to outline the approximate landform expression of the ORM. Note tunnel channels defined by northeast-southwest trending valleys with low surface roughness north of the ORM and intervening drumlinized terrain. Humber River watershed study area is outlined in black.
Modèle numérique d’élévation de la moraine de Oak Ridges avec les segments de moraine. La courbe d’élévation de 270 m montre la forme de la moraine de Oak Ridges. Les chenaux en tunnel sont définis par des vallées orientées NE‑SO ayant une faible rugosité de surface et se manifestent sur un terrain de drumlins. Le bassin de la rivière Humber est surligné en noir.
Figure 3
Location of the Humber River watershed study area and the ORM northwest of Toronto. Drill core, river section and aggregate pit section sites are shown. Background DEM shows contrasting landscape of area with tunnel channels (tc) and drumlinized Newmarket Till uplands (D) north of the moraine and Halton Till plain (HT) south of the moraine. Selected towns are indicated by letters in circles, N = Nobleton, B = Bolton, W = Woodbridge. Drainage channels across the Niagara Escarpment are from Chapman (1985) with their respective elevations above sea level (asl).
Localisation du bassin de la rivière Humber et de la moraine de Oak Rigdes au nord-ouest de Toronto. Le modèle numérique d’élévation met en évidence un contraste de paysage entre les chenaux en tunnels (tc) et les drumlins des hautes-terres du till de Newmarket (D), au nord de la moraine, et la plaine du till de Halton (HT), au sud de la moraine. Les villes sélectionnées sont indiquées par les lettres encerclées : N = Nobleton, B = Bolton, W = Woodbridge. Les chenaux de l’escarpement du Niagara et leurs élévations au-dessus du niveau moyen des mers (asl) proviennent de Chapman (1985).
A
B
Stratigraphic column and conceptual architectural model of the ORM area. (A) Stratigraphic framework modified by Karrow (1974). (B) Conceptual stratigraphic model of the central ORM area. Original art work by J. Glew.
Coupe stratigraphique et modèle conceptuel de l’architecture de la moraine de Oak Ridges. (A) Coupe stratigraphique modifiée par Karrow (1974). (B) Modèle conceptuel de la partie centrale de la moraine de Oak Ridges. Oeuvre originale de J. Glew.
A
Surficial Mapping Field Stations
B
Hydrogeology Drillhole Sites
C
Geotechnical and Seismic Data
D
MOE Water Well Data
Datasets used to create the ORM structural and isopach maps. (A) Surficial geology field stations (n = 1 344) of Russell and White (1997). (B) Hydrogeology borehole data (n = 92) and location of two Interim Waste Authority (IWA) site. (C) Geotechnical borehole sites (n = 500) and location of seismic profiles (n = 5). (D) Selected Ministry of Environment (MOE) water well date based on deepest hole per 500 m grid cell (n = 2 028).
Données utilisées pour la création de la structure et des cartes de la moraine de Oak Ridges. (A) Géologie de surface (n = 1 344) de Russell et White (1997). (B) Données d’ydrogéologie (n = 92) et localisation de sites du Interim Waste Authority (IWA). (C) Données géotechniques (n = 500) et localisation de profils sismiques (n = 5). (D) Données de puits d’eau du Ministry of Environment (MOE) basées sur le puit le plus profond dans une cellule de 500 m (n = 2 028).
Figure 6
DEM of the Humber River watershed indicated by the solid line with the location of seven 25 km long north-south topographic cross-sections. Note irregular topography of the moraine between sections A and C. Steeper slopes on the southern moraine flank are indicated by deeper drainage incision. Smoother topography of moraine occurs where Halton Till is exposed at the surface. Elements of the regional physiography are labeled: (1) Niagara Escarpment, (2) tunnel channels, (3) ORM, and (4) Halton Till. Interpreted northern and southern position of ORM glaciolacustrine basin during formation of moraine ridge is shown by lines a‑a’ and b‑b’ respectively. Approximate minimum extent of grounded ice during stage III of deposition of the moraine and Brampton esker is shown by line c‑c’. White lines are major highways.
Modèle numérique d’élévation du bassin de la rivière Humber (ligne pleine) et localisation de sept sections transversales nord-sud de 25 km. Notez l’irrégularité de la moraine entre les sections A et C. Les pentes abruptes du flanc sud de la moraine sont liées à une incision profonde. La topographie plus douce de la moraine se produit aux endroits où le till de Halton est exposé. L’escarpement du Niagara, les chenaux en tunnel (tc), la moraine de Oak Ridges et le till de Halton sont localisés sur la figures. Les limites nord et sud du bassin glaciolacustre lors de la formation de la moraine de Oak Ridges sont montrées par les lignes a‑a’ et b‑b’. La ligne c‑c’ montre la superficie minimale de la moraine et de l’esker Brampton durant la phase III. Les lignes blanches représentent les autoroutes.
A
B
C
D
E
F
Six, 25 km long north-south topographic cross-sections spaced 4‑8 km apart. Note the ORM consists predominantly of sand and Halton Till at the surface. Surface sediment types are indicated only for the ORM area. Vertical exaggeration is ~23 times, axis scales are in metres. Note that no depth is inferred for shadded areas of surficial sediment.
Localisation de six coupes transversales nord-sud de 25 km de long et espacées de 4 à 8 km. La moraine de Oak Ridges est composée de sable et le till de Halton la recouvre. Les types de sédiments de surface sont seulement indiqués pour la région de la moraine de Oak Ridges. L’exagération verticale est d’environ 23 fois et les axes sont en mètres. L’estimation de la profondeur des sédiments de surface est inconnue dans les zones ombragées.
Figure 8
Maps and histograms of ORM thickness. (A) Isopach map with 50 m contour intervals. (B) Histogram of ORM thickness in primary data. (C) Histogram of ORM thickness in interpolated data with a 30 m grid cell.
Cartes et histogrammes de l’épaisseur de la moraine de Oak Ridges. (A) Carte avec des lignes de contour à chaque 50 m. (B) Histogramme de l’épaisseur de la moraine de Oak Ridges à partir des données primaires. (C) Histogramme de l’épaisseur de la moraine de Oak Ridges à partir d’une grille d’interpolation de 30 m.
A
B
C
D
Cross-sections of the ORM showing top and bottom surfaces. (A) East to west cross-section of the ORM crest. (B) East to west cross-section across the Halton Till plain. (C) North to south cross-section downflow of the Holland Marsh and including the Caledon East buried valley. (D) North to south cross-section of the eastern side of the watershed.
Coupes transversales de la moraine de Oak Ridges. (A) Coupe transversale est-ouest de la crête de la moraine de Oak Ridges. (B) Coupe transversale est-ouest de la plaine du till de Halton. (C) Coupe transversale nord-sud du marais de Holland et de la vallée de Caledon East. (D) Coupe transversale nord-sud de la partie est du bassin.
Figure 10
Graphic stratigraphic log of DH‑Nob core and three vertical sections along the Humber River. Legend is the same for Figures 11‑12. Note thick gravel deposit overlying the unconformity in DH‑Nob. See Figure 4 for location.
Coupe stratigraphique du forage de DH‑Nob et de trois autres sections situées dans le bassin de la rivière Humber. La légende est également la même pour les figures 11 et 12. Notez la présence d’un dépôt graveleux épais qui surmonte l’inconformité dans la coupe DH‑Nob. Voir la figure 4 pour la localisation du forage.
Figure 11
Graphic stratigraphic logs of three continuous cores from the Vaughan IWA site, northeastern Humber River watershed. Interbedded glaciolacustrine and diamicton Halton Till overlies ORM sediment. Note the ca. 40 m thick diffusely graded sand in the lower part of DH‑V‑158. See Figure 10 for description of symbols.
Coupe stratigraphique de trois forages continus au site de IWA Vaughan, nord-est du bassin de la rivière Humber. Des sédiments glaciolacustres entrecroisés et le diamicton du till de Halton surmontent les sédiments de la moraine de Oak Ridges. Notez la présence d’une couche diffuse de sable d’environ 40 cm dans la partie inférieure du forage DH‑V‑158. Voir la figure 10 pour la description des symboles.
Figure 12
Graphic stratigraphic logs of seven continuous cores from the Peel IWA sites, southwestern Humber River watershed (Figs. 4‑5B). Halton Till overlies ORM. Note how Halton Till complex drapes underlying deposits. Clay laminae are only observed in valleys.
Coupe stratigraphique de sept forages continus au site de IWA Peel, sud-ouest du bassin de la rivière Humber (Figs. 4‑5B). Le till de Halton surmonte la moraine de Oak Ridges et remarquez sa complexité de recouvrement des sédiments. Des argiles laminées sont seulement observées dans les vallées.
Figure 13
Graphic stratigraphic logs for the Gormley aggregate pit. Sections are arranged from west to east. Regional paleoflows is from east to west (right to left). Figure has been modified from Russell and Arnott (2003).
Coupes stratigraphiques du site de Gormley. Les coupes sont alignées de l’ouest vers l’est. Les paléoécoulements vont de l’est vers l’ouest (de droite à gauche). La figure a été modifiée à partir de Russell et Arnott (2003).
A
B
C
Characterisation of ORM composition. (A) Height of gravel units above the regional unconformity below the ORM. (B) Net gravel thickness in ORM dataset. (C) Net sand thickness in ORM dataset.
Composition de la moraine de Oak Ridges. (A) Hauteur des unités de graviers au-dessus de l’inconformité régionale et en-dessous la moraine de Oak Ridges. (B) Épaisseur nette des graviers dans la moraine de Oak Ridges. (C) Épaisseur nette des sables dans la moraine de Oak Ridges.
Figure 15
Sketch of sediment facies associations logs along an east-west cross-section of the ORM architecture, in the Humber River watershed. Upper case roman numerals and letters indicate the main sediment facies associations; I, tunnel channel, II, basin rythmite, and III, subaqueous fan. Lower case roman numerals indicate elements of the subaqueous fan association defined within the figure. Fan is shown as fining from east to west.
Illustration des associations de faciès sédimentaires d’une coupe transversale est-ouest de la moraine de Oak Ridges, dans le bassin de la rivière Humber. Les chiffres romains en majuscules et les lettres indiquent les principaux faciès; où I sont les chenaux en tunnel, II, les varves et III, le cône subaquatique. Les chiffres romains en minuscules indiquent les éléments du cône subaquatique. Le cône s’amincit de l’ouest vers l’est.
A
B
C
D
E
F
Photos of selected elements of the subaqueous fan facies assemblage. (A) Planar-stratified gravel with upward fining couplets, clast clusters, and open-work pebble beds; paleoflow toward the right. (B) Unconsolidated sand intraclast in massive and inverse-graded sandy gravel; paleoflow to the right. (C) Low-angle cross-stratified medium sand interpreted as antidune cross-stratification. (D) Diffusely graded fine sand filling a steep-walled scour. (E) Succession of climbing ripple-scale cross-laminated fine sand; paleoflow is from right to left. (F) Stoss-depositional, climbing ripple-scale cross-lamination; note the steep angle of climb and well-graded beds, coin is 2.5 cm in diameter. One metre scale stick has 10 cm divisions.
Photographies des faciès sédimentaires du cône subaquatique. (A) Gravier plat et stratifiés avec des couplets fins orientés vers le haut, amas d’erratiques et lits de galets remaniés; le paléoécoulement est orienté vers la droite. (B) Inclusions de sable non-consolidé dans du sable graveleux massif et inversé; le paléoécoulement est orienté vers la droite. (C) Lits entrecroisés de sable moyen à faible pendage interprétés comme une stratification entrecroisée typique aux antidunes. (D) Sable fin diffus dans une zone de surcreusement. (E) Succession de sable fin laminé en rides; le paléoécoulement est orienté vers la gauche. (F) Rides laminées ondulées; remarquez l’ange d’inclinaison des lits, la pièce a un diamètre de 2,5 cm. L’échelle métrique est graduée à chaque 10 cm.
A
B
C
Photos of sediment facies of the basin rhythmite association. (A) Normally graded beds of fine sand and silt with minor drilling-induced deformation. (B) Normally graded, microlaminated, fine sand and silt. (C) Normally graded fine sand and silt overlain by a clay bed.
Photographies des faciès sédimentaires des varves. (A) Lits normaux de sable fin et de limon avec une faible déformation associée au forage. (B) Lits normaux de sable fin et de limon microlaminés. (C) Lits normaux de sable fin et de limon surmontés d’un lit argileux.
A
Peel IWA Site
B
Vaughan and Nobleton sites
Varve diagram for core data showing varve thickness and varve count from lowest varve (right) upward (left). Arrows indicate potentially correlative varves. Note the thicker varves in DH‑P‑20a compared to DH‑P‑17. Italized numbers are elevation above sea level.
Diagramme de l’épaisseur et du comptage des varves, de la varve inférieure (droite) vers le haut (gauche). Les flèches indiquent la corrélation possible des varves. Comparez la différence de l’épaisseur des varves des sites DH‑P‑20a et DH‑P‑7. Les chiffres en italique indiquent l’élévation du niveau de la mer.
A
Sheet-flood erosion
B
Tunnel channel erosion
C
Stage I : channel fill
D
Stage II : rhythmite sedimentation
E
Stage III : basin setting
F
Stage III : subaqueous fan sedimentation
Diagrams outlining the depositional history of the ORM. (A) Sculpting of Newmarket Till into drumlins by regional sheet floods. (B) Tunnel channel erosion by episodic outbreak floods. (C) Stage I channel fill showing diffusely-graded sand along channel axis and gravel deposits along channel margin. (D) Stage II rhythmite deposition from seasonal meltwater discharge into flooded, subglacial tunnel channels. (E) Ice-contact basin model for stage III sedimentation of the ORM ridge. (F) Subaqueous fan sedimentation during stage III of flood discharge from subglacial conduits.
Schémas de la mise en place de la moraine de Oak Ridges. (A) Modelage du till de Newmarket en drumlins par des inondations régionales. (B) Érosion en chenaux par des inondations épisodiques. (C) Phase I: remplissage des chenaux avec du sable diffus dans l’axe des chenaux et par des dépôts graveleux le long des marges des chenaux. (D) Phase II: déposition des varves par les eaux de fonte saisonnières et par les chenaux en tunnel sous-glaciaires. (E) Zone de contact glaciaire pendant la formation de la crête de la moraine de Oak Ridges. (F) Sédimentation du cône subaquatique par des conduits sous-glaciaires durant la Phase III.
Liste des tableaux
Table I
Summary of diamicton and gravel lithofacies in the western Oak Ridge Moraine
Sediment sub-facies described in detail in previous publications (Russell and Arnott, 2003; Russell et al., 2003a).
Table II
Summary of sand lithofacies in the western Oak Ridge Moraine
Table III
Summary of sand-silt and clay lithofacies in the western Oak Ridge Moraine