
Résumés
Abstract
“Mining the Internet Graveyard” argues that the advent of massive quantity of born-digital historical sources necessitates a rethinking of the historians’ toolkit. The contours of a third wave of computational history are outlined, a trend marked by ever-increasing amounts of digitized information (especially web based), falling digital storage costs, a move to the cloud, and a corresponding increase in computational power to process these sources. Following this, the article uses a case study of an early born-digital archive at Library and Archives Canada – Canada’s Digital Collections project (CDC) – to bring some of these problems into view. An array of off-the-shelf data analysis solutions, coupled with code written in Mathematica, helps us bring context and retrieve information from a digital collection on a previously inaccessible scale. The article concludes with an illustration of the various computational tools available, as well as a call for greater digital literacy in history curricula and professional development.
Résumé
Dans cet article, l’auteur soutient que la production d’une grande quantité de sources historiques numériques nécessite une réévaluation du coffre à outils des historiennes et des historiens. Une troisième vague d’histoire informatique, marquée par un nombre toujours croissant d’informations numérisées (surtout dans le cadre d’Internet), la chute des coûts d’entreposage des données numériques, le développement des nuages informatiques et l’augmentation parallèle de la capacité d’utiliser ces sources, bouleverse déjà la pratique historienne. Cet article se veut une étude de cas basée sur ces observations. Il étudie plus particulièrement un projet de numérisation de Bibliothèque et Archives Canada — les Collections numérisées du Canada — pour éclairer certains défis ci-haut mentionnés. Un ensemble de solutions prêtes à utiliser pour l’analyse de données, jumelé avec un code informatique écrit en Mathematica, peut contribuer à retracer le contexte et à retrouver des informations à partir d’une collection numérique précédemment inaccessible aux chercheurs étant donné sa taille. L’article se termine par une présentation des différents outils informatiques accessibles aux historiens ainsi que par un appel à l’acquisition d’une plus grande culture numérique dans les curriculums en histoire et dans le développement professionnel des historiens.
Corps de l’article
The information produced and consumed by humankind used to vanish — that was the norm, the default. The sights, the sounds, the songs, the spoken word just melted away. Marks on stone, parchment, and paper were the special case. It did not occur to Sophocles’ audiences that it would be sad for his plays to be lost; they enjoyed the show. Now expectations have inverted. Everything may be recorded and preserved, at least potentially.
James Gleick, The Information: A History, a Theory, a Flood, 396–7
Almost every day almost every Canadian generates born-digital information that is fast becoming a sea of data. Historians must learn how to navigate this sea of digital material. Where will the historian of the future go to research today’s history? What types of sources will they use? We are currently experiencing a revolutionary medium shift. As the price of digital storage plummets and communications are increasingly carried through digitized text, pictures, and video, the primary sources left for future historians will require a significantly expanded and rethought toolkit. The need to manage a plethora of born-digital sources (those originally digitally created) as an essential part of history will be on us soon. While there is no commonly accepted rule-of-thumb for when a topic becomes “history,” it is worth noting as an example that it took less than 30 years after the tumultuous year of 1968 for a varied, developed, and contentious North American historiography to appear on the topic of life in the 1960s.[1] In 2021, it will have been a similar 30 years since, in August 1991, Tim Berners-Lee, a fellow at the European Organization for Nuclear Research (CERN), published the very first website and launched the World Wide Web. Professional historians need to be ready to add and develop new skills to deal with sources born in a digital age.
Digital sources necessitate a rethinking of the historian’s toolkit. Basic training for new historians requires familiarity with new methodological tools and making resources for the acquisition of these tools available to their mentors and teachers. Not only will these tools help in dealing with more recent born-digital sources, but they will also help historians capitalize on digitized archival sources from our more-distant past. This form of history will not replace earlier methodologies, but instead play a meaningful collaborative and supportive role. It will be a form of distant reading, encompassing thousands, or tens of thousands, of sources that will complement the more traditional and critically important close reading of small batches of sources that characterizes so much of our work. Indeed, much of what we think of as “digital history” may simply be “history” in the years to come.[2]
There are a number of avenues along which this transformation will take place. First, it is important to establish a map that situates this emerging field into what has come before. Second, I examine the current situation of born-digital sources and historical practice. Third, I use an early born-digital archive from Library and Archives Canada (LAC), Canada’s Digital Collections project (CDC), to evaluate how we access and make sense of digital information today. I then apply emergent visualization techniques to the sources in this archive to show one way through which historians can tackle born-digital source issues. Lastly, I will lay out a road map to ensure that the next generation has enough basic digital literacy to ensure that historians can adequately analyze this new form of source material.
Imagine a future historian, taking on a central question of social and cultural life in the middle of the first decade of the twenty-first century, such as how Canadians understood Idle No More or the Occupy movement through social media? What would her archive look like? I like to imagine it as boxes stretching out into the distance, tapering off, without any immediate reference points to bring it into perspective. Many of these digital archives will be without human-generated finding aids, would have perhaps no dividers or headings within “files,” and certainly no archivist with a comprehensive grasp of the collection contents. A recent example is illustrative. During the #IdleNoMore protests, Twitter witnessed an astounding 55,334 tweets on 11 January 2013. Each tweet can be up to 140 characters. To put that into perspective, this article is less than 900 lines long in a word processor. Yet this massive amount of information looks cryptic: strange usernames, no archives, no folders, not even an immediate way to see whether a given tweet is relevant to your research or not.[3] This is a vast collection. Information overload.
This example is indicative of the issues facing the historical profession.[4] I am not exaggerating. Every day half a billion tweets are sent,[5] hundreds of thousands of comments are uploaded to news sites, and scores of blog posts are uploaded. This makes up one small aspect of broader data sets: automated logs including climate readings, security access reports, library activity, search patterns, books, and movies ordered from Amazon.ca or Netflix.[6] Even if only a small fraction of this is available to future historians, it will represent an unparalleled source of information about how life was lived (or thought to have been lived) during the early-twenty-first century. To provide another, perhaps more tangible example, while carrying out my previous work on youth cultures in 1960s English-Canada, I was struck by how inaccessible television sources were compared to newspaper records, despite television being arguably the primary media of the time. Unlike the 1960s, however, the Internet leaves a plethora of available — if difficult to access — primary sources for historians. In the digital age, archiving will be different, which means that the history we write will be different.
We must begin planning for this plethora of born-digital sources now. Using modern technology, we have the ability to quickly find needles in digital haystacks, to look inside a ‘box’ and immediately find that relevant letter, rather than spending hours searching and reading everything. Yet we also have the ability to pull our gaze back, distantly elucidating the context to our relevant documents as well.
The Necessity of Distant Reading: Historians and Computational History
Franco Moretti, in his 2005 groundbreaking work of literary criticism Graphs, Maps, Trees, called on his colleagues to rethink their craft. With the advent of mass produced novels in nineteenth-century Britain, Moretti argued that scholars must change their disciplinary approach. Traditionally, literary scholars worked with a corpus of around 200 novels; though an impressive number for the average person, it represents only around one percent of the total output of that period. To work with all of this material in an effort to understand these novels as a genre, critics needed to approach research questions in a different way:
[C]lose reading won’t help here, a novel a day every day of the year would take a century or so …. And it’s not even a matter of time, but of method: a field this large cannot be understood by stitching together separate bit of knowledge about individual cases, because it isn’t a sum of individual cases: it’s a collective system, that should be grasped as such, as a whole.[7]
Instead of close reading, Moretti called for literary theorists to practice “distant reading.”
For inspiration, Moretti drew on the work of French Annales historian Fernand Braudel. Braudel, amongst the most instrumental historians of the twentieth century, pioneered a similarly distant approach to history: his inquiries spanned large expanses of time and space, that of civilizations, the Mediterranean world, as well as smaller (only by comparison) regional histories of Italy and France. His distant approach to history did not necessitate disengagement with the human actors on the ground, seeing instead that beyond the narrow focus of individual events lay the constant ebb and flow of poverty and other endemic structural features.[8] While his methodology does not apply itself well to rapidly changing societies (his focus was on the long-term slow change), his points around distant reading and the need for collaborative, interdisciplinary research are a useful antecedent. Similar opportunities present themselves when dealing with the vast array of born-digital sources (as well as digitized historical sources): we can distantly read large arrays of sources from a longue durée of time and space, mediated through algorithms and computer interfaces, opening up the ability to consider the voices of everybody preserved in the source.
Historians must be open to the digital turn due to the astounding growth of digital sources and an increasing technical ability to process them on a mass scale. Social sciences and humanities researchers have begun to witness a profound transformation in how they conduct and disseminate their work. Indeed, historical digital sources have reached a scale where they defy conventional analysis and now require computational analysis. Responding to this, archives are increasingly committed to preserving cultural heritage materials in digital forms.
I would like to pre-emptively respond to two criticisms of this digital shift within the historical profession. First, historians will not all have to become programmers. Just as not all historians need a firm grasp of Geographical Information Systems (GIS), or a developed understanding of the methodological implications of community-based oral history, the incorporation of a transnational perspective, or in-depth engagement with cutting edge demographic models, not all historians have to approach their trade from a computational perspective. Nor should they. Digital history does not replace close reading, traditional archival inquiry, or going into communities — to use only a few examples — to uncover notions of collective memory or trauma. Indeed, digital historians will play a facilitative role and provide a broader reading context. Yet they will still be historians, collecting relevant sources, analyzing and contextualizing them, situating them in convincing narratives or explanatory frameworks, and disseminating their findings to wider audiences.
Neither will historians replace professional programmers. Instead, as with other subfields, historians using digital sources will need to be prepared to work on larger, truly interdisciplinary teams. Computer scientists, statisticians, and mathematicians, for example, have critical methodological and analytical contributions to make towards questions of historical inquiry. Historians need to forge further links with these disciplines. Such meaningful collaboration, however, will require historians who can speak their languages and who have an understanding of their work. Some of us must be able to discuss computational or algorithmic methodologies when we collectively explore the past.
The methodologies discussed in this paper fall into the twin fields of data mining and textual analysis. The former refers to the discovery of patterns or information about large amounts of information, while the latter refers to the use of digital tools to analyze large quantities of text.[9] The case study here draws upon three main concepts: information retrieval (quickly finding what you want), information and term frequency (how often do various concepts and terms appear), and topic modeling (finding frequently occurring bags of words throughout documents). Other projects have involved authorship attribution, which is finding out the author of documents based on previous patterns, style analysis, or creating network graphs of topics, groups, documents, or individuals.
The Culturomics project, run by the Cultural Observatory at Harvard University, is a notable model of collaboration on a big history project. As laid out in Science and put online as the Google Books n-gram viewer (www.books.google.com/ngrams/), this project indexed word and phrase frequency across over five million books, enabling researchers to trace the rise and fall of cultural ideas and phenomena through targeted keyword and phrase searches.[10] This is the most ambitious and certainly the most advanced and accessible Big History project yet launched. Yet, amongst the extensive author list (13 individuals and the Google Books team), there were no historians. This suggests that other disciplines in the humanities and social sciences have embraced the digital turn far more than historians. However, as I mentioned, in the coming decades, historians will increasingly rely on digital archives. There is a risk that history, as a professional discipline, could be left behind.
American Historical Association President Anthony Grafton noted this absence in a widely circulated Perspectives article. Why was there no historian, he asked, when this was both primarily a historical project and a team comprised of varied doctoral holders from disciplines such as English literature, psychology, computer science, biology, and mathematics?[12] Culturomics project leaders Erez Leiberman Aiden and Jean-Baptiste Michel responded frankly. While the team approached historians, and some did play advisory roles, every author listed “directly contributed to either the creation of the collection of written texts (the ‘corpus’), or to the design and execution of the specific analyses we performed. No academic historians met this bar.” They continued to indict the profession:
The historians who came to the meeting were intelligent, kind, and encouraging. But they didn’t seem to have a good sense of how to wield quantitative data to answer questions, didn’t have relevant computational skills, and didn’t seem to have the time to dedicate to a big multi-author collaboration. It’s not their fault: these things don’t appear to be taught or encouraged in history departments right now.[13]
This is a serious indictment considering the pending archival shift to digital sources, and one that still largely holds true (a few history departments now offer digital history courses, but they are still outliers). This form of history, the massive analysis of digitized information, will continue. Furthermore, these approaches will attract public attention, as they lend themselves well to accessible online deployment. Unless historians are well positioned, they risk ceding professional ground to other disciplines.
While historians were not involved in Culturomics, they are, however, involved in several other digital projects. Two major and ambitious long-term Canadian projects are currently using computational methods to reconstruct the demographic past. The first is the Canadian Century Research Infrastructure project, which is creating databases from five censuses and aiming to provide “a new foundation for the study of social, economic, cultural, and political change”; while the second is the Programme de recherche en démographie historique, hosted by the Université de Montréal.[13] They are reconstructing the European population of Quebec in the seventeenth and eighteenth centuries, drawing heavily on parish registers. Furthermore, several projects in England have harnessed the wave of interest in “big data” to tell compelling historical stories about their pasts: the Criminal Intent project, for example, used the proceedings of the Old Bailey courts (the main criminal court in Greater London) to visualize large quantities of historical information.[14] The Criminal Intent project was itself funded by the Digging into Data Challenge, which brings together multinational research teams and funding from federal-level funding agencies in Canada, the United States, the United Kingdom, and beyond. Several other historical studies have been funded under their auspices: from studies of commodity trade in the eighteenth- and nineteenth-century Atlantic world (involving scholars at the University of Edinburgh, the University of St. Andrews, and York University), to data mining the degrees of economic opportunity and spatial mobility in Britain, Canada, and the United States (bringing researchers at the University of Guelph, the University of Leicester, and the University of Minnesota together).[15] These exciting interdisciplinary teams may be heralding a disciplinal shift, although it is still early days.
Collaborative teams have limitations, though. We will have to be prepared to tackle digital sources alone on shoestring budgets. Historians will not always be able to call on external programmers or specialists to do work, because teams often develop out of funding grants. As governmental and university budgets often prove unable to meet consistent research needs, baseline technical knowledge is required for independent and unfunded work. If historians rely exclusively on outside help to deal with born-digital sources, the ability to do computational history diminishes. As the success of the Programming Historian indicates, and as I will demonstrate in my case study below, historians can learn basic techniques.[16] Let us tweak our own algorithms.
A social or cultural history of the very late-twentieth or twenty-first century will have to account for born-digital sources, and historians will (in conjunction with archival professionals) have to curate and make sense of the data. Historians need to be able to engage with these sources themselves, or at least as part of a team, rather than having sources mediated through the lens of outside disciplines or commercial interests. Algorithms may be one meaningful way to make sense of cultural trends, or extract meaningful information from billions of tweets, but we must ensure professional historical input goes into their crafting.
The Third Wave of Computational History
Historians have fruitfully used computers in the past, as part of two previous waves. The 1960s and 1970s saw computational tools used for demographic, population, and economic histories, a trend that in Canada saw full realization in comprehensive studies, such as Michael Katz’s The People of Hamilton, Canada West.[17] As Ian Anderson has convincingly noted in a review of history and computing, studies of this sort saw the field become associated with quantitative studies.[18] After a retreat from the spotlight, computational history rose again in the 1990s with the advent of the personal computer, graphical user interfaces, and overall improvements in ease of use. Punch cards could now give way to database programs, GIS, and early online networks such as H-Net and Usenet. We are now, I believe, on the cusp of a third revolution in computational history thanks to three main factors: decreasing storage costs, the power of the Internet and distributed cloud computing, and the rise of professionals dealing with both digital preservation and open-source tools.
Decreasing storage costs have led to massive amounts of information being preserved, as Gleick noted in this article’s epigraph. It is important to note that this information overload is not new. People have long worried about the impact of too much information.[19] In the sixteenth century, responding to the rise of the printing press, the German priest Martin Luther decried that the “multitude of books [were] a great evil.” In the nineteenth century, Edgar Allan Poe bemoaned, “[t]he enormous multiplication of books in every branch of knowledge is one of the greatest evils of this age.” As recently as 1970, American historian Lewis Mumford lamented, “the overproduction of books will bring about a state of intellectual enervation and depletion hardly to be distinguished from massive ignorance.”[20] The rise of born-digital sources must thus be seen in this continuous context of handwringing around the expansion and rise of information.
Useful historical information is being preserved at a rate that is accelerating with every passing day. One useful metric to compare dataset size is that of the American Library of Congress (LOC). Indeed, a “LOC” has become shorthand for a unit of measurement in the digital humanities. Measuring the actual extant of the printed collection in terms of data is notoriously difficult: James Gleick has claimed it to be around 10TB,[22] whereas the Library of Congress itself claims a more accurate figure is about 200TB.[23] While these two figures are obviously divergent, neither is on an unimaginable scale — personal computers now often ship with a terabyte or more of storage. When Claude Shannon, the father of information theory, carried out a thought experiment in 1949 about items or places that might store “information” (an emerging field which viewed messages in their aggregate), he scaled sites from a digit upwards to the largest collection he could imagine. The list scaled up logarithmically, from 10 to the power of 0 to 10 to the power of 13. If a single-spaced page of typing is 104, 107 the Proceedings of the Institute of Radio Engineers, 109 the entire text of the Encyclopaedia Brittanica, then 1014 was “the largest information stockpile he could think of: the Library of Congress.”[24]
But now the Library of Congress’ print collection — something that has taken two centuries to gather — is dwarfed by their newest collection of archived born-digital sources, the vast majority only a matter of years old compared to the much wider date-range of non-digital sources in the traditional collection. The LOC has begun collecting its own born-digital Internet archive: multiple snapshots are taken of webpages, to show how they change over time. Even as a selective curated collection, drawing on governmental, political, educational, and creative websites, the LOC has already collected 254TB of data and adds 5TB a month.[25] The Internet Archive, through its Wayback Machine, is even more ambitious. It seeks to archive every website on the Internet. While its size is also hard to put an exact finger on, as of late 2012 it had over 10 Petabytes of information (or, to put it into perspective, a little over 50 Library of Congresses if we take the 200TB figure).[26]
Holdings Size (in TBs)

This is, to some degree, comparing apples and oranges: the Library of Congress is predominantly print, whereas the Internet Archive has considerable multimedia holdings, which includes videos, images, and audio files. The LOC is, furthermore, a more curated collection, whereas the Internet Archive draws from a wider range of producers. The Internet offers the advantages and disadvantages of being a more democratic archive. For example, a Geocities site (an early way for anybody to create their own website) created by a 12-year old Canadian teenager in the mid-1990s might be preserved by the Internet Archive, whereas it almost certainly would not be saved by a national archive. This difference in size and collections management, however, is at the root of the changing historians’ toolkit. If we make use of these large data troves, we can access a new and broad range of historical subjects.
Conventional sources are also part of this deluge. Google Books has been digitizing the printed word, and it currently has 15 million works completed; by 2020, it audaciously aims to digitize every book ever written. While copyright issues loom, the project will allow researchers to access aggregate word and phrase data as seen in the Google n-gram project.[27] In Canada, Library and Archives Canada (LAC) has a more circumscribed digitization project, collecting “a representative sample of Canadian websites,” focusing particularly on Government of Canada webpages, as well as a curated approach preserving case studies, such as the 2006 federal election. Currently, it has 4TB of federal government information and 7TB of total information in its larger web archive (a figure which, as I note below, is unlikely to drastically improve despite ostensible goals of archival ‘modernization’).[28]
In Canada, LAC has — on the surface — has been advancing an ambitious digitization program as it realizes the challenges now facing archivists and historians. Daniel J. Caron, the Librarian and Archivist of Canada, has been outspoken on this front with several public addresses on the question of digital sources and archives. Throughout 2012, primary source digitization at LAC preoccupied critics who saw it as a means to depreciate on-site access. The Canadian Association of University Teachers, the Canadian Historical Association, as well as other professional organizations, mounted campaigns against this shift in resources.[29] LAC does have a point, however, with their modernization agenda. The state of Canada’s online collections are small and sorely lacking when compared to their on-site collections, and LAC does need to modernize and achieve the laudable goal of reaching audiences beyond Ottawa.
Nonetheless, digitization has unfortunately been used as a smokescreen to depreciate overall service offerings.[30] The modernization agenda would also see 50 percent of the digitization staff cut.[31] LAC’s online collections are small, they do not work with online developers through Application Programming Interfaces (APIs, a way for a computer program to talk to another computer and speed up research — Canadiana.ca is incidentally a leader in this area), and there have been no promising indications that this state of affairs will change. Digitization has not been comprehensive. Online preservation is important, and historians must fight for both on-site and on-line access.
A number of historians have recognized this challenge and are playing an instrumental role in preserving the born-digital past. The Roy Rosenzweig Center for History and New Media at George Mason University launched several high-profile preservation projects: the September 11th Digital Archive, the Hurricane Digital Memory Bank (focusing on Hurricanes Katrina and Rita), and, as of writing, the #Occupy archive.[32] Massive amounts of online content is curated and preserved: photographs, news reports, blog posts, and now tweets. These complement more traditional efforts of collecting and preserving oral histories and personal recollections, which are then geo-tagged (tied to a particular geographical location), transcribed, and placed online. These archives serve a dual purpose: preserving the past for future generations, while also facilitating easy dissemination for today’s audiences.
Digital preservation, however, is a topic of critical importance. Much of our early digital heritage has been lost. Many websites, especially those before the Internet Archive’s 1996 web archiving project launch, are completely gone. Early storage mediums (from tape to early floppy disks) have become obsolete and are now nearly inaccessible. Compounding this, software development has seen early proprietary file formats depreciated, ignored, and eventually made wholly inaccessible.[33] Fortunately, the problem of digital preservation was recognized by the 1990s, and in 2000 the American government established the National Digital Information Infrastructure and Preservation Program.[34] As early as 1998, digital preservationists argued, “[h]istorians will look back on this era … and see a period of very little information. A ‘digital gap’ will span from the beginning of the wide-spread use of the computer until the time we eventually solve this problem. What we’re all trying to do is to shorten that gap.” To bear home their successes, that quotation is taken from an Internet Archive snapshot of Wired magazine’s website.[35]
Indeed, greater attention towards rigorous metadata (which is, briefly put, data about data often preserved in plain text format), open-access file formats documented by the International Organization for Standardization (ISO), and dedicated digital preservation librarians and archivists gives us hope for the future.[36] It is my belief that cloud storage, the online hosting of data in large third-party offsite centres, mitigates the issue of obsolete storage medium. Furthermore, that the move towards open source file formats, even amongst large commercial enterprises, such as Microsoft, provides greater documentation and uniformity.
A Brief Case Study: Accessing and Navigating Canada’s Digital Collections, With an Emphasis on Tools for Born-Digital Sources
What can we do about this digital deluge? There are no simple answers, but historians must begin to conceptualize new additions to their traditional research and pedagogical toolkits. In the section that follows, I will do two things: introduce a case study and several tools, both proprietary and those that are open and available off-the-shelf to reveal one way forward.
For a case study, I have elected to use Canada’s Digital Collections (CDC), a collection of ‘dead’ websites: removed from their original location on the World Wide Web and now digitally archived at LAC. In this section, I will introduce the collection using digitally-archived sources from the early World Wide Web and discuss my research methodology before illustrating how we can derive meaningful data from massive arrays of unstructured data.[37]
This is a case study of a web archive. Several of these methodologies could be applied to other formats, including large arrays of textual material whether born-digital or not. A distant reading of this type is not medium specific. It does, however, assume that the text is high quality. Digitized primary documents do not always have text layers, and if they are instituted computationally through Optical Character Recognition errors can appear. Accuracy rates for digitized textual documents can range from as low as 40 percent for seventeenth and eighteenth century documents, to 80–90 percent for modern microfilmed newspapers, to over 99 percent for typeset, word-processed documents.[38] That said, while historians today may be more interested in applying distant reading methodologies to more traditional primary source materials, it is my belief that in the not-so-distant future websites will be an increasingly significant source for social, cultural, and political historians.
What are Canada’s Digital Collections? In 1996, Industry Canada, funded by the federal Youth Employment Strategy, facilitated the development of Canadian heritage websites by youth (defined as anyone between the age of 15 and 30). It issued contracts to private corporations that agreed to use these individuals as web developers, for the twofold purpose of developing digital skills and instilling respect for and engagement with Canadian heritage and preservation.[39] The collection, initially called SchoolNet but rebranded as Canada’s Digital Collections in 1999, was accessible from the CDC homepage. After 2004, the program was shut down, and the vast majority of the websites were archived on LAC’s webpage. This collection is now the largest born-digital Internet archive that LAC holds, worthy of study as content, as well as thinking about methodological approaches.
Conventional records about the program are unavailable in the traditional LAC collection, unsurprising in light of both its recent creation and backlogs in processing and accessioning archival materials. We can use one element of our born-digital toolkit, the Internet Archive’s WaybackMachine (its archive of preserved early webpages), to get a sense of what this project looked like in its heyday. The main webpage for the CDC was www.collections.ic.gc/. However, a visitor today will see nothing but a collection of broken image links (two of them will bring you to the English and French-language versions of the LAC-hosted web archive, although this is only discernible through trial and error or through the site’s source code).
With the WaybackMachine, we have a powerful albeit limited opportunity to “go back in time” and experience the website as previous web viewers would have (if a preserved website is available, of course). Among the over 420 million archived websites, we can search for and find the original CDC site. Between 12 October 1999, and the most recent snapshot or web crawl (of the now-broken site) on 6 July 2011, the site was crawled 410 times.[40] Unfortunately, every site version until the 15 October 2000 crawl has been somehow corrupted. Content has been instead replaced by Chinese characters, which translate only into place names and other random words. Issues of early digital preservation, noted above, have reared their head in this collection.
From late 2000 onward, however, fully preserved CDC sites are accessible. Featured sites, new entries, success stories, awards, curricular units, and prominent invitations to apply for project funding populate the brightly coloured website. The excitement is palpable. John Manley, then Industry Minister, declared, “it is crucial that Canada’s young people get the skills and experience they need to participate in the knowledge-based economy of the future” and that CDC “shows that young people facing significant employment challenges can contribute to, and learn from, the resources available on the Information Highway.”[41] The documentation, reflecting the lower level of technical expertise and scarcity of computer hardware at the time, was comprehensive: participants were encouraged to identify a collection, digitize it, process it (by cleaning up the data), preserve it on a hard drive, and display it on the web. Issues of copyright were discussed, as well as preservation issues and hardware requirements for computers (a computer with an Intel 386 processor, 8MB RAM, a 1GB hard drive and 28.8bps modem was recommended), and training information for employers, educators, and participants.[42] Sample proposals, community liaison ideas, amidst other information, set out a very comprehensive roadmap for a grassroots, bottom-up approach to digital preservation and heritage.
Moving through the preserved websites is an interesting snapshot at how web design standards changed. Colour disappears, replaced by a more subdued coordinated federal website standard (still largely in effect today). Surveys greet viewers from 2003 onwards, trying to learn how viewers discovered the site, whether they think it is a good educational resource (they must have been relieved that the majority thought so — in 2003, some 84 percent felt that it was a “good” resource, the best of its type).[43] By 2004, the program was engaging in active remembrance of its past programs, as it neared its ten-year anniversary. Proposals stopped being accepted in July 2004, but the 600 webpages were still accessible, with a comprehensive subject index, alphabetical listing, success stories, and detailed copyright information.
The Canada’s Digital Collections site began to move towards removal in November 2006, and was initially completely gone. A visitor to the site would learn that the content “is no longer available,” and an e-mail address was provided for contributors to get their information back.[44] The information was completely inaccessible and by early 2007, a bold notice announced that the now-empty site would close as of 2 April 2007. Luckily, by April 2007, a notice appeared with a declaration that the collections were now archived by Library and Archives Canada, just in time for the website to completely disappear by July 2007. In the archived version, subject indexes and headings were gone. All that remained then and today, for that matter, is a straight-forward alphabetical list and a disclaimer that noted, “[y]ou are viewing a document archived by Library and Archives Canada. Please note, information may be out of date and some functionality lost.”
The question now is what we can do with this collection of websites? Could a distant reading, as opposed to a close reading on a targeted level, tell us something about this collection? Fortunately, we have a variety of tools that can help us navigate this large array of information, several of which I use to navigate large amounts of data. First, I create my own tools through computer programming. This work is showcased in the following section. I program in Wolfram Research’s Mathematica 9. Mathematica is an integrated platform for technical computing that allows users to process, visualize, and interact with exceptional arrays of information.[45] It is a language with an engaged and generous user base that complements exhaustive, well-written documentation from Wolfram Research. To emphasize its ease, one line of code could import a website in perfectly readable plaintext (avoiding unicode errors) as follows: input=Import[“http://activehistory.ca/“,”Plaintext”]; and a second one could make it all in lower text for textual analysis, as such: lowerpage= ToLowerCase[input]. Variables are a critical building block. In the former example, “input” now holds the entire plaintext of the website ActiveHistory.ca, and then “lowerpage” holds it in lowercase. Once we have lower-cased information, we are quickly able to extract the following: frequent words, frequent phrases, and could thus create a dynamic database of n-grams, word clouds, or run other textual analysis programs on the material. Much of the syntax adheres to a recognizable English-language format.
Even more promising is Mathematica’s integration with the Wolfram|Alpha database (itself accessible at wolframalpha.com), a computational knowledge engine that promises to put incredible amounts of information at a user’s fingertips. With a quick command, one can access the temperature at Toronto’s Lester B. Pearson International Airport at 5:00 p.m. on 18 December 1983; the relative popularity of names such as “Edith” or “Emma”; the Canadian unemployment rate in March 1985; or the Canadian Gross Domestic Product in December 1995.[46] This allows one to quickly cross-reference findings with statistical information, or find coincidental points of comparison. As universities are now being actively encouraged to contribute their information to Wolfram|Alpha, this will become an increasingly powerful database.
For many researchers, the downside of Mathematica is a considerable one. It is proprietary software and relatively expensive for student and non-student alike. Outputs, however, can be disseminated using the Computational Document Format (CDF), enabling historians to put their work online and entice the general public to dynamically work with their models and findings.
Programming is not the be all and end all. Information visualization in the humanities is a growing international field, with Canadian scholars heavily involved. The most important and accessible example is Voyant Tools.[47] It is a powerful suite of textual analysis tools. Uploading one’s own text or collection of texts, drawing on a webpage, or analyzing existing bodies of work, one sees the following: a “word cloud” of a corpus, click on any word to see its relative rise and fall over time (word trends), access the original text, and click on any word to see its contextual placement within individual sentences. It ably facilitates the “distance” reading of any reasonably-sized body of textual information, and should be a beginning point for those interested in this field. The only downside is that Voyant can choke on very large amounts of information, as it is a textual analysis rather than robust data mining tool.
There are several other complementary tools. A notable one is the Many Eyes website hosted by IBM Research. Many Eyes allows you to upload datasets, be they textual, tabular, or numerical. There are many visualization options provided: you can plot relationships between data, compare values (i.e., bar charts and bubble charts), track data over time, and apply information to maps. The only downside to Many Eyes is that you must register and make your datasets available to all other registered researchers, as well as IBM. This limits your ability to use copyrighted or proprietary information.
More advanced, technical users can avail themselves of a host of textual analysis programs found elsewhere on the web. The most comprehensive gathering of these tools can be found with the Software Environment for the Advancement of Scholarly Research (SEASR) and its Meandre workbench. Meandre, which can be installed as a local server on your system or — in a best case scenario — hosted by an institutional IT department, allows you to tap into a variety of workflows to analyze data.[48] One workflow mentioned in this article is the topic modeling toolkit found within the Machine Learning for Language Toolkit (MALLET) package, which clusters unstructured data into “topics” which appear together, giving a quick sense of a document’s structure.[49] Other workflows found within SEASR include Dunning’s log-likelihood statistic, which compares a selected document to a broader reference corpus. For example, you could compare the lyrics that appear in 1968 against all lyrics in the postwar era, and learn what makes 1968 most unique;[50] sentiment analyses, which attempt to plot changes in emotional words and phrases over time; and a variety of entity extraction algorithms (which find “people,” “places,” and so forth in a text). Corpuses that were previously too big to extract meaningful information from can now be explored relatively quickly.
As befits a technical side to history, all of the freely available tools discussed briefly here (notably wget, SEASR, and MALLET) are discussed in more technical terms in the peer-reviewed Programming Historian 2 or on my own blog at ianmilligan.ca. I have elected to leave them online rather than provide commands in this article: they require some technical knowledge, and directly working from the web is quicker than here. Please consider the following section an applied version of some of the lessons you can learn through these processes.
From Web Collection to Dynamic Finding Aids
Let us briefly return to our archival metaphor. Today’s historian, dealing with conventional sources, often has to physically travel to an archive, requisition boxes, perhaps take photographs of materials if time is tight, and otherwise take notes. With born-digital sources, however, the formula is reversed. Our sources can come to us. In a few keystrokes, we can bring an unparalleled quantity of information to our home or work computers. With Canada’s Digital Collections, a single command line entry brought the entire archive onto my system; it took days to process the information and I had to leave my computer on, but it did not require any active user engagement.
How big is the CDC collection, in terms of sheer information? The plaintext without any HTML markup is approximately 7,805,135 words. If each page contained 250 words, it would be the equivalent of a 31,220 page essay or 1,000 dissertations. However, it is even more complicated than just reading 1,000 dissertations. The information is spread across 73,585 separate HTML files, themselves part of a much broader corpus of 278,785 files. Even the sheer size of the database requires big data methodologies: an aggregate size of 7.26 GB, 360 MB of plaintext with HTML encoding, reduced to a ‘mere’ 50MB if all encoding is removed. A 50MB plain text document can quickly slow down even a relatively powerful personal computer. There is no simple way to make this a conventionally accessible amount of information.
How can we access this information? Several different methods are possible. First, we can work with the information on the internet itself, or we can download it onto our own system. I prefer the latter method, as it decreases computational time, adds flexibility, and enables free rein to experiment with material. Before you do this, though, you need to be familiar with the website’s “terms of service,” or the legal documentation that outlines how users are allowed to use a website, resources, or software. In this case, LAC provides generous non-commercial reproduction terms: information “may be reproduced, in part or in whole, and by any means, without charge or further permission, unless otherwise specified.”[51]
The CDC web archive index is organized like so: the index is located at www.epe.lac-bac.gc.ca/100/205/301/ic/cdc/E/Alphabet.asp, with every subsequent website branching off the /cdc/ folder. For example, one website would be hosted in www.epe.lac-bac.gc.ca/100/205/301/ic/cdc/ABbenevolat, the next in …/cdc/abnature/ and so on. Using wget, a free software program, you can download all websites in a certain structure; the program recursively downloads information in a methodical fashion. I first used wget to save the cookies (little files kept on your system, in this case one that noted that you had seen the disclaimer about the archival nature of the website), and then with an one-line command in my command line to download the entire database.[52] Due to the imposition of a random wait and bandwidth limit, which meant that I would download one file every half to one and a half seconds, at a maximum of 30 kilobytes a second, the process took six days. In the Programming Historian 2, I have an article expanding upon wget for humanities researchers.
Hypertext itself deserves a brief discussion. The basic building block of the web is the link: one page is connected to another, and people navigate through these webs. While books and articles, for example, are connected to each other by virtue of ideas and concrete citations, these must often be inferred online. HTML born-digital sources are different in that the link offers a very concrete file. One quick visualization, the circular cluster seen above, lets us see the unique nature of this information. We can go to each web page, scrape the links, and see where they take viewers. As we see in the below figure, the CDC collection can be visualized as a series of hyperlinks (each line). The cluster in the middle is the CDC collection itself, whereas the strands on the outside represent external websites. Using Mathematica, I have generated a dynamic model: you can move your mouse over each line, learn what link it is, and thus see where the collection fits into the broader Internet. The site is limited to following two links beyond the first page. Through this approach, we see the interconnection of knowledge and relationships between different sources. At a glimpse, we can see suggestions to follow other sites and determine if any nodes are shared amongst the various websites revealed.
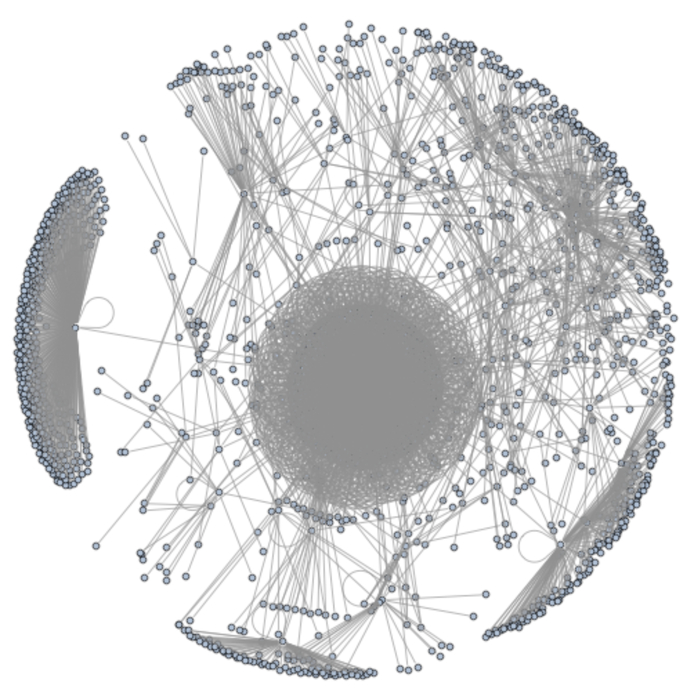
Visualizing the CDC Collection as a Series of Hyperlinks
Visualization: Moving Beyond Word Clouds
Where to begin with a large collection such as the Canada’s Digital Collection corpus? As a historian who is primarily interested in the written word, my first step was to isolate the plaintext throughout the material so that I could begin rudimentary data mining and textual analysis on the corpus. For this, I approached the CDC collection on two distinct levels — first, the aggregate collection and, second, dividing the collection into each ‘file’ or individual website — deriving word and phrase data for each. Imagine if you could look through into an archival collection and get a quick sense of what topics and ideas were covered. Taking that thought further, imagine the utility if you could do this with individual archival boxes and even files. With a plethora of born-digital sources, this is now a necessary step.
On an aggregate level, word and phrase data is a way to explore the information within. How often do various words within the nearly eight million words of the collection appear? Using Mathematica, we can quickly generate a list of words, sorted by their relative frequency; we learn that the word “Canada” appears 26,429 times, “collections,” 11,436, and “[L]ouisbourg” an astounding 9,365 times. Reading such a list can quickly wear out a reader and is of minimal visual attractiveness. Two quick decisions were made to enhance data usability: first, the information was “case-folded,” all sent to lower-case; this enables us to count the total appearances of a word such as “digital,” regardless of whether or not it appears at the beginning of a sentence.
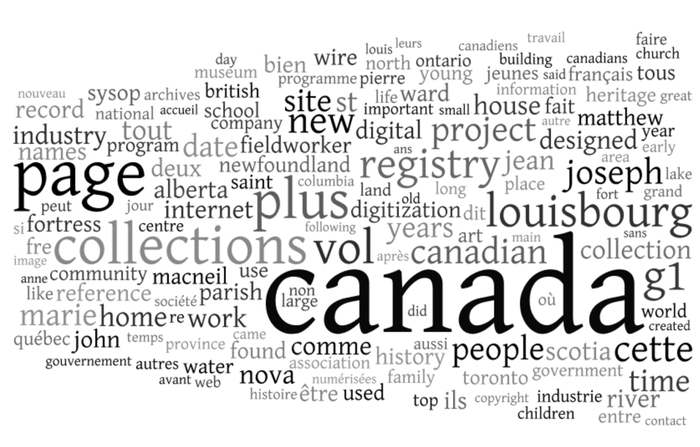
A Word Cloud of All Words in the CDC Corpus
Second, when dealing with word frequency — as opposed to phrase frequency — “stop words” should be removed, as they were here. These are “extremely common words which would appear to be of little value in helping select documents matching a user need,” words such as “the,” “and,” “to,” and so forth. They matter for phrases (the example “to be or not to be” is comprised entirely of stop words), but will quickly dominate any word-level visualization or list.[53] Other words may need to be added or removed from stop lists depending on the corpus; for example, if the phrase “page number” appeared on every page, that would be useless information for the researcher.
The first step, then, is to use Mathematica to format word frequency information into Wordle.net readable format (if we put all of the text into that website, it will crash — so we need to follow the instructions on that website); we can then draw up a word cloud of the entire collection. Here we can see both the advantages and disadvantages of static word clouds. What can we learn from this illustration? First, without knowing anything about the sites, we can immediately learn that it is dealing with Canada/Canadians, that it is a collection with documents in French and English, that we are dealing with digitized collections, and that there is a fair amount of regional representation not based upon population (note that “ontario” is less frequent than both “newfoundland,” “nova scotia,” and “alberta,” although “québec” and “quebec” is not terribly prominent). Certain kinds of history dominate: communities, family names, the built form (houses, churches, schools, and so forth). At a very macro level, we can learn several characteristics before doing any deeper investigation.
These forms of visualization need to be used with extreme caution, however. First, while visually attractive, it leaves a severe amount of ambiguity: are “ontario” and “québec” equally prominent, for example, or is there a slight divergence? Even more problematically, we cannot learn context from the above picture: does the word “school” refer to built structures, or educational experiences? The same question with applies to “church.” Do mentions of “newfoundland” refer to historical experiences there, or with expatriates, or in travel narratives? Word clouds are useful first steps and have their place, but need to be used with extreme caution. For more scholarly applications, tables offer much more precise interpretation. As the second figure below demonstrates, they can be more helpful when dealing with the individual sites, cutting through ambiguity. The figure, below, is a visualization of the website “past and present.” Despite the ambiguous title, we can quickly learn what this website contains from this visualization. Wordle is thus a useful first step, analogous to taking magically taking a quick look through the side of an archival box. We still need more information, however, to really make this form of textual analysis helpful. To navigate this problem, I have created my own dynamic finding aid program using Mathematica, which scales to any born-digital web collection.

Word Cloud of the File “Past and Present”
Two approaches were taken. First, a textual representation of word and phrase frequency allows us to determine the content of a given file relatively quickly. I wrote a short program to extract word frequency (stop words excluded) and phrase frequency. For phrases, we speak of n-grams: bigrams, trigrams, quadgrams, and fivegrams, although one could theoretically do any higher number. A bigram can be a combination of two characters, such as ‘bi,’ two syllables, or — pertinent in our case — two words. An example: “canada is.” A trigram is three words, quadgram is four words, and a fivegram is five words, and so on.
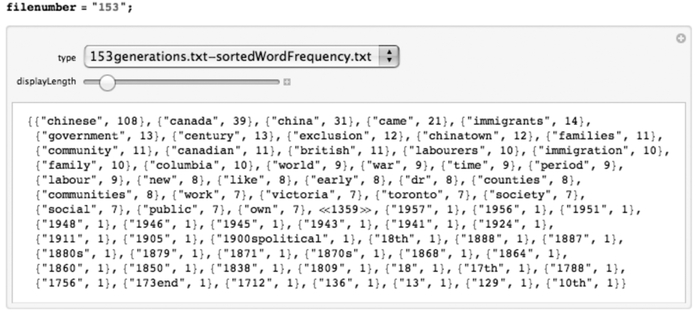
A viewer for n-grams in the CDC Collection
The CDC collection demonstrates this approach’s utility. Using my Mathematica textual CDC browser, pictured above, I randomly explored file 267: the ambiguously named “past and present” website. This is one of the largest individual websites: 122,363 words, or about 493 standard typed pages. Such an ambiguous name could be about almost anything. Initially, I decided to study word frequency:
{“{“alberta”, 758}”, “{“listen”, 490}”, “{“settlers”, 467}”, “{“new”, 454}”, “{“canada”, 388}”, “{“land”, 362}”, “{“read”, 328}”, “{“people”, 295}”, “{“settlement”, 276}”, “{“chinese”, 268}”, “{“canadian”, 264}”, “{“place”, 255}”, “{“heritage”, 254}”, “{“edmonton”, 250}”, “{“years”, 238}”, “{“west”, 236}”, “{“raymond”, 218}”, “{“ukrainian”, 216}”, “{“came”, 213}”, “{“calgary”, 209}”, “{“names”, 206}”, “{“ranch”, 204}”, “{“updated”, 193}”, “{“history”, 190}”, “{“communities”, 183}” …
Rather than having to visit the website, at a glance, we can almost immediately see what the site is about. More topics become apparent when one looks at trigrams, for example, in this automatically generated output of generated top phrases:
{“{{“first”, “people”, “settlers”}, 100}”, “{{“the”, “united”, “states”}, 72}”, “{{“one”, “of”, “the”}, 59}”, “{{“of”, “the”, “west”}, 58}”, “{{“settlers”, “last”, “updated”}, 56}”, “{{“people”, “settlers”, “last”}, 56}”, “{{“albertans”, “first”, “people”}, 56}”, “{{“adventurous”, “albertans”, “first”}, 56}”, “{{“the”, “bar”, “u”}, 55}”, “{{“opening”, “of”, “the”}, 54}”, “{{“communities”, “adventurous”, “albertans”}, 54}”, “{{“new”, “communities”, “adventurous”}, 54}”, “{{“bar”, “u”, “ranch”}, 53}”, “{{“listen”, “to”, “the”}, 52}” …
Through a few clicks, we can navigate and determine the basic contours — from a distance — of what the site pertains to. In a viewer, you can use a slider to dynamically see more information or less information, quickly toggling between bigrams, trigrams, and quadgrams, allowing you to quickly hone in on immediately relevant information. This can be useful, but we need to move back even further to achieve a distant reading of this born-digital collection.
If one zooms back out to this very distant level, we can extract n-gram data from the entire collection. We have two approaches: first, aggregate appearances of a given term (if “aboriginal” appears 457 times, then n=457), or, second, relative appearances of a given term (if “aboriginal” appears in 45 of 384 sites, then n=45/384 or 0.1171875). In my other work on music lyrics, the latter option enables you to control for the ‘chorus’ effect, as the former can be drowned out by one song with repetitive words. Given the nature of this collection, I elected for the former approach. What can we learn from trigrams, for example? After an initial set of trigrams pertaining to the Louisbourg digitization project, which has boilerplate language on each page, as well as common “stopword” equivalents of phrases (especially pronounced in French), we come across the first set of meaningful phrases, excerpted below:
{{“experience”, “in”, “the”}, 919}, {{“transferred”, “to”, “the”}, 918}, {{“funded”, “by”, “the”}, 918}, {{“of”, “the”, “provincial”}, 915}, {{“this”, “web”, “site”}, 915}, {{“409,”, “registry”, “2,”}, 914}, {{“are”, “no”, “longer”}, 914}, {{“gouvernement”, “du”, “canada”}, 910}, . . ., {{“use”, “this”, “link”}, 887}, {{“page”, “or”, “you”}, 887}, {{“following”, “page”, “or”}, 887}, {{“automatically”, “transferred”, “to”}, 887}, {{“be”, “automatically”, “transferred”}, 887}, {{“will”, “be”, “automatically”}, 887}, {{“industry.”, “you”, “will”}, 887}, {{“multimedia”, “industry.”, “you”}, 887}, {{“practical”, “experience”, “in”}, 887}, {{“gained”, “practical”, “experience”}, 887}, {{“they”, “gained”, “practical”}, 887}, {{“while”, “they”, “gained”}, 887}, {{“canadians”, “while”, “they”}, 887}, {{“young”, “canadians”, “while”}, 887}, {{“showcase”, “of”, “work”}, 887}, {{“excellent”, “showcase”, “of”}, 887} …
Here we see an array of common language: funding information, link information, project information, spread across over 887 websites. Reading down, we see information about governments, job experience, project information, initiatives, re-structuring, and so forth. At a glance, we can see what language is common to all websites, as opposed to unique information. Moving down, we find the more common but less universal: “the history of,” for example, “heritage community foundation,” libraries, and so forth. By the end of the list, we can move into the unique or very rare: phrases that appear only once, twice, or three times.
Moving beyond word and phrase frequency, there are a few more sophisticated off-the-shelf options that can help us make sense of large arrays of unstructured data. Topic modeling is among the most developed, as Princeton’s David M. Blei (a Computer Science professor) describes in a general introduction to the topic:
While more and more texts are available online, we simply do not have the human power to read and study them to provide the kind of [traditional] browsing experience described above. To this end, machine learning researchers have developed probabilistic topic modeling, a suite of algorithms that aim to discover and annotate large archives of documents with thematic information. Topic modeling algorithms are statistical methods that analyze the words of the original texts to discover the themes that run through them, how those themes are connected to each other, and how they change over time .… Topic modeling enables us to organize and summarize electronic archives at a scale that would be impossible by human annotation.[55]
Using the aforementioned SEASR Meandre workbench (or via MALLET itself and a command-line interface), we can quickly begin to run our born-digital information through the topic-modeling algorithm. The results are notable, and come in two formats: a word cloud visualization as well as an XML file containing a line-by-line breakdown of each topic. Taking the aforementioned file, 267 (“past and present”) we can begin to get a sense of the topics this large website discusses:

At a glance, we can learn about some of the main themes: the structure of Alberta (Alberta, towns, bridges, lakes), the geographic shape of the area (life, land, lands, areas, links, grass, and interestingly, language), the stories (story, knight, archives, but also, interestingly, knight and wife), and so forth. The word cloud gives us a sense of the most relevant terms that define each topic, but we also have a 3,200-line XML file, broken into topics, which lets us further refine our inquiry.
A last set of examples will help us move from the aggregate level of hundreds of thousands of lines of text to the individual line: in essence, creating our own search engine to navigate this collection.
There are a few good reasons why we should not use Google to do all of this in our own work. First, we do not know how Google works precisely. It is a proprietary black box. While the original algorithm is available, the actual methods that go into determining the ranking of search terms is a trade secret. Second, Google is optimized for a number of uses, mainly to deliver the most relevant information to the user. Historians and archivists are looking often for specific information within old websites, and it behooves us to examine them through the lens of more specialized tools. With these hesitations in mind, I have sought to develop my own rudimentary search engine for this born-digital collection.

A snapshot of the dynamic finding aid tool
A two-pronged approach can take us to relevant information quickly. In the following example, I am carrying out a project on black history. We quickly search all of the CDC word frequency files for the occurrence of the word “freedom,” “black,” and “liberty” (these terms, of course, require some background knowledge; the search is shaped by the user), obtain a list, and then map it onto a chart in order to quickly visualize their locations in the collection. For example, in the graph above, we see a visualization of a given term, in this case our three search terms. As one moves the mouse over each bar, the frequency data for a given term appears. We can also zoom and enhance this graph to use it as we wish. A demonstration of this can be found online at www.ianmilligan.ca/2013/01/18/cdc-tool-1.
We can then move down into the data. In the example above, “047,” labeled “blackgold.txt,” contains 31 occurrences of the word “ontario.” Moving to my Mathematica keyword-in-context routine, we can see where these occurrences of the word appear:
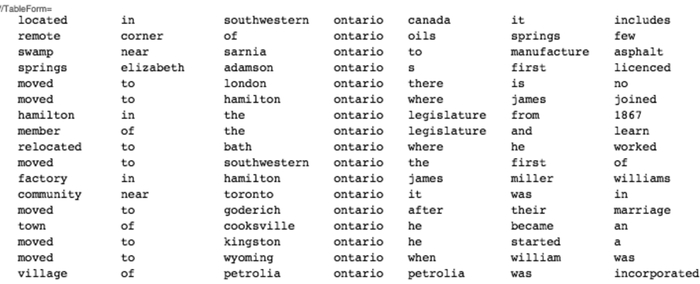
We see that this website focuses mostly on southwestern Ontario, where many oil fields are. If we move forward, we can see that it pertains to the nineteenth century, a particular region, as well as subsequent memorialization activities (mention of a museum, for example). All this can be done from within the textual client, as opposed to going out into individual websites. Broad contours emerge from this distant reading, but they also facilitate deeper reading by allowing us to promptly realize critical sources.
Another model through which we can visualize documents is through a viewer, primarily focusing on term document frequency and inverse frequency, terms discussed below. To prepare this material, we are combining our earlier data about word frequency (that the word “experience” appears 919 times, perhaps) with aggregate information about frequency in the entire corpus (i.e., the word “experience” appears 1,766 times). The number of times that a term appears in a given website can be defined as tf (term frequency). Another opportunity is inverse document frequency, where we can learn what words are most distinct and unique in a given document. The formula for this is the oft-cited tf-idf, a staple of information retrieval theory, or tf times the logarithm of the number of documents divided into the number of documents where the given term appears. At a glance, then, we can see some of the unique words contained within a website, if we select “inverse document frequency”:
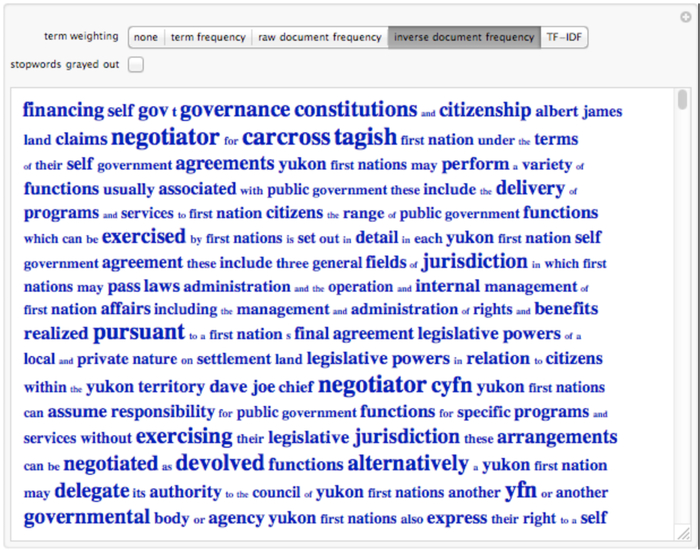
At a very quick glance, one can see the major words that make this a unique document. This technique can be used on any textual document.
Off-the-shelf tools can facilitate a deeper yet distant reading of individual websites as well, especially the suite of research tools on websites such as Many Eyes and Voyant. Using these tools, however, requires that one puts individual data into each separate program, rather than quickly navigating between them. This stems from the massive amount of files and data involved: Many Eyes limits files to 5MB, and Voyant has no hard and fast rule but can struggle with larger files.
This analysis was carried out on my personal computer.[55] Larger data sets may necessitate a corresponding increase in computational power, bringing social sciences and humanities researchers into contact with High Performance Computing (HPC) centres or consortia. These extremely powerful computers provide researchers with computing power orders of magnitude above that of personal computers, allowing results in hours instead of the weeks or months it might take to process on a smaller system.[56] This has particular application in the basic processing of a very large web archive. There are limitations, however: jobs must be submitted into queues in advance rather than on-site processing, and perhaps most importantly, HPC centres prefer to run highly optimized code to minimize usage of their very expensive and scarcely allocated equipment. As this level of coding expertise is often beyond humanities researchers, research teams must be formed.
Humanities researchers would do well to familiarize themselves with local HPC options, many of which are more than happy to work on new and engaging questions. These are accessible options; in Ontario, for example, all but one university belongs to a HPC consortium.[57] Yet as personal computing continues to dramatically increase in speed and as storage prices continue to plummet, textual analysis is increasingly feasible on high-quality office systems. An initial exposure can generate questions and problems that, if the need rears itself, can subsequently be taken to the supercomputer.
This case study is intended to provide one model for distant reading and the generation of finding aids, in the interest of showing some of the potential for working with born-digital sources. It is intended to begin or jumpstart a conversation around the resources and skills necessary for the next generation. A seemingly insurmountable amount of information, contained across over 73,000 files (as in the CDC collection), can be quickly navigated and isolated for researcher convenience.
Conclusion: Digital Literacy for the Next Generation of Historians
As a discipline, I would like to suggest one path forward: prepare the next generation of historians, at least some of them, to deal with the deluge of born-digital sources. Fundamentally, the challenge of born-digital sources is a pedagogical one. For existing historians, this is an issue of continual education; for future historians, an issue of professional training (the annual Digital Humanities Summer Institute, held at the University of Victoria each June, is worth considering as an introduction to many digital concepts). Some off-the-shelf tools can serve as gateways to deeper engagement: notably the Voyant Tools suite (www.voyant-tools.org/), and perhaps subsequently the lessons contained in the Programming Historian 2. That said, digital literacy courses should become part of the essential pantheon of historical curricula. This should not be mandatory, but instead taught alongside and within traditional historiography and research methods courses. In an era of diminishing resources and attention paid to knowledge translation and relevancy, digital literacy courses are also well positioned to provide graduates with concrete portfolios and actionable skills. If we want to be prepared to use digital methodologies to study the post-1990 world, we will need ready historians.
Such a course should have six basic priorities. First, we must provide historiographical context for new students on what computational methods have been tried before. How have quantitative and qualitative methods differed yet ultimately complemented each other? Second, students in this course would need to develop an understanding of the digital basics: cloud computing, effective backup and versioning, digital security, and an understanding of how the Internet is organized. Third, for effective cross-departmental and sustained engagement with digital history, students must to learn how to digitally navigate conventional sources: notable skill sets would include a familiarity with citation management software, databases, and the possibility of using optical character recognition on a variety of born-paper sources subsequently digitized through scanners or cameras. This must also include a grasp of the scope and significance of large digital depositories, including Google Books, the Internet Archive, and others mentioned earlier. Fourth, students must learn how to process large amounts of digital information; this includes off-the-shelf visualization tools, material discussed here, and some of the philosophical and methodological implications of a distance reading. Fifth, students can learn basic programming through the Programming Historian. Finally, and perhaps most importantly, students need an understanding of various ways to openly disseminate material on the web: whether through blogging, micro-blogging, publishing webpages, and so forth; it is important to enable the great work that we do in the university to make its mark on the world. Through this, students will also come away from history departments with comprehensive and marketable digital portfolios. Such a course would focus more on homework than reading, with special emphasis placed on deliverable content such as websites, interactive models, and broadly implementable databases.
Digital history and the readiness to work with born-digital sources cannot stem out of pedagogy alone, however. Institutional support is necessary. While based on anecdotal evidence, it appears that some university administrators have begun to embrace the shift towards the digital humanities. At the federal level, SSHRC has identified the Digital Economy as one of its priority areas.[58] Yet when it comes to evaluation, doctoral and post-doctoral researchers do not have a “digital humanities” option open to them in terms of assessing committees, leading to fears that their projects might be lost in between disciplinary areas of focus.[59] In light of the impending crisis of born-digital sources, historians should encourage these initiatives.
These sorts of digital projects do not always lend themselves well to traditional publication venues. The examples above from the CDC case study, for example, are best viewed as dynamically malleable models; this will be one challenge as historians grapple with new publication models. This article argues first, why digital methodologies are necessary, and second, how we can realize aspects of this call. The Internet is 20 years old, and before historians realize it, we will be faced with the crisis of born-digital information overload. If history is to continue as the leading discipline in understanding the social and cultural past, decisive movement towards the digital humanities is necessary. When the sea comes in, we must be ready to swim.
Parties annexes
Acknowledgements
My sincerest thanks to William Turkel, who sent me down the programming rabbit hole. Thanks also to Jennifer Bleakney, Thomas Peace, and the anonymous peer reviewers for their suggestions and assistance. Financial support was generously provided by the Social Sciences and Humanities Research Council of Canada.
Biographical note
Ian Milligan is an assistant professor of Canadian history at the University of Waterloo. He is a founding co-editor of ActiveHistory.ca, an editor-at-large of the Programming Historian 2, and has written several articles in the fields of Canadian youth, digital, and labour history.
Notes
-
[1]
The question of when the past becomes a “history” to be professionally studied is a tricky one. Yet, it is worth noting that the still-definitive work on the Baby Boom Generation appeared in 1996 with Doug Owram, Born at the Right Time: A History of the Baby Boom Generation in Canada (Toronto: University of Toronto Press, 1996). This actually followed the earlier scholarly monograph, Cyril Levitt, Children of Privilege: Student Revolt in the Sixties (Toronto: University of Toronto Press, 1984), and a host of other laudable works. As academic debates/works on the 1960s now suggest the past becomes history sooner than we often expect.
-
[2]
A critical point advanced in the field of literary criticism and theory by Stephen Ramsay, Reading Machines: Towards an Algorithmic Criticism (Urbana: University of Illinois Press, 2011).
-
[3]
See “#IdleNoMore Timeline,” ongoing, www.idlenomore.makook.ca/timeline#44, <viewed 18 January 2013>.
-
[4]
These issues have been discussed elsewhere, albeit in either a more abridged form or with a focus on digitized historical sources. A notable exception is Daniel J. Cohen and Roy Rosenzweig, Digital History: A Guide to Gathering, Preserving, and Presenting the Past on the Web (Philadelphia: University of Pennsylvania Press, 2005), specifically their chapter on “Collecting History online.” Their focus is on the preservationist and archival challenges, however. Important notes are also found in Dan Cohen, “History and the Second Decade of the Web,” Rethinking History, 8, no. 2 (June 2004): 293–301, also available online at www.chnm.gmu.edu/essays-on-history-new-media/essays/?essayid=34.
-
[5]
Figure taken from Jose Martinez, “Twitter CEO Dick Costolo Reveals Staggering Number of Tweets Per Day,” ComplexTech, www.complex.com/tech/2012/10/twitter-ceo-dick-costolo-reveals-staggering-number-of-tweets-per-day, <viewed 6 January 2013>. Furthermore, while a tweet itself is only 140 characters, every tweet comes with over 40 lines of metadata: date information, author biography and location information, when the account was created, the users’ following and follower numbers, country data, and so forth. This is a remarkable treasure trove of information for future historians, but also a potential source of information overload. See Sarah Perez, “This is What a Tweet Looks Like,” ReadWriteWeb (19 April 2010), www.readwriteweb.com/archives/this_is_what_a_tweet_looks_like.php, <viewed 6 January 2013>.
-
[6]
This is further discussed in Ian Foster, “How Computation Changes Research,” in Switching Codes: Thinking Through Digital Technology in the Humanities and the Arts, eds., Thomas Bartscherer and Roderick Coover (Chicago: University of Chicago Press, 2011), esp. 22–4.
-
[7]
Franco Moretti, Graphs, Maps, Trees: Abstract Models for Literary History (New York: Verso, 2005), 3–4.
-
[8]
While not of prime focus here, the longue durée deserves definition. It stands opposite the history of events, of instances, covering instead a very long time span in an interdisciplinary social science framework. In a long essay, Braudel noted that one can then see both structural crises of economies, and structures that constrain human society and development. For more, see Fernand Braudel, “History and the Social Sciences: The Longue Durée” in Fernand Braudel, On History, trans. Sarah Matthews (Chicago: University of Chicago Press, 1980), 27. The essay was originally printed in the Annales E.S.C. no. 4 (October–December 1958).
-
[9]
A great overview can be found at “Text Analysis,” Tooling Up for Digital Humanities, 2011, www.toolingup.stanford.edu/?page_id=981, <viewed 19 December 2012>.
-
[10]
Jean-Baptiste Michel, Yuan Kui Shen, Aviva Presser Aiden, Adrian Veres, Matthew K. Gray, The Google Books Team, Joseph P. Pickett, Dale Hoiberg, Dan Clancy, Peter Norvig, Jon Orwant, Steven Pinker, Martin A. Nowak, Erez Lieberman Aiden, “Quantitative Analysis of Culture Using Millions of Digitized Books,” Science 331 (14 January 2011): 176–82. The tool is publicly accessible at “Google Books Ngram Viewer,” Google Books, 2010, www.books.google.com/ngrams, <viewed 11 January 2013>.
-
[11]
Anthony Grafton, “Loneliness and Freedom,” Perspectives on History [online edition] (March 2011), www.historians.org/perspectives/issues/2011/1103/1103pre1.cfm, <viewed11. January 2013>.
-
[12]
Comment by Jean-Baptiste Michel and Erez Lieberman Aiden on Anthony Grafton, “Loneliness and Freedom,” Perspectives on History [online edition] (March 2011), www.historians.org/perspectives/issues/2011/1103/1103pre1.cfm, <viewed 11 January 2013>.
-
[13]
For more information, see the Canadian Century Research Infrastructure Project website at www.ccri.uottawa.ca/CCRI/Home.html and the Programme de recherche en démographie historique at www.geneology.umontreal.ca/fr/leprdh.htm.
-
[14]
“With Criminal Intent,” CriminalIntent.org, www.criminalintent.org, <viewed 20 December 2012>.
-
[15]
For an overview, see “Award Recipients — 2011,” Digging into Data Webpage, www.diggingintodata.org/Home/AwardRecipients2011/tabid/185/Default.aspx, <viewed 20 December 2012>.
-
[16]
One can do no better than the completely free Programming Historian, which uses entirely free and open-source programming tools, to learn the basics of computational history. See The Programming Historian 2, 2012-Present, www.programminghistorian.org/, <viewed 11 January 2013>.
-
[17]
Michael Katz, The People of Hamilton, Canada West: Family and Class in a Mid-Nineteenth-Century City (Cambridge, MA: Harvard University Press, 1975). Also see A. Gordon Darroch and Michael D. Ornstein, “Ethnicity and Occupational Structure in Canada in 1871: The Vertical Mosaic in Historical Perspective,” Canadian Historical Review 61, no. 3 (1980): 305–33.
-
[18]
Ian Anderson, “History and Computing,” Making History: The Changing Face of the Profession in Britain, 2008, www.history.ac.uk/makinghistory/resources/articles/history_and_computing.html, <viewed 20 December 2012>.
-
[19]
Christopher Collins, “Text and Document Visualization,” The Humanities and Technology Camp, Greater Toronto Area, Visualization Bootcamp. University of Ontario Institute of Technology, Oshawa Ont., 21 October 2011.
-
[20]
The quotations by Luther and Poe are commonly used to make this point. For the best example, see Clay Shirky, Cognitive Surplus: Creativity and Generosity in a Connected Age. Google eBook. Penguin, 2010. For Mumford, see Lewis Mumford, The Myth of the Machine, vol. 2, The Pentagon of Power (New York: Harcourt, Brace, 1970), 182, as quoted in Gleick, The Information: A History, A Theory, A Flood (New York: Pantheon, 2011), 404.
-
[21]
Adam Ostrow, “Cisco CRS-3: Download Library of Congress in Just Over One Second,” Mashable (9 March 2010), accessed online www.mashable.com/2010/03/09/cisco-crs-3/.
-
[22]
A note on data size is necessary. The basic unit of information is a “byte” (8 bits), which is roughly a single character. A kilobyte (KB) is a thousand bytes, a megabyte (MB) a million, a gigabyte (GB) a billion, a terabyte (TB) a trillion, and a petabyte (PB) a quadrillion. Beyond this, there are exabytes (EB), zettabytes (ZB), and yottabytes (YB).
-
[23]
These figures can, of course, vary depending on compression methods chosen. Their math was based on an average of 8MB per book, if it was scanned at 600dpi and then compressed. There are 26 million books in the Library of Congress. For more, see Mike Ashenfelder, “Transferring ‘Libraries of Congress’ of Data,” Library of Congress Digital Preservation Blog, 11 July 2011, www.blogs.loc.gov/digitalpreservation/2011/07/transferring-libraries-of-congress-of-data/, <viewed 11 January 2013>.
-
[24]
Gleick, 232.
-
[25]
“About the Library of Congress Web Archives,” Library of Congress Web Archiving FAQs. Undated, www.loc.gov/webarchiving/faq.html#faqs_02, <viewed 11 January 2013>.
-
[26]
“10,000,000,000,000,000 Bytes Archived!,” Internet Archive Blog,26. October 2012, www.blog.archive.org/2012/10/26/10000000000000000-bytes-archived/, <viewed 19 December 2012>.
-
[27]
Jean-Baptiste Michel, et al., 176–82. Published Online Ahead of Print, 16 December 2010, www.sciencemag.org/content/331/6014/176, <viewed 29 July 2011>. See also Scott Cleland, “Google’s Piracy Liability,” Forbes, 9 November 2011, www.forbes.com/sites/scottcleland/2011/11/09/googles-piracy-liability/, <viewed 11 January 2013>.
-
[28]
“Government of Canada Web Archive,” Library and Archives Canada, 17 October 2007, www.collectionscanada.gc.ca/webarchives/index-e.html, <viewed 11 January 2013>.
-
[29]
For background, see Bill Curry, “Visiting Library and Archives in Ottawa? Not Without an Appointment,” Globe and Mail, 1 May 2012, www.theglobeandmail.com/news/politics/ottawa-notebook/visiting-library-and-archives-in-ottawa-not-without-an-appointment/article2418960/, <viewed 22 May 2012> and the announcement “LAC Begins Implementation of New Approach to service Delivery,” Library and Archives Canada, February 2012, www.collectionscanada.gc.ca/whats-new/013-560-e.html, <viewed 22 May 2012>. For professional responses, see the “CHA’s comment on New Directions for Library and Archives Canada,” CHA Website, March 2012, www.cha-shc.ca/en/News_39/items/19.html, <viewed 19 December 2012> and “Save Library & Archives Canada,” Canadian Association of University Teachers, launched April/May 2012, www.savelibraryarchives.ca, <viewed 19 December 2012>.
-
[30]
Ian Milligan, “The Smokescreen of ‘Modernization’ at Library and Archives Canada,” ActiveHistory.ca, 22 May 2012, www.activehistory.ca/2012/05/the-smokescreen-of-modernization-at-library-and-archives-canada/, <viewed 19 December 2012>.
-
[31]
“Save LAC May 2012 Campaign Update,” SaveLibraryArchives.ca, May 2012, www.savelibraryarchives.ca/update-2012-05.aspx, <viewed 19 December 2012>.
-
[32]
The challenges and opportunities presented by such projects is extensively discussed in Daniel J. Cohen, “The Future of Preserving the Past,” CRM: The Journal of Heritage Stewardship 2, no. 2 (Summer 2005): 6–19, also available freely online at the Roy Rosenzweig Center for History and New Media, www.chnm.gmu.edu/essays-on-history-new-media/essays/?essayid=39. For more, see “September 11 Digital Archive: Saving the Histories of September 11, 2001,” Centre for History and New Media and American Social History Project / Center for Media and Learning, www.911digitalarchive.org/, <viewed 11 January 2013>; “Hurricane Digital Memory Bank: Collecting and Preserving the Stories of Katrina and Rita,” Center for History and New Media, www.hurricanearchive.org/, <viewed 11 January 2013>; and “#Occupy Archive: Archiving the Occupy Movements from 2011,” Centre for History and New Media, www.occupyarchive.org/, <viewed 11 January 2013>.
-
[33]
Daniel Cohen and Roy Rosenzweig, Digital History: A Guide to Gathering, Preserving, and Presenting the Past on the Web (Philadelphia: Temple University Press, 2005), chapter on “Preserving Digital History.” The chapter is available fully online at www.chnm.gmu.edu/digitalhistory/preserving/5.php, <viewed 19 December 2012>.
-
[34]
For an overview, see “Preserving Our Digital Heritage: The National Digital Information Infrastructure and Preservation Program 2010 Report, a Collaborative Initiative of the Library of Congress,” Digitalpreservation.gov, www.digitalpreservation.gov/multimedia/documents/NDIIPP2010Report_Post.pdf, <viewed 19 December 2012>.
-
[35]
Steve Meloan, “No Way to Run a Culture,” Wired, 13 February 1998, available online via the Internet Archive, www.web.archive.org/web/20000619001705/http://www.wired.com/news/culture/0,1284,10301,00.html, <viewed 19 December 2012>.
-
[36]
Some of this has been discussed in greater depth on my website. See the series beginning with Ian Milligan, “WARC Files: A Challenge for Historians, and Finding Needles in Haystacks,” ianmilligan.ca, 12 December 2012, www.ianmilligan.ca/2012/12/12/warc-files-a-challenge-for-historians-and-finding-needles-in-haystacks/, <viewed 20 December 2012>.
-
[37]
Unstructured data, as opposed to structured data, is important for historians but brings additional challenges. Some projects have produced structured data: novels marked up using XML encoding, for example, so one can immediately see place names, dates, character names, and so forth. This makes it much easier for a computer to read and understand.
-
[38]
See William Noblett, “Digitization: A Cautionary Tale,” New Review of Academic Librarianship 17 (2011): 3; Tobias Blanke, Michael Bryant, and Mark Hedges, “Ocropodium: Open Source OCR for Small-Scale Historical Archives,” Journal of Information Science 38, no. 1 (2012): 83; and Donald S. Macqueen, “Developing Methods for Very-Large-Scale Searches in Proquest Historical Newspapers Collections and Infotrac: The Times Digital Archive: The Case of Two Million versus Two Millions,” Journal of English Linguistics 32, no. 2 (June 2004): 127.
-
[39]
Elizabeth Krug, “Canada’s Digital Collections: Sharing the Canadian Identity on the Internet,” The Archivist [Library and Archives Canada publication], April 2000, www.collectionscanada.gc.ca/publications/archivistmagazine/015002-2170-e.html, <viewed 11 January 2013>.
-
[40]
“WayBackMachine Beta: www.collections.ic.gc.ca/,” Internet Archive, Available online, www.wayback.archive.org/web/*/http://collections.ic.gc.ca/, <viewed 11 January 2013>.
-
[41]
“Street Youth Go Online,” News Release from Industry Canada, Internet Archive, 15 November 1996, Available online, www.web.archive.org/web/20001011131150/http://info.ic.gc.ca/cmb/Welcomeic.nsf/ffc979db07de58e6852564e400603639/514a8d746a34803385256612004d90b3?OpenDocument <viewed 11 January 2013>.
-
[42]
Darlene Fichter, “Projects for Libraries and Archives,” Canada’s Digital Collection Webpage, 24 November 2000, through Internet Archive, www.web.archive.org/web/200012091312/http://collections.ic.gc.ca/E/cdc_proj.htm, <viewed 18 June 2012>.
-
[43]
“Canada’s Digital Collections homepage,” 21 November 2003, through Internet Archive, www.web.archive.org/web/20031121213939/http://collections.ic.gc.ca/E/index.php?vo=15, <viewed 18 June 2012>.
-
[44]
“Important news about Canada’s Digital Collections,” Canada’s Digital Collections Webpage, 18 November 2006>, through Internet Archive, www.web.archive.org/web/20061118125255/http://collections.ic.gc.ca/E/view.html, <viewed 18 June 2012>.
-
[45]
For more information, see the information at “Wolfram Mathematica 9,” Wolfram Research, www.wolfram.com/mathematica/, <viewed 11 January 2013>. An example of work in Mathematica can be seen in William J. Turkel’s demonstration of “Term Weighting with TF-IDF,” drawing on Old Bailey proceedings. It is available at www.demonstrations.wolfram.com/TermWeightingWithTFIDF/, <viewed 11 January 2013>.
-
[46]
It was 8 degrees Celsius at 5:00 p.m. on 18 December 1983; “Edith” was more popular than Emma until around 1910, and now “Emma” is the third most popular name in the United States for new births in 2010; the Canadian unemployment rate in March 1985 was 10.6 percent, 25th highest in the world; and the Canadian GDP in December 1995 was $603.9 billion per year, 10th largest in the world.
-
[47]
It was formerly known as “Voyeur Tools” before a 2011 name change. It is available online at www.voyant-tools.org/.
-
[48]
For more information, see “Software Environment for the Advancement of Scholarly Research (SEASR),” www.seasr.org/, <viewed 18 June 2012>.
-
[49]
The MALLET toolkit can also be run independently of SEASR. For more on topic modeling specifically, see “Topic Modeling,” MALLET: Machine Learning for Language Toolkit, www.mallet.cs.umass.edu/topics.php, <viewed 18 June 2012>.
-
[50]
For a good overview, see “Analytics: Dunning’s Log-Likelihood Statistic,” MONK: Metadata Offer New Knowledge, www.gautam.lis.illinois.edu/monkmiddleware/public/analytics/dunnings.html, <viewed 18 June 2012>.
-
[51]
“Important Notices,” Library and Archives Website, last updated 30 July 2010, www.collectionscanada.gc.ca/notices/index-e.html, <viewed 18 June 2012>. Historians will have to increasingly learn to navigate the Terms of Services (TOS) of born-digital source repositories. They can be usually found on index or splash pages, under headings as varied as “Terms of Service,” “Permissions,” “Important Notices,” or others.
-
[52]
The command was wget —m —-cookies=on —-keep-session-cookies —-load-cookies=cookie.txt —-referrer= http://epe.lac-bac.gc.ca/100/205/301/ic/cdc/census/default.htm — random-wait —wait=1 —limit-rate=30K http://epe.lac-bac.gc.ca/100/205/301/ic/cdc/E/Alphabet.asp. This loaded a previous cookie load, as there is a “splash redirect” page warning about dysfunctional archived content. It also imposed a random wait and bandwidth cap, to be a good netizen.
-
[53]
For a discussion of this, see Christopher D. Manning, Prabhakar Raghavan, Hinrich Scütze, An Introduction to Information Retrieval (Cambridge, UK: Cambridge University Press, 2009), 27–8. Available online at www.nlp.stanford.edu/IR-book/.
-
[54]
David M. Blei, “Introduction to Probabilistic Topic Models,” www.cs.princeton.edu/~blei/papers/Blei2011.pdf, <viewed 18 June 2012>.
-
[55]
The research was actually carried out on a rather dated late 2007 MacBook Pro.
-
[56]
See John Bonnett, “High-Performance Computing: An Agenda for the Social Sciences and the Humanities in Canada,” Digital Studies 1, no. 2 (2009), www.sharcnet.ca/Documents/HHPC/hpcdh.html, <viewed 18 December 2012> and John Bonnett, Geoffrey Rockwell, and Kyle Kuchmey, “High Performance Computing in the arts and Humanities,” SHARCNET: Shared Hierarchical Academic Research Computing Network, 2006, www.sharcnet.ca/Documents/HHPC/hpcdh.html, <viewed 18 December 2012>.
-
[57]
“SHARCNET: History of SHARCNET,” SHARCNET, 2009, www.sharcnet.ca/my/about/history, <viewed 18 December 2012>.
-
[58]
“Priority Areas,” SSHRC, last modified 4 November 2011, www.sshrc-crsh.gc.ca/funding-financement/programs-programmes/priority_areas-domaines_prioritaires/index-eng.aspx, <viewed 18 June 2012>.
-
[59]
Eloquently discussed in Adam Crymble, “Is Digital Humanities a Field of Research?” Thoughts on Digital & Public History, 11 August 2011 www.adamcrymble.blogspot.com/2011/08/is-digital-humanities-field-of-research.html, <viewed 18 June 2012>.
Parties annexes
Note biographique
Ian Milligan est professeur adjoint en histoire canadienne à la University of Waterloo. Il est le fondateur et codirecteur du site Internet ActiveHistory.ca ainsi qu’un éditeur du site Programming Historian 2. Il a écrit plusieurs articles au sujet de la jeunesse canadienne, de la numérisation et de l’histoire des travailleurs.
Liste des figures
Holdings Size (in TBs)
Visualizing the CDC Collection as a Series of Hyperlinks
A Word Cloud of All Words in the CDC Corpus
Word Cloud of the File “Past and Present”
A viewer for n-grams in the CDC Collection
A snapshot of the dynamic finding aid tool