Abstracts
Abstract
Optical dating is a well-established method that is used to determine the time elapsed since quartz or feldspar grains were last exposed to sunlight, which usually dates the time elapsed since their burial in a sedimentary deposit. Only a few seconds of direct sunlight are needed to reset the “mineral clock”, making the method ideal for dating the formation of eolian landforms. In this paper we describe how we use violet luminescence that is emitted in response to near-infrared excitation of sand-sized K-feldspar grains to date the time of formation of eolian dunes on the Canadian prairies. Using the multiple-aliquot with thermal transfer correction method, together with a test for sufficient sunlight exposure, and a correction for anomalous fading, we are able to produce accurate optical ages ranging from 150 years to more than 11 ka with precision usually better than 10 % at 2σ. Ages are given for dunes in the Dundurn and Elbow sand hills of south-central Saskatchewan, the climatic significance of which is provided in a paper also in the present volume. Knowledge of when the dunes were stable, and when they were not, is used to help understand the nature and timing of Holocene climate change in the area.
Résumé
La datation optique est une méthode reconnue employée pour déterminer le temps écoulé depuis que des grains de quartz ou de feldspath potassique ont été pour la dernière fois exposés à la lumière du soleil, ce qui correspond généralement au temps écoulé depuis leur enfouissement dans un dépôt sédimentaire. Quelques secondes seulement de lumière du soleil directe suffisent pour remettre à zéro « l’horloge minérale », ce qui en fait une méthode parfaitement appropriée pour dater la formation de dépôts éoliens. Nous décrivons ici comment utiliser la luminescence violette émise en réponse à une excitation à l’infrarouge des grains de feldspath de la taille du sable pour dater la formation des dunes dans les Prairies. Grâce à la méthode des portions aliquotes multiples comprenant une correction pour le transfert thermique, ainsi qu’un test d’exposition suffisante au soleil et une correction pour la décroissance anormale, nous pouvons obtenir des âges optiques précis à partir de 150 ans jusqu’à plus 11 ka avec une précision généralement supérieure à 10 % à 2σ. Les âges proviennent des dunes des collines Dundurn et Elbow, dans le centre sud de la Saskatchewan ; leur signification au plan climatique est donnée dans un autre article du présent numéro. La connaissance des périodes de stabilité des dunes sert à comprendre la nature et le synchronisme des changements climatiques survenus dans la région, au cours de l’Holocène
Resumen
La datación óptica es un método conocido que se emplea para determinar el tiempo transcurrido desde que los granos de cuarzo y feldespato fueron expuestos a la luz del sol, este proceso generalmente refleja el tiempo transcurrido durante el cual los sedimentos terminan por ser sepultados. Unos pocos segundos de exposición a la luz del sol bastan para poner en marcha el “reloj mineral”, esta característica permite desarrollar un método ideal para establecer la edad de formaciones eólicas del paisaje. Este manuscrito describe la manera en que se utilizó la emisión de luminiscencia violeta en respuesta a la excitación dentro del rango del infrarrojo cercano sobre granos de arena de feldespato potásico para datar el tiempo de formación eólica de las dunas en las praderas canadienses. Gracias a la combinación del método de múltiples alícuotas con corrección de transferencia térmica, junto con una prueba de exposición solar suficiente y una corrección de decoloración anómala, fuimos capaces de producir una datación óptica adecuada que sitúa dentro del rango de 150 años a mas de 11 000 anteriores al presente, con una precisión generalmente mayor al 10 % a 2σ. Las edades corresponden a las dunas en la colinas de arena de la región de Dundurn y Elbow en la zona centro sur de Saskatchewan; el significado climático de estos datos se discute en otra publicación en este mismo número. El conocimiento de la alternancia de periodos de estabilidad e inestabilidad de las dunas permite comprender la naturaleza y el sincronismo de los cambios climáticos ocurridos en la región durante el Holoceno.
Article body
Introduction
In the prairies of Alberta, Saskatchewan and Manitoba there are over 120 sand dune fields that together serve as important indicators of past climate change. During a prolonged period of drought, sand dunes may become destabilized and their activity may increase dramatically. Knowledge of when sand dune activity occurred is therefore crucial for developing models of past climate change, which can in turn be used to predict future drought events.
Optical dating determines the time elapsed since mineral grains, typically quartz and feldspar, were last exposed to sunlight. In most cases an optical age gives the time of last burial of a sedimentary unit. In the context of an eolian landform, while times of dune stability can be determined through radiocarbon dating of paleosols, episodes of extensive eolian activity can only be established by optical dating of dune sands. Moreover, since much of the dune formation in the Canadian prairies occurred in the late Holocene (e.g., David et al., 1999; Wolfe et al., 2001), it is necessary to be able to resolve discrete periods of dune activity within time windows of less than 100 years. In this paper we explain the basic principles behind luminescence dating and outline the methods used to date eolian activity in the Dundurn and Elbow sand hills. Research conducted at these two sites is part of ongoing investigations into the chronology of past dune activity in the Canadian prairies (see Wolfe et al., this volume). This paper is intended for a general geoscience audience that might be unfamiliar with the basic principles of the optical dating; the reader is guided to appropriate references where additional information can be acquired.
Luminescence Dating
Luminescence dating, which comprises both optical and thermoluminescence (TL) dating, is based on the fact that natural crystals (minerals) contain defects that act as traps for free electrons, that is, electrons that are not bound to an atom. If a mineral is exposed to sufficient sunlight or heat, some of these traps will be emptied of electrons; when sunlight is the cause of electrons being evicted it is usually said that the sample is being “bleached”. Free electrons are produced when radiation emitted during the decay of radioisotopes in the sedimentary deposit interacts with matter. The rate at which free electrons are produced, and traps are filled, is proportional to the amount of radioactive elements in the minerals being dated, and in their surroundings. The number of electron traps that are full, provides an estimate of the total absorbed radiation dose (measured in grays, Gy). This, and the rate at which the radiation dose is absorbed by the mineral(s) of interest (usually quoted in grays per 1000 years, Gy·ka-1), are used to calculate the time elapsed since the minerals were last exposed to sufficient sunlight. An optical age is simply the past radiation dose estimate, commonly referred to as the “equivalent dose”, De (or the “palaeodose equivalent”), divided by the environmental dose rate. A quantity proportional to the number of filled electron traps is estimated in the laboratory by heating the sample if TL dating is used, or, if optical dating is used, by exposing it to light of a specific photon energy or energy range. This laboratory heat or light gives trapped electrons enough energy to escape their traps. Once free, electrons can end up in a different kind of defect known as a recombination centre, and in that case excess energy is given off in the form of luminescence which is measured. The intensity of the luminescence is proportional to the number of trapped electrons.
Although optical dating is based on the same physical principles as TL dating, a key difference is that for optical dating light is used to evict electrons from traps. The method therefore allows the most light-sensitive electron traps to be sampled preferentially, whereas for TL dating light-sensitive and light-insensitive traps are measured together. The benefit of using optical dating is that samples that have been exposed to only a few seconds of direct sunlight can be dated, which permits much younger samples to be dated than can be using TL. Optical dating has been crucial for providing chronologies for eolian activity in many parts of the world (e.g., Stokes and Gaylord, 1993; Ollerhead et al. 1994; Stokes et al., 1997; Ivester et al., 2001; Arbogast et al., 2002; Chen et al., 2002; Forman and Pierson, 2002; Little et al., 2002; Thomas et al., 2002; Wolfe et al., this volume, among many others).
There are now several methods available to determine a De using optical dating. The most established of these are the so-called multiple-aliquot methods, in which many aliquots of the prepared sample, typically 20-50, each containing many thousands of single sand (or silt) sized grains, are used together to construct the sample’s dose-response (discussed below). However, in many cases, a sample’s De can be precisely determined from a single aliquot, or even a single grain. The advantages of single aliquot/grain methods are that (i) much less sample is needed; (ii) the experiments are simpler; and (iii) in situations where the depositional environment is such that a significant proportion of the grains in a sample had been inadequately bleached before burial, optical ages can be calculated from only those grains that had received sufficient sunlight exposure. Disadvantages and problems are low luminescence intensities (especially for young samples), underestimation of uncertainties arising from systematic effects (Murray and Olley, 2002), inadequate correction for sensitivity changes (e.g., Forman and Pierson, 2002), and lack of correction for anomalous fading (if feldspars are dated) and thermal transfer.
Quartz or Feldspar, and Which Grain Size?
In principle any mineral that emits optically stimulated luminescence has the potential for being used for optical dating, but quartz and feldspar have received the most attention because of their ubiquity. The most common grain sizes used for dating have been in the fine silt range (typically 4-11 μm diameter) or the fine to medium sand range (for example, the 90-125 μm or the 180-250 μm diameter ranges). These grain sizes are used because the microdosimetry is well understood (Aitken, 1985) and because sediment from within these ranges can be found in most of the depositional environments of interest; other grain sizes can be used in principle.
Quartz sand is currently the most common chronometer because it is highly resistant to weathering and can be found in environments where feldspar is lacking, it is relatively easy to separate in the laboratory, and, perhaps most importantly, it does not suffer from the effects of anomalous fading (discussed below). Despite these favourable characteristics, the luminescence emitted from quartz can be too small for easy measurement, so that for some sediments it is impracticable to obtain ages for young samples (i.e., those younger than ~1000 years, and in some cases for older samples as well) with adequate precision. Feldspars, on the other hand, emit much more luminescence than does quartz, and the luminescence from it saturates at higher radiation doses which allows older samples to be dated. Furthermore, thermal transfer is generally less for feldspar than for quartz. However, unlike quartz, feldspar suffers from anomalous fading, which has to be corrected for if accurate ages are to be obtained from it; see Huntley and Lamothe (2001) for a thorough discussion of the advantages and disadvantages of dating quartz and feldspar. For this study we used K-feldspar in the medium sand range (180-250 μm in diameter).
Sample Collection and Preparation
Samples were collected from sand dunes in the Dundurn and Elbow sand hills (Fig. 1). Samples from the Elbow Sand Hills were obtained to determine the timing of infilling of the former Qu’Appelle River valley with eolian sand, while samples from the Dundurn Sand Hills were obtained to establish the timing of activity of local cliff-top eolian deposits. Figure 2 shows section diagrams for both sites.
Figure 1

Location of eolian deposits and optical dating sample sites discussed in the text. The dashed lines delineate the areas that encompass the dune fields.
Localisation des dépôts éoliens et des sites de datation optique étudiés. Les lignes brisées délimitent les parties qui entourent les champs de dunes.
Samples were collected in daylight from freshly excavated exposures by quickly filling one-litre cans with sediment under an opaque tarpaulin; representative samples for water content and dosimetry measurements were also collected at this stage from sites immediately above and below the sample location.
In the laboratory, under subdued orange light, the sample cans were opened and a few centimetres of sediment was removed from the top and discarded. The top one-quarter of the remaining sediment was used for dating. Of this, a representative subsample (~20 g moist) was extracted, dried, ring-milled to a fine powder, and analysed for U, Th, Rb, and K contents needed for calculating the environmental dose rate. The rest was placed in dilute hydrochloric acid HCl to remove carbonates, then mechanically sieved to separate the 180-250 μm diameter fraction, from which the magnetic minerals were removed by magnetic separation. The nonmagnetic grains were then cleaned (etched) for 6 minutes in 10 % hydrofluoric acid (HF), which was followed by a further exposure to dilute HCl to dissolve precipitated fluorides and break up grain aggregates. The samples were then wet-sieved to remove grain fragments that resulted from the acid treatments. The samples were next rinsed several times with distilled water, dried, and K-feldspar grains were separated by flotation in a 2.58 g?cm-3 sodium polytungstate-water solution. This separation procedure is not perfect, and one study has shown that it results in a mixture of minerals with 15 to 97 % being K-feldspar, depending on the sample (Huntley and Baril, 1997), the remainder being mainly quartz and plagioclase feldspar. The K-feldspar concentrates were then sprinkled evenly into flat-bottomed aluminium planchets, 1.3 cm in diameter, that had been coated with silicone oil; for each sample 25 such aliquots were prepared for dating, each holding about 12 mg of the grains. A further 6 aliquots were prepared for anomalous fading measurements, but these samples were mounted using a transparent thermoplastic polymer instead of silicone oil (see Huntley and Lamothe [2001] for details). The polymer is used in this case because the planchets are repeatedly measured over many months and it is necessary that the grains remain motionless over this time period.
Determining the Environmental Radiation Dose Rate
The radiation dose absorbed by the sample while buried comes from α, β and γ radiation produced during the decay of 235U, 238U, 232Th, 40K, and 87Rb, and their daughter products, both from within the mineral grains dated and from their surroundings. There is also a contribution from cosmic rays which are highly energetic particles that originate from space. The dose rate not only depends on the concentration of these radioisotopes and the intensity of cosmic ray radiation, but also on the amount of water and organic matter in the sediment matrix as these attenuate or absorb radiation differently from the mineral matter. The various contributions to the dose rate for a sample (SFU-O-211) from Dundurn Sand Hills are illustrated in Figure 3.
Figure 2

Section diagrams, sample locations, and optical ages for the Dundurn Sand Hills and Elbow Sand Hills sites.
Diagrammes des coupes, localisation des échantillons et âges optiques obtenus aux sites des collines Dundurn et Elbow.
A complication is that radioactive disequilibrium can occur in the uranium and/or thorium decay chains. That is, that one or more of the daughter products of the parent isotopes have been leached out of, or have been introduced into, the sample site. This is most common for uranium because it is soluble in groundwater and can be taken up by organic matter; uranium and thorium also have a daughter product (radon gas) that can leave the sample site by gaseous diffusion. However, radioactive disequilibrium that is significant as far as dating is concerned is relatively rare, and when it has been found to be a serious problem it is usually in cases where the samples came from wet organic-rich environments (e.g., Lian et al., 1995; Huntley and Clague, 1996). If present, radioactive disequilibrium can be taken into account to some degree by measuring the activities of various parts of the decay chains, and correcting the calculated dose rate accordingly. For this study, however, we only sampled from relatively dry sand-dominated environments, and we therefore assumed disequilibrium to be negligible (cf. Prescott and Hutton, 1995).
The concentrations of the parent radioisotopes were determined using atomic absorption spectrometry (K), delayed neutron counting (U), and neutron activation analysis (Th and Rb). Dose rates due to ambient radiation arising from K, U and Th were calculated using standard formulae (e.g., Aitken, 1985; Berger, 1988; Lian et al., 1995), and the updated dose-rate conversion factors of Adamiec and Aitken (1998). For the component of the dose rate arising from β particles emitted during the decay of 40K and 87Rb within the K-feldspar grains dated, we used the concentration estimates recommended by Huntley and Baril (1997) and Huntley and Hancock (2001), respectively, and the β attenuation factors reported by Mejdahl (1979).
Another problem that can be encountered when determining the environmental dose rate is local inhomogeneity of the sediment matrix. Since the sample site can be affected by γ rays originating from sediments up to 50 cm away, the effects of nearby zones or beds of different material need to be taken into account. The most accurate approach uses in-situ γ-ray spectrometry (e.g., Aitken, 1998 or Lian and Huntley, 2001), but in situations where this technique is not available, as in this study, sediment can be collected immediately above and below the sample site and analysed separately. To assess the severity of inhomogeneity, we analysed the bracketing sediment for K. This isotope was chosen because (i) γ rays emitted when 40K decays to 40Ar are relatively energetic and can travel to the sample site from distances similar to those travelled by the most energetic γ rays emitted during the decay of U and Th; (ii) for the sediments studied, the most significant fraction of the total external γ dose comes from 40K, this fraction being about three times larger than that derived from U, and about twice of that derived from Th; and (iii) determination of K content is relatively straightforward and inexpensive. In each case we found little difference between the K concentrations determined from the bracketing sediments and those determined directly from the samples dated, and we therefore used the latter K content in the dose rate calculation. The concentrations of the relevant elements are listed in Table I.
Figure 3

Schematic illustration showing the various contributions to the dose rate in Gy·ka-1. Shown is a typical 215 μm diameter K-feldspar grain from sample SFU-O-211 in the cliff-top dune at Dundurn. The sample depth is 4 m. The total dose rate (ḊT = 2.84 ± 0.08 Gy·ka-1 ) is the sum of the components (in boxes) arising from cosmic rays, α and β particles from K, U, Th, and Rb within the grain (internal), and from β particles and γ rays from K, U, and Th in surroundings (external). There is no contribution from external α particles because the affected area of the grain is removed when the sample is etched with hydrofluoric acid (HF). The sediment contains 1.4 % K, 1.1 μg·g-1 U, 3.8 μg·g-1 Th, and 5 % water. The feldspar grain contains 12.5 % K, 0.2 μg·g-1 U, 0.8 μg·g-1 Th, and 375 μg·g-1 Rb.
Illustration schématisée des différents apports au débit de dose en Gy·ka-1. Grain de feldspath typique de 215 μm de diamètre tiré de l’échantillon SFU-O-211 recueilli dans la partie supérieure de la falaise des dunes de Dundum, à 4 m de profondeur ; le débit de dose total (ḊT = 2.84 ± 0.08 Gy·ka-1) est la somme des composantes (dans les boîtes) provenant des rayons cosmiques : les particules α et β issues de K, U, Th et Rb à l’intérieur du grain (internes) et des particules β et des rayons γ issus de K, U et Th des environs (externes). Il n’y a pas d’apport de la part des particules α externes parce que la partie du grain touchée est enlevée lorsque l’échantillon est nettoyé avec de l’acide fluorhydrique (FH). Le sédiment contient 1,4 % de K, 1,1 μg·g-1 de U, 3,8 μg·g-1 de Th, et 5 % d’eau. Le grain de feldspath contient 12,5 % de K, 0,2 μg·g-1 de U, 0,8 μg·g-1 de Th et 375 μg·g-1 de Rb.
The contribution of cosmic rays to the total dose rate was estimated using the formula of Prescott and Hutton (1994). The intensity of cosmic rays decreases with depth beneath the ground surface and, in cases where the rate of sedimentation is well known, it is possible to calculate the cosmic ray dose rate in detail. However, for sand dunes such as the ones studied here, sedimentation rates are expected to have varied significantly over time. Moreover, there is no way to account for periods of erosion and non-deposition. For those reasons we have chosen to use the present burial depths in the dose rate calculation (Table I); uncertainty in the depth of burial over the lifetime of the deposit is expected to contribute an uncertainty of no more than ±5 % to the calculated optical age.
The water content chosen for the dose rate calculation was the “as collected” value, with an appropriate uncertainty, which is expected to be a good approximation when long-term environmental conditions are considered (Table I). Organic matter was found to be negligible in all the samples, and it was therefore not included in the dose rate calculation.
Estimating the Equivalent Dose, De
Constructing the Dose Response
An estimate of the De is found by constructing the sample’s dose response. As mentioned above, there are currently several procedures available: some are based on using the luminescence measured from many sample aliquots that have been given various laboratory γ or β doses, while others are based on measuring the luminescence from a single aliquot (or grain), that is repeatedly dosed, preheated (discussed below) and measured — the so-called “single-aliquot additive-dose” (SAAD) “single-aliquot regeneration additive-dose” (SARA) and “single-aliquot regenerative-dose” (SAR) methods. One of these methods is illustrated by Lian and Huntley (2001), while comprehensive discussions of others are given by Murray et al. (1997), Aitken (1998), Galbraith et al. (1999), Stokes et al. (2000), Murray and Wintle (2000), Murray and Olley (2002), and Zhao et al. (2003). The aforementioned studies were concerned only with quartz, but progress towards dating single aliquots of K-feldspar sand has also been made (e.g., Wallinga et al., 2000), although there still remains the problem of anomalous fading.
For this study we used the multiple-aliquot additive-dose with thermal-transfer correction method introduced by Huntley et al. (1993) and Ollerhead et al. (1994) (see also Huntley and Lian [1999] and Lian and Huntley [2001] for reviews). The measurement procedure involved shining a beam of near infrared light (~20 mW cm-2 of 1.4 eV, ~850 nm, photons) on the sample aliquots holding the K-feldspar grains, and measuring the violet luminescence (3.1 eV, ~400 nm) emitted in response (Fig. 4a). Luminescence was measured using the automated apparatus described by Godfrey-Smith (1991). Optical filters in front of the detector (an EMI 9635Q photomultiplier tube) consisted of a Schott BG-39 filter, which absorbs scattered IR light from the excitation beam, and a Kopp 5-57 blue-pass filter which absorbs the yellow-green (570 nm) luminescence emitted from plagioclase feldspar; quartz does not emit luminescence under infrared excitation. The samples’ dose responses were constructed by measuring the luminescence from aliquots that had not been given a laboratory dose (“naturals”, or N), and from others that had been given various laboratory γ doses from a 60Co source at 0.12 Gy·min-1 (N + γ-dose aliquots); all the aliquots were preheated prior to measurement (see below). Figure 4b shows an example of how the luminescence decays with time after the infrared excitation photons are switched on. This decay corresponds to electrons traps being emptied. Figure 4c shows how the dose response is constructed using the luminescence measured from the sample aliquots (N and N + γ-dose points); a line is fitted to these data points and extrapolated. In the simplest case, the De is equal to the dose axis intercept, but in practice allowance is made for thermal transfer and normalization decay, which are discussed in turn below.
Table I
Sample locaties and sites, sample depths, concentrations of relevant radioisotopes used for dosimetry, and water

Sample’s depth beneath the ground surface.
K values were determined from a subsample of the sediment used for dating. Inhomogeneity was checked for by observing the K contents of sediment directly overlying and underlying the sample used for dating. Uncertainty in K content is ± 5%.
Water content = (mass water)/(dry minerals mass); water contents are the as-collected values; uncertainty used in the dose rate calculation is ± 15%.
Thermal Transfer and Correcting for it
Thermal transfer results from the requirement that the sample aliquots are heated (“preheated”) prior to final measurement. Preheating is necessary because laboratory irradiation not only puts electrons in the traps of interest (i.e., those traps that are thermally stable over geologic time), but also puts electrons in traps that have thermal lifetimes that are too short. Preheating the sample aliquots prior to final measurement empties the thermally unstable traps. The temperature and duration of the preheat is somewhat dependent on the type of mineral (quartz or feldspar) being dated, and it may also be dependent on intrinsic differences within a mineral type. To find an adequate preheat protocol, De’s are normally determined at increasing preheat temperatures until they become constant. For this work, however, we used a preheat protocol (120 °C for 16 hours) that had been previously used for samples collected from other regions in the southern Canadian prairies (David et al., 1999; Wolfe et al., 2001).
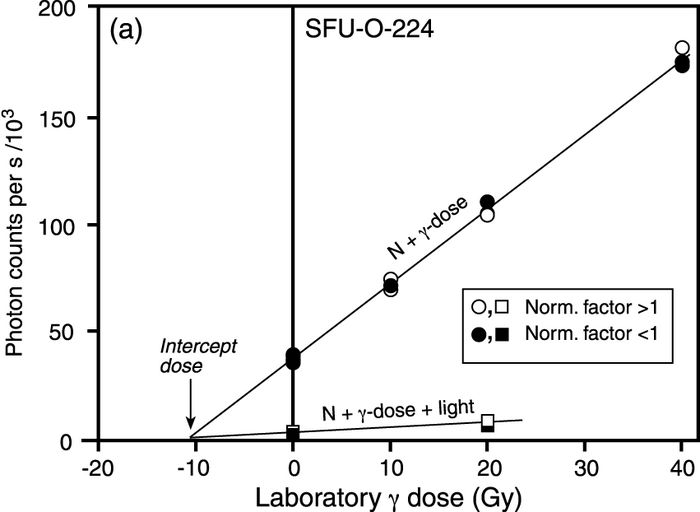
Preheating, unfortunately, also has the unwanted effect of transferring electrons from light-insensitive traps to thermally stable light-sensitive traps. This thermal transfer is corrected for with the N + γ-dose + light points, the lower dataset in Figure 4c: a line is also fit to these data, and it is extrapolated to where it intersects the N + γ-dose line above the dose axis (Fig. 4c).
The aliquots used to correct for thermal-transfer were bleached with red-infrared light obtained using a quartz-halogen lamp mounted behind a Schott RG-715 optical filter. The idea is that the laboratory bleach empties nearly all of the traps easily emptied by the light exposure, and that the luminescence measured after the preheat mainly is due to thermal transfer (there are also components resulting from scattered light from the excitation beam, and Raman scattered photons which this method also corrects for). The red-infrared bleach was chosen instead of a natural sunlight bleach on the basis of convenience (it can be performed in the laboratory regardless of weather, and time of day), but also because of its adequacy in several other studies, especially in cases where the sediment grains dated were transported and deposited in subaqueous environments where exposure to high-energy UV light would have been reduced. In those cases it was observed that a full sunlight bleach resulted in an increase in luminescence, which, if used to bleach the aliquots used for thermal transfer correction, would yield optical ages that were too young. It was thought that this increase in luminescence was due to UV light transferring electrons from hard to bleach traps into the traps that were measured for De determination (Huntley and Clague, 1996). On the other hand, if a red-infrared bleach is used to bleach the thermal-transfer correction aliquots for samples that had been deposited in full sunlight, the correction would be expected to result in optical ages that would be too old. To assess the affect of an infrared bleach on the samples of this study, we repeated the correction for two samples (SFU-O-223 and -229) using aliquots that had been given a two minute sunlight bleach under clear mid-day skies in mid-June (location: ~49° 15’ N; 122° 55’ W; elevation: ~400 m). The De’s for all the samples are listed in Table II.
Normalization
Normalization is a procedure that is used to help correct for the intrinsic variability of aliquots in a single set. This variability results because individual grains have various sensitivities, some emitting much more luminescence than others, even if they have all received the same dose of radiation. As a result the luminescence that is measured from an aliquot is dominated by only a small fraction of the grains, and as a result aliquots can not be made to be identical. To help correct for this, the luminescence from each aliquot is measured while it is given a short exposure to the excitation beam, before the laboratory γ doses are administered. The severity of this exposure depends on the luminescence intensity of the samples: samples that emit low luminescence need longer normalization times. For this study we exposed the sample aliquots to ~5 mW•cm-2 of light for five or ten seconds. The luminescence intensity measured from each aliquot was divided by the average luminescence intensity of the entire set thus producing normalization factors. These normalization factors were used later to reduce scatter in the data. The affect that normalization has on the scatter in the additive-dose data can also be used to assess degree of initial sunlight exposure; this is discussed below.
Figure 4
a

A beam of infrared photons of ~1.4 eV in energy is directed onto the separated K-feldspar grains; electrons are excited from the relevant traps, and some become lodged at recombination centres and emit violet luminescence in the process.
Un rayon de photons infrarouges de ~1,4 eV d’énergie est dirigé sur les grains de feldspath isolés ; les électrons sont d’abord libérés de leur piège, puis certains d’entre eux sont logés dans des centres de recombinaison et émettent une luminescence violette au cours du processus.
b

Luminescence decay versus excitation time for K-feldspar grains from sample SFU-O-225 that have not been given a laboratory γ dose (N), and for aliquots that have been given 10, 20, and 40 Gy of γ radiation in addition (N + γ-dose); also shown is the luminescence decay for grains that have been given a 3 h red-infrared bleach (N + bleach). The aliquots were heated for 16 h at 120 °C before measurement.
La décroissance de la luminescence par rapport au temps d’excitation donné aux grains de feldspath de l’échantillon SFU-O-225 qui n’ont pas reçu de dose γ en laboratoire (N) et aux portions aliquotes qui ont reçu 10, 20 et 40 Gy de radiation γ de plus (N + dose γ). Apparaissent aussi la décroissance de la luminescence des grains qui ont reçu un lessivage à l’infrarouge (N + lessivage) pendant 3 h. Les grains ont été chauffés à 120 °C pendant 16 h avant la mesure.
c

Dose response constructed using the luminescence integrated over the first 10 s of excitation. The upper line (solid data points) is the additive-dose curve, while the lower line (open data points) is used to correct for thermal-transfer. The equivalent dose (De) is equal to the dose at the intercept, with a small correction for normalization decay.
Réactions aux doses γ selon la quantité de luminescence intégrée pendant les 10 premières secondes de stimulation. La ligne supérieure représente la courbe des doses additionnelles tandis que la ligne inférieure sert à corriger le transfert thermique. La dose équivalente (De) est égale à la dose artificielle au point d’interception, comprenant une légère correction pour compenser la décroissance de la normalisation.
Basic measurements in optical dating.
Mesures de base en datation optique.
Testing for Insufficient Exposure to Sunlight
One of the limitations of all luminescence dating methods is uncertainty about the degree of sunlight exposure prior to final burial of the sample of interest. For eolian sediments, such as those studied here, the probability that all the grains comprising a sample have received adequate sunlight is relatively high. However, there are circumstances for which adequate sunlight exposure does not occur, and in these cases a sample will yield a luminescence age which is too old. These include: (i) erosion and deposition of some or all of the sample in darkness; (ii) rapid deposition from a source area that is nearby (e.g., Lamothe and Auclair, 1997); (iii) transportation of grains within opaque concretions or cemented grain clusters (e.g., see Lian and Huntley, 1999); and (iv) upward grain movement in the profile sampled as a result of bioturbation, cryoturbation, or ground water movement.
Table II
Cosmic ray dose rates (Ḋc), total dose rates (ḊT), equivalent doses (De), fading rates, and optical ages
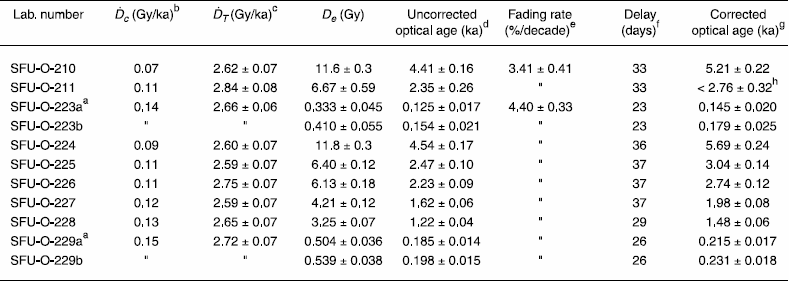
Aliquots used for thermal transfer correction were given a natural sunlight bleach instead of a red-infrared laboratory bleach.
Dose rate due to cosmic ray radiation, calculated using present burial depths.
Total dose rate, ḊT = ḊC+Ḋα, β, γ, where Ḋα, β, γ is the dose rate due to α, β, and γ radiation.
Optical ages, not corrected for anomalous fading.
Fading rates calculated from data collected between 1.7 and 641 days after laboratory irradiation; see the text for discussion. The fading rate (g) of 3.41 ± 0.41 %/decade was used to correct samples SFU-O-210 and –211, while the fading rate of 4.40 ± 0.33 %/decade was used to correct all the other samples.
Delay between laboratory irradiation and measurement.
Optical ages (before AD 2001), corrected for anomalous fading using the fading rates listed in the adjacent column. Uncertainties are analytical only, and are quoted as ±1σ.
The nature of the scatter in the normalized dose-response data (Fig. 5b) suggests that this sample contains grains that were not exposed to sufficient sunlight, and hence its age must be interpreted as an upper limit.
Note: If the updated β attenuation factor for Rb within a ~215 μm diameter K-feldspar grain reported by Readhead (2002) is used in the dose rate calculation instead of the one given by Mejhdal (1979) (see the text), the optical ages listed above increase by about 2%.
If single aliquot or single grain methods are used to determine the De, the presence of grains that have not received sufficient sunlight exposure can be tested for by observing the degree and pattern of scatter in the optical ages obtained from many individual grains or aliquots (e.g., Roberts et al., 1998, 1999; Colls et al., 2001; Fuchs and Lang, 2001).
For multiple aliquot methods one can observe the pattern of the scatter in the normalized luminescence measured from the aliquots used to construct the sample’s dose-response. Huntley and Berger (1995) demonstrated that the nature of the scatter can be used to reveal whether that scatter results from intrinsic causes (e.g., different electron trap and recombination centre concentrations, variations in grain transparency, etc.), or from external causes (e.g., spatial variation in the environmental dose rate, variations in the degree of bleaching prior to burial, etc.). Scatter due to intrinsic causes is reduced by normalization, while scatter will increase if external effects were present. This procedure was recently described by Ollerhead et al. (2001), and used by these workers to detect the presence of poorly bleached grains in sand deposited into a coastal lake, probably by tsunami.
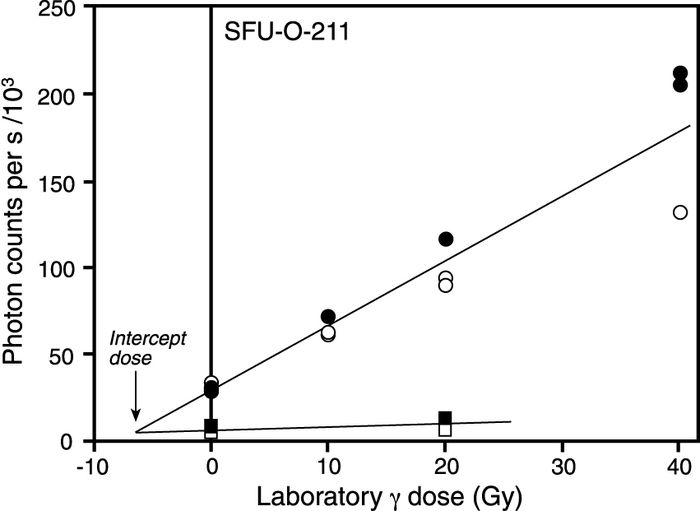
If scatter is the result of external causes applying the normalization factors will cause the scatter to diverge about the curve fitted to the data set. Furthermore, luminescence measured from aliquots for which the calculated normalization factors are less than the average value of the entire set will plot above the fitted line, while luminescence from aliquots associated with normalization factors that are larger than the average value will plot below it. If this pattern is apparent in a sample, the interpretation is that the sample was not adequately bleached prior to burial, and as a result any calculated optical age must be considered a maximum age for the deposit. Figure 5a shows an example of data not showing this effect, and Figure 5b shows an example of data that clearly shows this effect. In order to best see this pattern one should design the dataset used for the dose response so that aliquots with the largest and smallest normalization values are given the largest laboratory radiation doses.
Plots of De as a function of excitation time (e.g., as in Fig. 5c) can also be used to assess the nature of sunlight exposure: if the De is rising with excitation time, the interpretation is that the sample consists of grains that have all been partially bleached prior to deposition. The reason for this rise is that the longer the excitation beam is left on, the higher the likelihood that light-insensitive traps are measured (Huntley et al., 1985). However, such a rise is not expected if the sample consists of a population of grains that have been exposed to sufficient sunlight, mixed together with one or more populations that have not.
Correcting Optical Ages for Anomalous Fading
Anomalous fading refers to the phenomena of the measured luminescence arising from electron traps that should be thermally stable over geologic time but that is actually decreasing (fading) with time after laboratory irradiation (i.e., over hours, days, weeks, etc.). The luminescence is found to fade linearly with the logarithm of time after laboratory irradiation, and it is thought that this is due to electrons escaping from the otherwise stable traps by quantum-mechanical tunnelling. The evidence suggests that anomalous fading occurs to various degrees in all feldspars, and if it is not corrected for, a calculated luminescence age will be too young. Whether or not anomalous fading is considered significant as far as dating is concerned depends on the rate of fading, and the accuracy required in the calculated ages. However, for samples within the linear part of their dose response, anomalous fading can be corrected using the model of Huntley and Lamothe (2001).
The principal requirements of the correction method are (i) that the feldspar sample is in the linear part of its dose-response, (ii) that the fading rate for the sample of interest can be measured with adequate precision and (iii) that the measured fading rate is valid for the time since deposition. The first requirement limits the correction to samples younger than about 20 ka in practice, and the second can be readily met with suitable laboratory procedures; the third requirement can only be met by testing the correction method on samples for which there is independent chronological information.
Figure 5
a
b
c
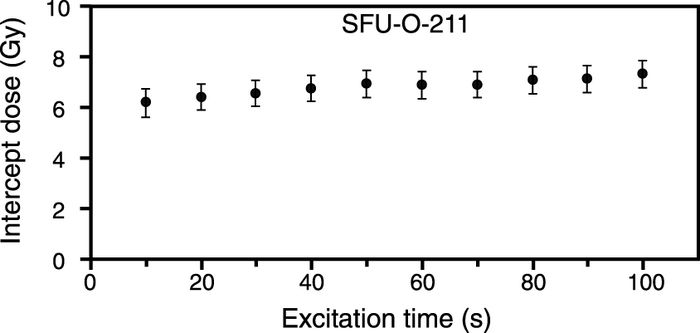
Additive-dose curves showing the pattern in the scatter in the normalized data points associated with samples having different bleaching histories. For the sample in (a) the data points with normalization factors greater than one (open points) lie on both sides of the line, as do those data points with normalization factors less than one (solid points); this indicates that the sample grains were sufficiently bleached prior to deposition. For the sample in (b), the solid points consistently lie above the fitted line, while the open points consistently lie below. Moreover, the scatter in the data increases with increasing laboratory dose. This, together with a flat De versus excitation time plot (c), indicates that the sample consists of more than one population of grains, each with a different bleaching history.
Courbes des doses additionnelles illustrant la dispersion des grains normalisés provenant d’échantillons ayant connu différentes remises à zéro. En (a) les points dont les facteurs de normalisation sont plus grands que un (cercles blancs) se trouvent de part et d’autre de la ligne ajustée, tout comme les points dont les facteurs de normalisation sont inférieurs à 1 (cercles noirs). Cette répartition démontre que les grains échantillonnés ont été bien mis à zéro avant le dépôt. En (b), les points noirs se trouvent au-dessus de la ligne, tandis que les points blancs, en dessous. De plus, la dispersion des données augmente selon l’augmentation des doses reçues en laboratoire. Cette dispersion, ainsi que la De constante malgré un temps d’excitation variable (c), démontre que l’échantillon comprend plusieurs populations de grains dont la remise à zéro est différente.
Figure 6 shows anomalous fading for one of the Elbow Sand Hills samples (sample SFU-O-227). The prepared sample grains were given a laboratory γ dose of 150 Gy, and then preheated at 120 °C for 16 hours. The initial data were collected 1.7 days after the laboratory irradiation, then additional data were collected at five subsequent times, and finally after 641 days. The time delays between irradiation and the subsequent measurements were chosen on the basis of convenience, but designed to be spaced evenly on a logarithmic time scale. Over this period it can be seen that the measured luminescence has decreased to nearly 88 % of its initial value. These data (Fig. 6) were used to calculate the sample’s fading rate, κ, which is the fractional reduction of the luminescence intensity per factor e of time (e being the base of the natural logarithm). The measured fading rate is then used to correct the optical age by means of the following relationship (Huntley and Lamothe, 2001):
where T is the true age, and I0 is the luminescence intensity that would be measured had there been no fading. Tf and If are the age and luminescence intensity affected by fading, respectively; tc is the time delay between laboratory irradiation and measurement, and the value of κ used for the correction must be that which is applicable to tc. Since it is easier to consider the fading rate as the per cent decrease in luminescence intensity per factor of 10 in time, the quantity g, with units of per cent per decade (% / decade), is commonly used instead of κ to quote the fading rate, where g = 100 κ ln(10).
If the correction for sample SFU-O-227 (Fig. 6) had not been made, the calculated optical age would be too young by about 20 %. For this study we measured fading rates for two samples that we believe are representative of the entire set on the basis of the mineral source areas, and used these fading rates to correct all the sample ages (Table II).
Optical Ages
Optical ages of the samples were calculated by dividing their De’s by their respective total dose rates, and then correcting the resulting age-values for anomalous fading using the fading data (e.g., as in Fig. 6) and equation [1]. The true (corrected) ages are listed in Table II, and give the time elapsed since the sample was last buried.
Dundurn Sand Hills
Upon inspection of the scatter in the normalized dose response data it was concluded that only one sample (SFU-O-211) consisted of grains that had been insufficiently bleached prior to final burial. Moreover, the plot of De versus excitation time for this sample (Fig. 5c) was flat which suggests that it consists of one or more populations of grains, each population having been exposed to sunlight for a different duration. This was a sample which was collected from a cliff-top dune at Dundurn (Figs. 2, 3). Since cliff-top dunes are formed in part from rapid upslope transportation of sediment deflated from proximal source areas, and in part from sediment that has arrived from more distant sources, this result was not surprising. Indeed, anomalously old luminescence ages have previously been reported for such deposits (e.g., Huntley et al., 1983; Lamothe and Auclair, 1997; Lian and Huntley, 1999). The optical age for sample SFU-O-211 must therefore be considered a maximum age. By comparison, sample SFU-O-210, obtained from lower in the section (Fig. 2) did not exhibit this characteristic pattern in the scatter of the normalized dose response data. The reason for this difference is not known, but it does indicate that, unlike the overlying sediments, these grains were sufficiently bleached prior to burial. One possibility is that the upper sediments sampled were in closer proximity to the sediment source than were the sediments lower in the section.
Figure 6
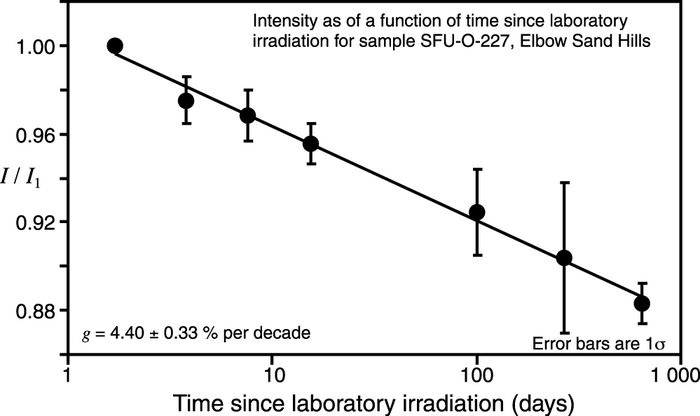
Luminescence intensity as a function of time since irradiation, showing anomalous fading for sample SFU-O-227. Five aliquots were given a 150 Gy γ dose and heated at 120 °C for 16 h. The aliquots were measured 1.7 days after irradiation and at six subsequent times. Over this time period the luminescence decreased to about 88 % of its initial value. These data are used to determine the samples fading rate (g), which is in turn used to correct the optical age. If fading were not corrected for the optical age would be underestimated by ~20 %. I is the luminescence intensity measured in response to a short exposure to the excitation beam; I1 is the luminescence intensity measured 1.7 days after laboratory irradiation.
Intensité de la luminescence en fonction du temps écoulé depuis l’irradiation, montrant la décroissance anormale pour l’échantillon SF-O-227. Cinq portions aliquotes ont reçu une dose γ de 150 Gy et ont été chauffées à 120 °C pendant 16 h. Les portions aliquotes ont été mesurées 1,7 jours après irradiation et de nouveau 6 fois par la suite. Au cours de cette période, la luminescence a décru de 88 % environ de sa valeur initiale. Ces données servent à déterminer le taux de décroissance (g), qui à son tour sert à mesurer l’âge optique véritable. Si la décroissance n’était pas corrigée, l’âge optique serait sous-estimé d’environ 20 %. I représente l’intensité de la luminescence mesurée en réponse à une courte exposition à l’irradiation ; I1 représente l’intensité de la luminescence mesurée 1,7 jours après irradiation en laboratoire. La marge d’erreur est de 1σ.
Elbow Sand Hills
The character of the scatter in the normalized dose response data for samples collected from Elbow Sand Hills indicates that all the grains sampled were sufficiently bleached prior to final burial.
Dose-intercepts for samples SFU-O-223 and SFU-O-229 were determined using both a laboratory red-infrared bleach and a natural sunlight bleach for the thermal-transfer correction. In both cases the optical ages calculated using the sunlight bleach were younger than those calculated using the laboratory bleach (Table II). However, this difference is not large, 34 ± 32 years for sample SFU-O-223 and 16 ± 25 years for sample SFU-O-229, and indicates that use of the laboratory bleach did not lead to a significant error in the other samples, which all yielded optical ages more than 1 ka.
With one exception, optical ages derived from the Elbow Sand Hills are for dune sand deposits, and are applicable to the timing of eolian activity and the infilling of the Qu’Appelle River valley (discussed in detail by Wolfe et al., this volume). Sample SFU-O-226, however, was derived from eolian sand within a paleosol. An optical age derived from sediments within a paleosol should not be expected to be the same as a radiocarbon age derived from the organic matter at the same location. Organic matter within a soil is derived from a variety of sources, and accumulates over the soil residence time; a conservative approach to interpreting radiocarbon ages derived from paleosols in dune deposits is to consider them as maximum limiting ages for any overlying deposits (David, 1971). In contrast, an optical age of a paleosol dates the time of deposition and burial of the sediment. Excluding any additional input of sediment during the life of the soil, or re-exposure to light by bioturbation (which we expect to have been minimal), an optical age from a paleosol may pre-date a radiocarbon age from the same location, as it may therefore more closely approximate the termination eolian activity. As well, if organic matter in a soil was alive when it was buried, then an optical age from immediately overlying eolian sands should represent the “death-age” of the soil.
Accordingly, the optical age of 3.02 ± 0.14 ka for sample SFU-O-225 may be interpreted as dating dune activity. The optical age of 2.72 ± 0.13 ka for sample SFU-O-226, which was derived from the paleosol directly above sample SFU-O-225, is interpreted as dating the termination of eolian activity. The optical age of 1.97 ± 0.12 ka for sample SFU-O-224, derived from eolian sand overlying the paleosol may be interpreted as dating renewal of dune activity, and the termination of soil development. From this, it may be inferred that dune stability and associated soil development occurred for a period of about 750 years, between 2.72 ± 0.13 ka and 1.97 ± 0.12 ka. Although no radiocarbon ages could be obtained for the paleosols studied here, a comparison with optical ages from within paleosols would be useful.
Concluding Remarks
Optical dating of sand-sized potassium feldspar from eolian dunes on the Canadian prairies, using the multiple-aliquot additive-dose with thermal transfer correction method, provides a viable way of dating periods of dune instability. Optical ages of less than 200 years, with a precision better than ±20 % at a confidence level of 95 % (2σ) are readily achievable; for samples of the order of 1 ka, precisions better than ±10 % (2σ) are common (see also Wolfe et al., 2001). However, when using this method, dose response data must be checked to see whether a sample is comprised of grains that have all been exposed to sufficient sunlight prior to final burial. If this is not the case, a calculated age can only serve as an upper limit. Moreover, accurate optical ages can only be achieved if anomalous fading is corrected for (Huntley and Lamothe, 2001). For the samples studied here, anomalous fading results in optical ages being too young by 10-20 % if not corrected for.
Appendices
Acknowledgements
Optical dating experiments were undertaken in the Optical Dating Laboratory at Simon Fraser University, B.C. Canada, which is supported in part by the Natural Sciences and Engineering Research Council of Canada. We wish to thank Sean Todd for laboratory assistance, Janet Campbell for assistance with sample collection, and Ron Watson and the staff at Douglas Provincial Park for access to land and permission to collect samples. Scott St. George and an anonymous reviewer supplied comments that improved the manuscript.
Note
-
[*]
Geological Survey of Canada Contribution 2002033
References
- Adamiec, G. and Aitken, M.J., 1998. Dose-rate conversion factors: update. Ancient TL, 16: 37-50.
- Aitken, M.J., 1985. Thermoluminescence Dating. Academic Press, London, 359 p.
- ____ 1998. An Introduction to Optical Dating. Oxford University Press, Oxford, 267 p.
- Arbogast, A.F., Wintle, A.G. and Packman, S.C., 2002. Widespread middle Holocene dune formation in the eastern Upper Peninsula of Michigan and the relationship to climate and outlet-controlled lake level. Geology, 30: 55-58.
- Berger, G. W., 1988. Dating Quaternary events by luminescence. In D.J. Easterbrook, ed., Dating Quaternary Sediments, p. 13-50. In Geological Society of America Special Paper 227,165 p.
- Chen, X.Y., Spooner, N.A., Olley, J.M. and Questiaux, D.G., 2002. Addition of aeolian dust to soils in southeastern Australia: Red silty clay trapped in dunes bordering Murrumbidgee River in the Wagga Wagga region. Catena, 47: 1-27.
- Colls, A.E., Stokes, S., Blum, M.D. and Straffin, E., 2001. Age limits on the Late Quaternary evolution of the upper Loire River. Quaternary Science Reviews, 20: 743-750.
- David, P.P., 1971. The Brookdale Road section and its significance in the chronological studies of dune activities in the Brandon Sand Hills of Manitoba, p. 293-299. In A.C. Turnock, ed., Geoscience Studies in Manitoba. Geological Association of Canada, Toronto, Special Paper 9, 352 p.
- David, P.P., Wolfe, S.A., Huntley, D.J. and Lemmen, D.S., 1999. Activity cycle of parabolic dunes based on morphology and chronology from Seward Sand Hills, Saskatchewan, p. 223-238. In D.S. Lemmen and R.E. Vance, eds., Holocene Climate and Environmental Changes in the Palliser Triangle: A Geoscientific Context for Evaluating the Impacts of Climate Change on the Southern Canadian Prairies. Geological Survey of Canada, Ottawa, Bulletin 534, 295 p.
- Forman, S.L. and Pierson, J., 2002. Late Pleistocene luminescence chronology of loess deposition in the Missouri and Mississippi river valleys, United States. Palaeogeography, Palaeoclimatology, Palaeoecology, 186: 25-46.
- Fuchs, H. and Lang, A., 2001. OSL dating of coarse-grain fluvial quartz using single-aliquot protocols on sediments from NE Peloponnese, Greece. Quaternary Science Reviews, 20: 783-787.
- Galbraith, R.F., Roberts, R.G., Laslett, G.M., Yoshida, H. and Olley, J.M., 1999. Optical dating of single and multiple grains of quartz from Jinmium rock shelter, northern Australia. Part I: Experimental design and statistical models. Archaeometry, 41: 339-364.
- Godfrey-Smith, D.I., 1991. Optical Dating Studies of Sediment Extracts. Ph.D. thesis, Simon Fraser University, Burnaby, 255 p.
- Huntley, D.J. and Baril, M.R., 1997. The K content of the K-feldspars being measured in optical dating or thermoluminescence dating. Ancient TL, 15: 11-13.
- Huntley, D. J. and Berger, G. W., 1995. Scatter in luminescence dating for optical dating — some models. Ancient TL, 13: 5-9.
- Huntley, D.J. and Clague, J.J., 1996. Optical dating of tsunami-laid sands. Quaternary Research, 46: 127-140.
- Huntley, D.J. and Hancock, R.G.V., 2001. The Rb contents of K-feldspar grains being measured in optical dating. Ancient TL, 19: 43-46.
- Huntley, D.J. and Lamothe, M., 2001. Ubiquity of anomalous fading in K-feldspars, and the measurement and correction for it in optical dating. Canadian Journal of Earth Sciences, 38: 1093-1106.
- Huntley, D.J. and Lian, O.B., 1999. Using optical dating to determine when a sediment was last exposed to sunlight, p. 211-222. In D.S. Lemmen and R.E. Vance, eds., Holocene Climate and Environmental Change in the Palliser Triangle: A Geoscientific Context for Evaluating the Impacts of Climate Change on the Southern Canadian Prairies. Geological Survey of Canada, Ottawa, Bulletin 534, 295 p.
- Huntley, D.J., Berger, G.W., Divigalpitiya, W.M.R. and Brown, T.A., 1983. Thermoluminescence dating of sediments. PACT (Journal of the European Study Group on Physical, Chemical, and Mathematical Techniques Applied to Archaeology), 9: 607-618.
- Huntley, D.J., Godfrey-Smith, D.I. and Thewalt, M.L.W., 1985. Optical dating of sediments. Nature, 313: 105-107.
- Huntley, D.J., Hutton J.T. and Prescott, J. R. 1993. Optical dating using inclusions within quartz grains. Geology, 21: 1087-1090.
- Ivester, A.H., Leigh, D.S. and Godfrey-Smith, D.I., 2001. Chronology of inland eolian dunes on the coastal plain of Georgia, USA. Quaternary Research, 55: 293-302.
- Lamothe, M. and Auclair, M., 1997. Assessing the datability of young sediments by IRSL using an intrinsic laboratory protocol. Radiation Measurements, 27: 107-117.
- Lian, O. B. and Huntley, D.J., 1999. Optical dating studies of post-glacial aeolian deposits from the south-central interior of British Columbia, Canada. Quaternary Science Reviews, 18: 1453-1466.
- ____ 2001. Luminescence dating, p. 261-282. In W.M. Last and J.P. Smol, eds., Tracking Environmental Change Using Lake Sediments. Volume 1: Basin Analysis, Coring, and Chronological Techniques. Kluwer, Dordrecht, 548 p.
- Lian, O.B., Hu, J., Huntley, D.J. and Hicock, S.R., 1995. Optical dating studies of Quaternary organic-rich sediments from southwestern British Columbia and northwestern Washington State. Canadian Journal of Earth Sciences, 32: 1194-1207.
- Little, E.C., Lian, O.B., Velichko, A.A, Morozova, T.D., Nechaev, V.P., Dlussky, K.G. and Rutter, N.W., 2002. Quaternary stratigraphy and optical dating of loess from the East European Plain (Russia). Quaternary Science Reviews, 21: 1745-1762.
- Mejdahl, V., 1979. Thermoluminescence dating: Beta-dose attenuation in quartz grains. Archaeometry, 21: 61-72.
- Murray, A.S. and Olley, J.M., 2002. Precision and accuracy in the optically stimulated luminescence dating of sedimentary quartz: A status review. Geochronometria, 21: 1-16.
- Murray, A.S. and Wintle, A.G., 2000. Luminescence dating of quartz using an improved single-aliquot regenerative-dose protocol. Radiation Measurements, 32: 57-73.
- Murray, A.S., Roberts, R.G. and Wintle, A.G., 1997. Equivalent dose measurements using a single aliquot of quartz. Radiation Measurements, 27: 171-184.
- Ollerhead, J., Huntley, D.J. and Berger, G.W., 1994. Luminescence dating of sediments from Buctouche Spit, New Brunswick. Canadian Journal of Earth Sciences, 31: 523-531.
- Ollerhead, J., Huntley, D.J., Nelson, A.R. and Harvey, H.M. 2001. Optical dating of tsunami-laid sand from an Oregon coastal lake. Quaternary Science Reviews, 20: 1915-1926.
- Prescott, J. R. and Hutton, J.T., 1994. Cosmic ray contributions to dose rates for luminescence and ESR dating: Large depths and long-term time variations. Radiation Measurements, 23: 497-500.
- ____ 1995. Environmental dose rates and radioactive disequilibrium from some Australian luminescence dating sites. Quaternary Science Reviews, 14: 43-448.
- Readhead, M.L. 2002. Absorbed dose fraction for 87Rb β particles. Ancient TL, 20: 25-28.
- Roberts, R.G., Bird, M., Olley, J., Galbraith, R., Lawson, E., Laslett. G., Yoshida, H., Jones, R., Fullagar, R., Jacobsen, G. and Hau, Q., 1998. Optical and radiocarbon dating at Jinmium rock shelter in northern Australia. Nature, 393: 358-362.
- Roberts, R.G., Galbraith, R.F., Olley, J.M., Yoshida, H. and Laslett, G.M., 1999. Optical dating of single and multiple grains of quartz from Jinmium rock shelter, northern Australia. Part II: Results and implications. Archaeometry, 41: 365-395.
- Stokes, S. and Gaylord, D.R., 1993. Optical dating of Holocene dune sands in the Ferris Dune Field, Wyoming. Quaternary Research, 39: 274-281.
- Stokes, S., Thomas, D.S.G. and Washington, R., 1997. New chronological evidence for the nature and timing of linear dune development in southwest Kalahari desert. Nature, 388: 154-158.
- Stokes, S., Colls, A. E., Fattahi, M. and Rich, J., 2000. Investigations of the performance of quartz single aliquot De determination procedures. Radiation Measurements, 32: 585-594.
- Thomas, D.S., Holmes, P.J., Bateman, M.D. and Marker, M.E., 2002. Geomorphic evidence for late Quaternary environmental change from eastern Great Karoo margin, South Africa. Quaternary International, 89: 151-164.
- Wallinga, J., Murray, A. and Wintle, A., 2000. The single-aliquot regenerative-dose (SAR) protocol applied to coarse-grain feldspar. Radiation Measurements, 32: 529-533.
- Wolfe, S.A., Huntley, D.J., David, P.P., Ollerhead, J., Sauchyn, D.J. and MacDonald, G.M., 2001. Late 18th century drought-induced sand dune activity, Great Sand Hills, Saskatchewan. Canadian Journal of Earth Sciences, 38: 105-117.
- Wolfe, S.A., Ollerhead, J. and Lian, O.B., 2002. Holocene eolian activity in south-central Saskatchewan and the southern Canadian prairies. Géographie physique et Quaternaire, 56: 215-227.
- Zhao, H., Li, S.-H. and Murray, A.S., 2003. Comparison of SAAD and SAR procedures for equivalent dose determination using quartz. Radiation Measurements, 37: 417-424.
List of figures
Figure 1
Location of eolian deposits and optical dating sample sites discussed in the text. The dashed lines delineate the areas that encompass the dune fields.
Localisation des dépôts éoliens et des sites de datation optique étudiés. Les lignes brisées délimitent les parties qui entourent les champs de dunes.
Figure 2
Section diagrams, sample locations, and optical ages for the Dundurn Sand Hills and Elbow Sand Hills sites.
Diagrammes des coupes, localisation des échantillons et âges optiques obtenus aux sites des collines Dundurn et Elbow.
Figure 3
Schematic illustration showing the various contributions to the dose rate in Gy·ka-1. Shown is a typical 215 μm diameter K-feldspar grain from sample SFU-O-211 in the cliff-top dune at Dundurn. The sample depth is 4 m. The total dose rate (ḊT = 2.84 ± 0.08 Gy·ka-1 ) is the sum of the components (in boxes) arising from cosmic rays, α and β particles from K, U, Th, and Rb within the grain (internal), and from β particles and γ rays from K, U, and Th in surroundings (external). There is no contribution from external α particles because the affected area of the grain is removed when the sample is etched with hydrofluoric acid (HF). The sediment contains 1.4 % K, 1.1 μg·g-1 U, 3.8 μg·g-1 Th, and 5 % water. The feldspar grain contains 12.5 % K, 0.2 μg·g-1 U, 0.8 μg·g-1 Th, and 375 μg·g-1 Rb.
Illustration schématisée des différents apports au débit de dose en Gy·ka-1. Grain de feldspath typique de 215 μm de diamètre tiré de l’échantillon SFU-O-211 recueilli dans la partie supérieure de la falaise des dunes de Dundum, à 4 m de profondeur ; le débit de dose total (ḊT = 2.84 ± 0.08 Gy·ka-1) est la somme des composantes (dans les boîtes) provenant des rayons cosmiques : les particules α et β issues de K, U, Th et Rb à l’intérieur du grain (internes) et des particules β et des rayons γ issus de K, U et Th des environs (externes). Il n’y a pas d’apport de la part des particules α externes parce que la partie du grain touchée est enlevée lorsque l’échantillon est nettoyé avec de l’acide fluorhydrique (FH). Le sédiment contient 1,4 % de K, 1,1 μg·g-1 de U, 3,8 μg·g-1 de Th, et 5 % d’eau. Le grain de feldspath contient 12,5 % de K, 0,2 μg·g-1 de U, 0,8 μg·g-1 de Th et 375 μg·g-1 de Rb.
a
A beam of infrared photons of ~1.4 eV in energy is directed onto the separated K-feldspar grains; electrons are excited from the relevant traps, and some become lodged at recombination centres and emit violet luminescence in the process.
Un rayon de photons infrarouges de ~1,4 eV d’énergie est dirigé sur les grains de feldspath isolés ; les électrons sont d’abord libérés de leur piège, puis certains d’entre eux sont logés dans des centres de recombinaison et émettent une luminescence violette au cours du processus.
b
Luminescence decay versus excitation time for K-feldspar grains from sample SFU-O-225 that have not been given a laboratory γ dose (N), and for aliquots that have been given 10, 20, and 40 Gy of γ radiation in addition (N + γ-dose); also shown is the luminescence decay for grains that have been given a 3 h red-infrared bleach (N + bleach). The aliquots were heated for 16 h at 120 °C before measurement.
La décroissance de la luminescence par rapport au temps d’excitation donné aux grains de feldspath de l’échantillon SFU-O-225 qui n’ont pas reçu de dose γ en laboratoire (N) et aux portions aliquotes qui ont reçu 10, 20 et 40 Gy de radiation γ de plus (N + dose γ). Apparaissent aussi la décroissance de la luminescence des grains qui ont reçu un lessivage à l’infrarouge (N + lessivage) pendant 3 h. Les grains ont été chauffés à 120 °C pendant 16 h avant la mesure.
c
Dose response constructed using the luminescence integrated over the first 10 s of excitation. The upper line (solid data points) is the additive-dose curve, while the lower line (open data points) is used to correct for thermal-transfer. The equivalent dose (De) is equal to the dose at the intercept, with a small correction for normalization decay.
Réactions aux doses γ selon la quantité de luminescence intégrée pendant les 10 premières secondes de stimulation. La ligne supérieure représente la courbe des doses additionnelles tandis que la ligne inférieure sert à corriger le transfert thermique. La dose équivalente (De) est égale à la dose artificielle au point d’interception, comprenant une légère correction pour compenser la décroissance de la normalisation.
Basic measurements in optical dating.
Mesures de base en datation optique.
a
b
c
Additive-dose curves showing the pattern in the scatter in the normalized data points associated with samples having different bleaching histories. For the sample in (a) the data points with normalization factors greater than one (open points) lie on both sides of the line, as do those data points with normalization factors less than one (solid points); this indicates that the sample grains were sufficiently bleached prior to deposition. For the sample in (b), the solid points consistently lie above the fitted line, while the open points consistently lie below. Moreover, the scatter in the data increases with increasing laboratory dose. This, together with a flat De versus excitation time plot (c), indicates that the sample consists of more than one population of grains, each with a different bleaching history.
Courbes des doses additionnelles illustrant la dispersion des grains normalisés provenant d’échantillons ayant connu différentes remises à zéro. En (a) les points dont les facteurs de normalisation sont plus grands que un (cercles blancs) se trouvent de part et d’autre de la ligne ajustée, tout comme les points dont les facteurs de normalisation sont inférieurs à 1 (cercles noirs). Cette répartition démontre que les grains échantillonnés ont été bien mis à zéro avant le dépôt. En (b), les points noirs se trouvent au-dessus de la ligne, tandis que les points blancs, en dessous. De plus, la dispersion des données augmente selon l’augmentation des doses reçues en laboratoire. Cette dispersion, ainsi que la De constante malgré un temps d’excitation variable (c), démontre que l’échantillon comprend plusieurs populations de grains dont la remise à zéro est différente.
Figure 6
Luminescence intensity as a function of time since irradiation, showing anomalous fading for sample SFU-O-227. Five aliquots were given a 150 Gy γ dose and heated at 120 °C for 16 h. The aliquots were measured 1.7 days after irradiation and at six subsequent times. Over this time period the luminescence decreased to about 88 % of its initial value. These data are used to determine the samples fading rate (g), which is in turn used to correct the optical age. If fading were not corrected for the optical age would be underestimated by ~20 %. I is the luminescence intensity measured in response to a short exposure to the excitation beam; I1 is the luminescence intensity measured 1.7 days after laboratory irradiation.
Intensité de la luminescence en fonction du temps écoulé depuis l’irradiation, montrant la décroissance anormale pour l’échantillon SF-O-227. Cinq portions aliquotes ont reçu une dose γ de 150 Gy et ont été chauffées à 120 °C pendant 16 h. Les portions aliquotes ont été mesurées 1,7 jours après irradiation et de nouveau 6 fois par la suite. Au cours de cette période, la luminescence a décru de 88 % environ de sa valeur initiale. Ces données servent à déterminer le taux de décroissance (g), qui à son tour sert à mesurer l’âge optique véritable. Si la décroissance n’était pas corrigée, l’âge optique serait sous-estimé d’environ 20 %. I représente l’intensité de la luminescence mesurée en réponse à une courte exposition à l’irradiation ; I1 représente l’intensité de la luminescence mesurée 1,7 jours après irradiation en laboratoire. La marge d’erreur est de 1σ.
List of tables
Table I
Sample locaties and sites, sample depths, concentrations of relevant radioisotopes used for dosimetry, and water
Sample’s depth beneath the ground surface.
K values were determined from a subsample of the sediment used for dating. Inhomogeneity was checked for by observing the K contents of sediment directly overlying and underlying the sample used for dating. Uncertainty in K content is ± 5%.
Water content = (mass water)/(dry minerals mass); water contents are the as-collected values; uncertainty used in the dose rate calculation is ± 15%.
Table II
Cosmic ray dose rates (Ḋc), total dose rates (ḊT), equivalent doses (De), fading rates, and optical ages
Aliquots used for thermal transfer correction were given a natural sunlight bleach instead of a red-infrared laboratory bleach.
Dose rate due to cosmic ray radiation, calculated using present burial depths.
Total dose rate, ḊT = ḊC+Ḋα, β, γ, where Ḋα, β, γ is the dose rate due to α, β, and γ radiation.
Optical ages, not corrected for anomalous fading.
Fading rates calculated from data collected between 1.7 and 641 days after laboratory irradiation; see the text for discussion. The fading rate (g) of 3.41 ± 0.41 %/decade was used to correct samples SFU-O-210 and –211, while the fading rate of 4.40 ± 0.33 %/decade was used to correct all the other samples.
Delay between laboratory irradiation and measurement.
Optical ages (before AD 2001), corrected for anomalous fading using the fading rates listed in the adjacent column. Uncertainties are analytical only, and are quoted as ±1σ.
The nature of the scatter in the normalized dose-response data (Fig. 5b) suggests that this sample contains grains that were not exposed to sufficient sunlight, and hence its age must be interpreted as an upper limit.
Note: If the updated β attenuation factor for Rb within a ~215 μm diameter K-feldspar grain reported by Readhead (2002) is used in the dose rate calculation instead of the one given by Mejhdal (1979) (see the text), the optical ages listed above increase by about 2%.