
Abstracts
Abstract
This paper provides the first analysis of aggregate raiding activity in Ontario by isolating raid applications from available certification data. Raiding in Ontario generally decreased over the 1975 to 2003 period save for the huge increases in 2000 and 2001 involving the CAW and SEIU. Bargaining units are significantly larger in raids, and legislative changes had little effect on aggregate raiding levels. Over most of the period raiding activity has been quite modest. Thus analyses of union organizing and its effect on union density are unlikely to be affected by leaving raids in the organizing data. An important exception occurs in 2000 and 2001, where the certification data seriously overstate new organizing. Corrected measures show that new (non-raid) union organizing continues to decline in Ontario. The decline in new organizing has been greater than the decline in raiding, resulting in an increased proportion of organizing due to raids in recent years.
Résumé
Parfois des syndicats vont chercher à organiser des travailleurs qui sont déjà membres d’un autre syndicat. Cette activité, qu’on appelle maraudage, fait l’objet d’une controverse. Seulement deux juridictions canadiennes, le Fédéral et la Colombie-Britannique, publient de l’information sur ce sujet. Cet essai vient corriger cette lacune, du moins dans le cas de l’Ontario, en mettant au point une façon d’identifier les cas de maraudage en se basant sur les données de la Commission des relations du travail de l’Ontario (CRTO). Nous rendons compte d’un nombre de campagnes qui ont donné lieu à un vote de représentation, du nombre accueilli, et du nombre de salariés couverts au cours de la période d’avril 1975 à novembre 2003.
Des études antérieures d’organisation syndicale (ex., Martinello, 2000; Johnson (2002a, 2002b) utilisent des données publiées par la CRTO, qui incluent des tentatives de maraudage et qui surévaluent par conséquent le nombre de nouvelles campagnes et la venue des travailleurs sous la bannière syndicale. Pour contrer ce problème, nous avons soustrait les nouvelles observations de l’activité de maraudage des données publiées sur l’accréditation et nous n’avons ainsi retenu que les niveaux d’activité de maraudage impliquant seulement les nouveaux travailleurs. On y décrit aussi la législation qui encadre le maraudage et nous l’utilisons comme une base dans une simple analyse des niveaux absolus et relatifs du maraudage.
Le nombre de tentatives de maraudage qui ont donné lieu à un vote, le succès obtenu et le nombre de salariés impliqués sont présentés au tableau 1 et aux figures 1 et 2. Les niveaux d’activité de maraudage et leur succès sont modestes et déclinent légèrement à travers l’échantillon, sauf une exception importante : l’explosion de cette activité au cours des années 2000 et 2001, attribuable aux Travailleurs canadiens de l’automobile (TCA) qui ont accaparé plusieurs unités locales de l’Union internationale des employés de service (UIES). Puisque les maraudages de la TCA-UIES ne représentent actuellement qu’un seul maraudage extrêmement vaste et puisque les grands nombres impliqués infléchissent l’échelle et l’analyse des autres maraudages, ces cas TCA-UIES sont retirés de quelques tableaux et de l’analyse. L’analyse a été complètement reprise avec les cas TCA-UIES inclus et alors les résultats empruntent des directions prévisibles. Par exemple, quand les cas TCA-UIES sont inclus dans les figures 1 et 2, des pointes très larges apparaissent dans toutes les variables au cours des années 2000 et 2001.
L’analyse de régression confirme la tendance à la baise de l’activité de maraudage au cours de la période de l’échantillon (en excluant les cas TCA-UIES) et nous en venons à la conclusion que les modifications à la législation du travail, la coordination des conventions dans l’industrie de la construction, les effets particuliers du mois et le cycle économique ont peu d’effet sur l’ensemble de l’activité de maraudage.
Les données de la figure 3 confirment le fait que les niveaux d’activité de maraudage sont aussi modestes quand on les mesure en retenant leur part de l’activité d’organisation syndicale dans son ensemble. Les maraudages tentés et suivis d’un succès comptent pour approximativement 5 % des tentatives, alors que le nombre des salariés dans les maraudages est de l’ordre de 10 % de tous les salariés impliqués dans les accréditations accordées. Les unités d’accréditation qui ont fait l’objet d’un maraudage apparaissent beaucoup plus vastes que les autres unités accréditées. L’analyse de régression montre que les proportions des tentatives de maraudage répertoriées dans la figure 3 présentent des tendances positives minimes, mais significatives, lorsqu’on exclut les variables relatives aux modifications de la législation. Alors, présentée dans des termes simples faisant état de moyennes au cours de la période, l’activité de maraudage a diminué, sauf les cas TCA-UIES en 2000-2001. Cependant, le nombre de tentatives d’organisation syndicale sans égard au maraudage a décru d’une façon plus rapide, de sorte que la proportion des maraudages s’est accrue légèrement.
L’analyse de régression du rapport des tentatives de maraudage sur celles de l’organisation syndicale sans recourir au maraudage reproduite au tableau 2 démontre que les tentatives de maraudage ont diminué (en relation avec les tentatives d’organisation sans maraudage); cela après l’élection du NPD et l’adoption du projet de loi 40. Le résultat n’apparaît pas statistiquement significatif à un seuil de 5 %, mais il s’y rapproche. Les données démontrent que le rapport a chuté parce que le nombre de tentatives de maraudage donnant lieu à un vote avec succès au cours de la période 1991-1992 a diminué. Le nombre de tentatives d’organisation syndicale sans recours au maraudage a augmenté considérablement au cours de la période 1993-1995. L’augmentation de ces activités d’organisation est probablement due à l’extension des droits de représentation syndicale aux salariés auparavant exclus de ces activités et l’accès plus facile à un tiers au cours d’une activité d’organisation syndicale sous l’égide du projet de loi 40. L’adoption du projet de loi 7 à la fin de l’année 1995 n’a pas eu d’effet perceptible sur le rapport maraudage non-maraudage. En établissant une moyenne pour la période allant de novembre 1995 à décembre 2000, les deux types d’activité d’organisation ont diminué en nombre lorsqu’on les compare à celles des années antérieures. Alors, les votes obligatoires de représentation pour les tentatives d’organisation sans maraudage, en vertu du projet de loi 7, n’ont pas causé de glissement vers plus d’activités de maraudage qui elles ont toujours fait l’objet de votes exigés. La figure 3 laisse peut-être apparaître un glissement au cours de la première partie de la période, mais pas dans la dernière, non plus pour la moyenne de la période. Le tableau 2 montre aussi que l’adoption du projet de loi 139 (en janvier 2001) a été suivie par une augmentation statistiquement significative du rapport des activités de maraudage sur les activités d’organisation sans maraudage, même quand on exclut les cas TCA-UIES. L’augmentation s’est produite en grande partie à cause du déclin remarquable des activités d’organisation sans recours au maraudage.
Les figures 4, 5 et 6 font état du total des activités d’organisation de maraudage et de non-maraudage au cours des années 1985-2003. Encore là, les données montrent de petites quantités d’activités de maraudage au cours de la plupart des années, de sorte que nous pouvons prétendre que les études sur les activités d’organisation syndicale et leur succès, leur effet sur la densité syndicale, ne seront pas influencées de façon considérable si on inclut dans les données celles qui ont trait au maraudage. Une exception importante, cependant, se présente au cours des années 2000-2001, où les données totales sur les accréditations surestiment les nouvelles activités d’organisation syndicale et elles doivent être corrigées pour éviter des conclusions qui ne seraient pas justes au sujet des tentatives d’organisation syndicale et leur effet sur la densité syndicale. Lorsque les cas de maraudage sont retirés, les données montrent de façon évidente que l’activité d’organisation syndicale en Ontario a continué à décliner au cours des dernières années.
Resumen
Este documento realiza el primer análisis de conjunto de la acción directa sindical en Ontario observando separadamente las acciones directas a partir de los datos de acreditación disponibles. La acción directa en Ontario que en general disminuyó en el periodo 1975-2003 protege renace con el inmenso aumento en los años 2000 y 2001 implicando la CAW y el SEUI. Las unidades de negociación son significativamente más grandes en la acción directa y los cambios legislativos han tenido poco efecto en los niveles globales de acción directa. En la mayor parte del periodo, la cantidad de acciones directas ha sido más bien modesta. Así, los análisis de la organización sindical y su efecto en la densidad sindical no parecen estar afectados por el resurgimiento de la acción directa en los datos concernientes a la organización. Una excepción importante acontece en los años 2000 y 2001, en que los datos de acreditación exageran gravemente el nuevo impulso organizacional. Las medidas corregidas muestran que el nuevo impulso (no huelguistico) de organización sindical continúa su deterioro en Ontario. El declive del nuevo impulso organizativo ha sido mayor que el declive de la acción directa, dando como resultado una proporción creciente de organización ligada a las acciones directas de los últimos años.
Article body
Unions sometimes try to organize workers who are already represented by another union. This activity, popularly referred to as raiding, is important for at least three reasons. First, it is controversial and often attracts negative attention from the media since it pits one union against another. The public perception of unions is important because it affects unions’ ability to function effectively for their members and to organize new workers. Second, raiding activity employs scarce union resources that could have been used for other purposes; for example, organizing workers who are not already represented by a union, servicing the union’s existing membership, or even returning those resources to members in terms of lower dues payments. The third reason is addressed in this paper; namely, that raiding activity obscures the amount of union organizing that is directed towards unorganized workers. Thus it is difficult to know how many new workers or bargaining units are actually being added to unions’ ranks through organizing, and their subsequent effects on union density.
Given the effects noted above, it is important to know how much raiding activity is occurring. Unfortunately only two Canadian jurisdictions, the Federal and British Columbia, report any data on the levels of raiding activity and success. This paper ameliorates this deficiency for Canada’s largest jurisdiction, Ontario, by devising a method for identifying the amounts of raiding activity and success from data published in the monthly reports of the Ontario Labour Relations Board (OLRB). We report on the number of raid applications that proceeded to a representation vote, the number that were granted, and the number of employees covered in the successful campaigns in Ontario, monthly, from April 1975 to November 2003. We show that the levels of raiding activity and success have been fairly modest and declining slightly over the period, with the notable exception of an explosion of activity in 2000 and 2001 resulting from the Canadian Auto Workers (CAW) takeover of several locals of the Service Employees International Union (SEIU).
Earlier work on union organizing activity and success in Ontario (see, for example, Martinello, 2000, and Johnson, 2002a and 2002b) has used published OLRB sources to estimate the effects of labour legislation, the political environment and economic conditions on organizing activity and success and has extended the analysis to consider the impacts upon and possible future trends of union density.[1] Unfortunately, the published OLRB data do not differentiate between raid and non-raid organizing campaigns. Thus, the data overstate the amount of organizing directed at unorganized employees and the inflow of new workers into union membership through certifications. The analyses in the literature usually noted this problem with raiding activity but could do nothing to correct it, given the data available at the time.[2] This paper addresses this problem by subtracting the new measures of raiding activity from the certification data published in the OLRB Reports and reporting the levels of organizing activity directed at previously unorganized workers. Specifically, we report the number of certification applications granted and dismissed, the number granted, and the number of employees covered in certifications granted for only those organizing campaigns directed at workers not already represented by a union.
In addition we present a short summary and history of the legislation that governs raiding. Regression analysis is used to investigate how the absolute levels of raiding activity and the ratios of raiding to non-raiding organizing activity changed over time and in response to changes in the legal and political framework in Ontario over the period of the sample.
Most of the literature on union raiding deals with the United States.[3] Martinello, Hanrahan, Kushner, and Masse (2003) provide a very brief summary of the US literature. For Canada, Riddell (2002) presents an analysis of raid applications in British Columbia, and Martinello et al. (2003) examine the relationship between raids and firm performance in the Ontario, British Columbia and Federal jurisdictions. There are a few Canadian studies focusing on raiding activities of specific unions, including Stocks’ (1985) analysis of raiding among British Columbia’s major mining, smelting and metal industry unions in the 1970’s and Roberge’s (1969) analysis of raiding and rivalry in Quebec. Perlmutter (2004) reports on the organizing and raiding activities of the CAW and a comparison group of seven other unions in Ontario for the period 1998 to March 2003 and Gilson and Spencer’s (1987) review of 14 unions reveals that, on average, raids and mergers tended to involve much larger groups of workers than average certification drives pertaining to previously unorganized workers. Other qualitative studies provide some limited evidence concerning union leaders’ perceptions of raiding dynamics and case studies (Kumar and Ryan, 1988). To our knowledge, there is no previous analysis of aggregate raiding activity in Ontario.
The Legal Regulation of Raid Activity in Ontario
The OLRB refers to raids as displacement applications and they are essentially applications for certification where an incumbent union already holds bargaining rights to the bargaining unit in question. Thus raid applications must meet all of the normal requirements of certification applications, with the most important being that the applicant (raiding) union must establish that it has sufficient support amongst employees in the bargaining unit by disclosing such membership evidence to the Board.
In addition, other requirements are imposed on raid applications. One concerns the timing of applications. The specific rules are complex but, in general, a raid application can only be filed in the following periods: [4]
at least one year after the original certification[5] if there is no collective agreement, work stoppage, or conciliation in place; or
at least 30 days after the completion of the conciliation process,[6]
at least six months after the start of a lawful strike,[7] or
where a collective agreement is in place, during an “open period” which is generally towards the end of the collective agreement. At the time of writing, the open period is the last 3 months of the term of the collective agreement. For collective agreements longer than three years, the open period is the 3-month period before the third and every subsequent anniversary date of the collective agreement.
Another requirement on raid applications is that, in practice, the Board has always ordered a representation vote, even during periods when automatic certification was available in normal certification applications.[8] The only choices on the ballot are the applicant union and the incumbent union, and the majority of votes cast decides the issue. Unlike in the United States, there is no option for ‘no union’ on the ballot, so a raid application is not transformed into an application for the termination of bargaining rights.[9]
Other Canadian jurisdictions generally treat raid applications in a similar manner. Raid applications must meet all of the requirements applying to certification applications in that jurisdiction but the applications may only be filed in specified time periods. The timing rules are complex and the specific definition of the open period varies across every jurisdiction. What is common is that each jurisdiction restricts raids for some time following the initial certification or voluntary recognition, and each typically also restricts raids during the term of existing collective agreements to specific intervals of approximately 1–3 months.
Since raid applications are treated as certification applications, changes in certification procedures affect raids. From July of 1975 to December 1992 there were no significant changes to certification procedures in Ontario outside of the construction industry. The only possible exception is the introduction of First Contract Arbitration in May of 1986 which changed some of the timing rules for a small subset of raid applications falling around the time of First Contract Arbitration applications, but this is unlikely to have had any significant effect on raid activity.[10]
Several significant changes to the rules for certifications came into force in January of 1993 under the NDP government’s Bill 40.[11] These included a reduction in the minimum level of support from 45% to 40% of the bargaining unit, extending coverage to employees who were previously excluded from union representation, changes in the Board’s reaction to unfair labour practices, and increased access to third party property for organizing.
In November of 1995, the last three changes listed in the previous paragraph were reversed by the Progressive Conservative’s Bill 7 legislation.[12] Bill 7 also extended the ban on unions re-applying for certification after a failed or withdrawn application to one year. Finally, Bill 7 made representation votes mandatory in every application, but this would have had no direct effect on raids since votes were already (effectively) mandatory.[13]
In late December of 2000, Bill 139 came into effect in Ontario and it brought two further changes.[14] First, the one-year ban on organizing after a failed or withdrawn certification application was extended to all unions. Second, the open period within collective agreements was extended from two months to three months.
Changes in the labour legislation covering the construction industry also affected the rules governing raid applications. In 1977, collective bargaining in the large Industrial, Commercial and Institutional (ICI) sector was coordinated so that all organized employees were covered by province wide collective agreements which expired biannually, starting from April 30, 1978.[15] As a result, the open period for raids occurred at the same time for all bargaining units: namely, March and April of every second year. The 1977 legislation also placed some restrictions on which unions could represent which workers (based mainly on historical craft boundaries) thereby limiting the pool of potential raiding unions.[16]
The province wide agreements in the ICI sector were extended to a three-year duration in 1991, so they would expire triennially from April 30, 1992.[17] As a result, the open periods contracted from two months every two years to two months every three years after April 30, 1992.[18] In 2000, Bill 69 imposed a new requirement that all collective agreements in the residential sector of the construction industry would expire according to the same schedule as the ICI sector.[19] This created a common open period for these two sectors within the construction industry. Also in 2000, as noted above, Bill 139 extended the open period in every collective agreement from two to three months. [20]
Data
The data are collected from the results of every certification application published in the formerly monthly, but now bimonthly, Ontario Labour Relations Board Reports over the period April 1975 to November 2003. The OLRB data does not identify the raid certification applications directly. However the published descriptions of the outcomes allow us to determine which applications were raids. A certification application listing in the Reports is a raid if it meets the following three conditions:
The decision lists another union as an intervener in the application. In raid applications, the incumbent union is always listed as an intervener and in some cases, the vote results actually refer to the intervener union as the incumbent union.
A representation vote was held.
The results of the representation vote show that the employees had the option of voting for the applicant union or the intervener union, but the employees did not have the option of voting for ‘no union’.
Since a vote was always held in displacement applications, requiring evidence of a representation vote with both the applicant and intervener union on the ballot (i.e. requiring the second condition) captures all of the raid applications that progressed to a vote and it prevents the inclusion of applications where the intervener union is just an interested third party. Non-raid certification applications that involved more than one union would also have an intervener union and there would also be multiple unions on the ballots if a representation vote was held. But these non-raid cases would also have the option of ‘no union’ on the ballot. Thus they would violate the third condition and they are not counted (mistakenly) as raids. OLRB personnel confirm that this is the most accurate of available methods for identifying and isolating raids in the Ontario certification data (Stelmacszinski, 2003).
Raid applications that were withdrawn by the union before a representation vote was held cannot be identified as raids using the method above, and so they are excluded from the data. All withdrawn certification applications are therefore excluded from the analysis that follows to keep the data comparable.[21] This exclusion does not affect the number of applications granted or the number of employees covered by successful organizing campaigns, but it does affect the number of applications disposed and success rates. There is, however, good reason for excluding the withdrawn applications from both the raid and non-raid data, aside from data availability problems. Many raid and non-raid applications are withdrawn for purely technical reasons (e.g. errors or omissions in the application) and then re-submitted in the same or next month.
The raid and non-raid organizing data are shown in the table and figures below. All of the data (monthly, calendar year aggregates, or fiscal year aggregates) are available from the authors.
Raids in Ontario
Table 1 shows the total number of raid applications granted and dismissed by the OLRB, the number granted, and the number of employees covered in raids granted, by calendar year, over the sample period. Table 1 also shows the success rate for raid applications, which equals the percentage of raid applications proceeding to a vote that were granted. The success rate for raids varies significantly from year to year, likely due to the small numbers of raid applications, and it is slightly lower than the success rate for non-raid certification applications when averaged over the whole sample period.[22] However, the difference in success rates is not statistically significant at conventional confidence levels using a two sample t-test.
Table 1 shows extremely high levels of raiding activity in 2000 and 2001. This huge increase occurred when eight large Canadian SEIU locals tried to become affiliated with the CAW. The locals were unable to switch to the CAW en masse, so the CAW proceeded to raid the individual bargaining units within the locals.[23] The last two columns of Table 1 show the number of applications and the number of employees involved in those CAW raids of the SEIU. Since these raids actually represent just one extremely large raid, and since the large numbers involved skew the scale and analysis of the other raids, these CAW/SEIU cases are omitted from some of the analysis that follows. However, short descriptions of the results when those CAW/SEIU cases are included are reported below.
Figure 1 shows the number of raid applications granted and dismissed, and the number granted, excluding the 2000/01 CAW/SEIU cases, for each month from April 1975 to November 2003. The small circle markers connected by grey lines show the actual number of raids granted each month. The thicker dark lines show smoothed values which average out the month to month variations.[24] The year ticks on the horizontal axis mark January of that year. Note that the vertical distance between the two smoothed series does not change notably over the sample period. This confirms the data in Table 1 showing that the success rate for raid applications did not change significantly over the period, although it was highly variable.
Table 1
Raid and Non-Raid Certifications in Ontario

* 1975 covers only April to December 1975. 2003 covers only January to November 2003.
Figure 1
Number of Raid Applications, no 2000/01 CAW/SEIU
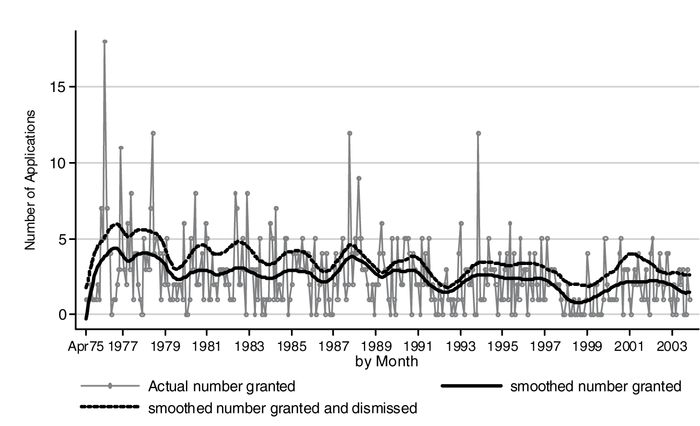
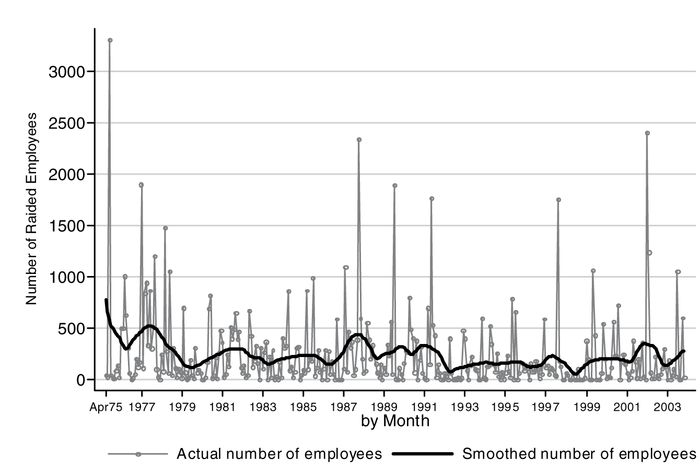
Figure 2 shows the number of employees in the raid applications granted using the same horizontal axis and marking for the series. Both figures tell essentially the same story about raids in Ontario, which suggests that there has been no significant trend in the size of raided bargaining units. The most important result shown in Figures 1 and 2 is that, over most of the sample period, there have been only modest amounts of raiding in Ontario. Most months have five or fewer raid applications proceeding to a vote and the raids granted cover fewer than 200 employees. Further, the numbers of raids and employees covered are at or very close to zero in many months. The big exceptions, of course, are the CAW/SEIU raids in 2000 and 2001. If they were included, there would be extremely large spikes in all of the variables of both graphs over 2000 and 2001.
Regression analysis on the data excluding the 2000/01 CAW/SEIU event shows that the number of raids granted and dismissed, the number granted, and the number of employees covered in raids granted all have negative trends that are small but statistically significant. Thus the amount of (non-CAW/SEIU) raiding has been declining slightly, on average, over the period of the sample. All of the relevant changes in labour legislation (i.e. Bill 40, Bill 7, and Bill 139) occur in the latter half of the sample, so dummy variables corresponding to those changes all take their values of one in the latter half of the sample. Thus, if the dummy variables for legislation changes are included in regressions with no trend term, they all show negative (and almost always statistically significant) effects.[25] We remain unconvinced, however, that the decrease in raiding activity is due to the specific changes in legislation and is not just part of an overall declining trend which goes back to the 1970s. If the legislation dummy variables are included with a trend term, all but one of the legislation coefficients switch sign (to positive) and most become statistically insignificant. The trend term in this case remains negative and significant (albeit at the 10% level in some specifications) in the numbers of applications equations, but negative and insignificant in the number of employees equation.
Figure 2
Number of Employees in Raids Granted, no 2000/01 CAW/SEIU
We also investigate whether the coordinated open periods in the construction industry affect raiding activity. A dummy variable which equals one in the coordinated open periods and one or two of the subsequent months (to allow time for the applications to be processed by the OLRB) is included in the regression equations. A positive coefficient could represent an increase in raiding or just a change in the timing with the same number of raids now concentrated in the common open period. The interpretation is not an issue in this case, however, because the estimated effects in the open and subsequent months are consistently very small and very insignificant. The coordinated open periods in construction had no discernable effect on aggregate raiding levels.
The regression results cited above (and below) are all very robust to different specifications, including variables for monthly changes in Ontario employment lagged up to three months, and monthly dummy variables.[26] The actual numerical values of the estimates for the various regression specifications are not included for brevity and because the overall results are more easily summarized in words, but we are happy to provide them to interested readers.
If the 2000/01 CAW/SEIU cases are included, the results of the analysis change in the predictable ways. Again, the graphs of the number of raid applications and number of employees covered (i.e. the corresponding versions of Figures 1 and 2) all have extremely high spikes in the years 2000 and 2001 which dwarf all of the other variations in the data. Similarly, the regression analysis shows that raiding activity is generally ‘U’ shaped with no simple trend. The estimated coefficients on the dummy variables representing the November 1995 and December 2000 changes in legislation (Bill 7 and Bill 139) are much larger because both dummy variables cover part of the period of increased activity. In some specifications the estimated effect of the Bill 40 legislation is much smaller than with the CAW/SEIU cases excluded. This occurs because the 1993–95 period for Bill 40 is close to the middle of the sample and therefore close to the bottom of the ‘U’. But, overall, we do not feel that the regression analysis yields any meaningful results other than identifying the overall trends in the data.
It is interesting to consider whether raiding has increased or decreased as a proportion of total organizing.[27] Figure 3 shows the smoothed proportion of certification applications granted and dismissed that were raids and similar series for applications granted and number of employees in applications granted, all with the 2000/01 CAW/SEIU cases removed. Figure 3 reports a shorter time series because the monthly total certification data only cover 1985 to 2003 and those data are required to calculate the proportion of raids.
Figure 3
Raids as a Proportion of Certification Activity, no 2000/01 CAW/SEIU
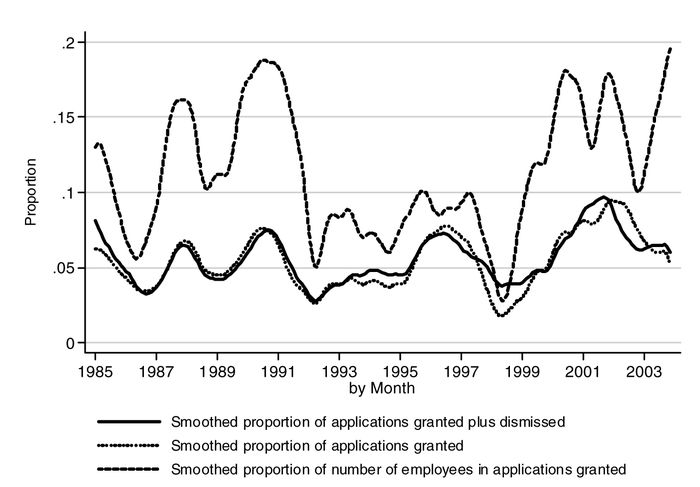
Figure 3 confirms that the amount of raiding in Ontario has been quite modest over the period shown. Attempted and successful raids comprise roughly 5% of the total numbers of applications attempted and granted. Figure 3 also shows that the number of employees in raids accounted for about 10% of the number of employees in all certifications granted. This confirms Gilson and Spencer’s (1987) finding that raided bargaining units tend to be much larger than other certified units. The average bargaining unit size in each month (i.e. the number of employees covered divided by the number of certifications granted in that month) was calculated to obtain a numerical measure of the difference. Over the period of the sample, the median average monthly bargaining unit size is 34.2 employees for non-raid certifications granted and 59.2 employees for raids granted. The difference in the averages (over the sample) of the average monthly bargaining unit sizes is even larger (38.4 versus 90.7). The differences in the means and medians are overwhelmingly statistically significant using a t-test and a non-parametric 2-sample test for medians. Again, with the 2000/01 CAW/SEIU cases included, Figure 3 changes in the predictable way, showing very large spikes in all of the series for those years.
Regression analysis shows that the proportions of raid applications plotted in Figure 3 have small positive and statistically significant trends if no variables for legal changes are included. Thus, in simplest terms and averaged over the whole period, raiding activity (as measured by applications) has been decreasing (save the 2000/01 CAW/SEIU experience) but, as will be shown below, the amount of non-raid organizing has been decreasing more quickly so the proportion of raids has increased slightly.
The smoothed series in Figure 3 also show that the proportion of raids started to decrease sharply after the election of the NDP government in September of 1990. Thus another dummy variable, representing the period of NDP governance before the passage of Bill 40, is included in the regression analysis that follows to capture this effect.
Table 2 shows regression results where the dependent variable is the ratio of raid to non-raid organizing activity and the 2000/2001 CAW/SEIU cases are excluded. The ratio, rather than the proportion of all organizing activity (as in Figure 3), is used to increase the variability of the dependent variable and, therefore, sharpen the regression results. Table 2 shows that raid applications did decrease (relative to non-raid applications) after the election of the NDP and the passage of Bill 40. The result is not statistically significant at the 5% level in any of the cases, but it is significant at the 10% level for the impact of the initial election of the NDP and for the number of applications granted. Examination of the data shows that the ratio dropped over the NDP period because the number of raid applications proceeding to a vote and granted dropped over 1991 and 1992, while the number of non-raid applications increased in the 1993 to mid 1995 period. The increase in non-raid organizing was likely aided by the extension of union representation rights to groups of employees who were previously excluded from organizing and the greater access to third party property for organizing given by Bill 40.
According to Table 2, the passage of Bill 7 had no discernible effect on the ratio of raid to non-raid applications. Averaged over the November 1995 to December 2000 period, both raid and non-raid organizing activity decreased compared to earlier years. Thus, the mandatory representation votes for non-raid applications imposed by Bill 7 did not cause a switch to more raiding activity which had always required the votes. Figure 3 suggests that there may have been a switch in the early part of the period but not in the latter part and not averaged over the whole sample.
Table 2
Regression Results Ratio of Raid to Non-Raid Organizing Activity

* and ** represent statistically significant at the 10% and 5% levels, respectively.
Absolute value of t-statistics calculated from Newey-West standard errors are shown in parentheses.
Monthly dummy variables and the Ontario rate of change of employment for 1, 2, and 3 month lags were also included in the regressions, but are not reported here. The 2000/2001 CAW/SEIU cases are excluded.
The regression estimates in Table 2 show that the passage of Bill 139 (January 2001) marked a statistically significant increase in the ratio of raid to non-raid organizing applications, even with the CAW/SEIU cases excluded. The increase in the length of the open period may have contributed since raiding activity did increase compared to the earlier period, but it is not the most important factor. The large increase in the ratio occurred mainly because of the very large drop in the levels of non-raid organising activity that occurred over this period.
The proportion of employees covered in raids (excluding the 2000/01 CAW/SEIU cases) is extremely variable over the sample period and the regression analysis yields no statistically significant inferences about its behaviour. In fact, the hypothesis that all of the coefficients on the non-constant explanatory variables equal zero could not be rejected with an F-test in any of the specifications.
If the 2000/01 CAW/SEIU cases are included, then the results of the regression analysis change in the manner one would expect. There is a big increase in the proportions near the end of the sample so the upward trend in the ratio of raid to non-raid activity becomes stronger. The estimated coefficients on the dummy variables for Bill 7 and 139 become much larger, but none of the inferences are changed significantly.
Non-Raid Organizing Activity
Table 1 shows the number of non-raid certification applications granted and dismissed by the OLRB, the number of non-raid certification applications granted, and the number of employees covered in those non-raid certifications, annually, for the period January 1985 to November 2003. Figures 4, 5, and 6 show the monthly levels of union organizing in Ontario and the effects of raiding activity on the organizing data. The circle markers in Figure 4 show the actual number of non-raid certification applications granted and dismissed by the OLRB and the solid line shows smoothed values of that series. The short dashed line in Figure 4 shows the smoothed number of granted and dismissed certification applications when raids are included, including the 2000/01 CAW/SEIU cases. Figures 5 and 6 show the corresponding series for the number of certification applications granted and the number of employees covered in certifications granted. Again, the number of applications and the number of employees all show essentially the same results.[28]
Union organizing, by any of the measures, shows a strong downward trend over the period 1985 to 2003. The increase in organizing occurring with the NDP government and Bill 40 (1991–95) and the sharp decrease that followed with the PC government, Bill 7 and Bill 139 have been identified in the literature and they are shown very clearly in Figures 4, 5, and 6.[29] Regression analysis easily confirms that these effects are statistically significant.
Figure 4
Raids and Non-Raid Certification Applications: Granted plus Dismissed

Figure 5
Raid and Non-Raid Certifications Granted
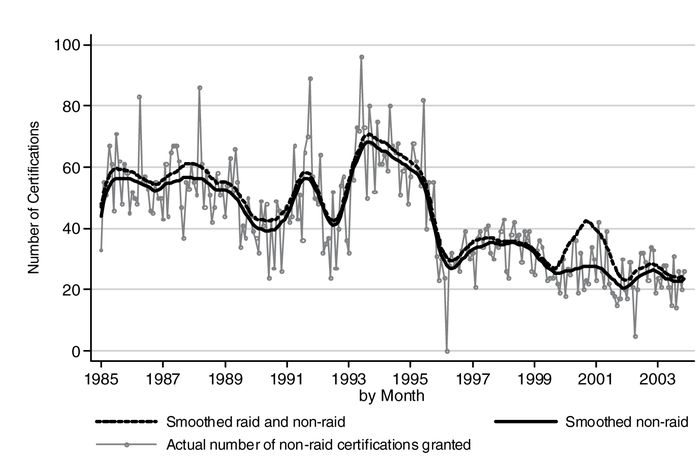
Figure 6
Number of Employees in Raid and Non-Raid Certifications Granted

The graphs confirm that raiding activity was modest in Ontario over the period, with the important exception of the CAW takeover of the SEIU bargaining units in 2000 and 2001. The numbers of non-raid applications and employees track their total (raid and non-raid) counterparts fairly closely and show basically the same increases and decreases over all of the sample period except 2000 and 2001. Thus the combined raid and non-raid data should provide reasonably accurate inferences about changes in the levels and success of organizing directed at uncovered workers over that period. Inferences about the effects of organizing on union density should also be reasonably accurate since raid and non-raid organizing overstate new organizing by only small amounts for most of the period. But for 2000 and 2001, the combined raid and non-raid organizing data provide very misleading signals. The data show a major revival in all measures of union organizing, when the true levels continued to fall. Any analyses of new union organizing or its effects on union density must correct the published OLRB data for the raiding activity occurring in those years.
Conclusion
This paper reports on raid and non-raid union organizing in Ontario. Unfortunately, data on raiding activity in Ontario is not published by the OLRB (or any other source), so the published results of all certification applications and representation votes were examined to calculate the levels of raiding activity. We show that raiding, as measured by number of raid applications or the number of employees covered in raids granted, generally decreased over the 1975 to 2003 period, with the exception of very large increases in activity in 2000 and 2001. We also show that the bargaining units in raids granted are much larger than in non-raid certifications.
Over most of the 1975 to 2003 period, the levels of raiding activity were quite modest. 2000 and 2001 is the major exception and raiding activity was quite high in those years. When raids are measured as a proportion of total organizing, or as a ratio of raid to non-raid organizing, the same basic conclusion emerges. Excluding the 2000/2001 spike in activity, one finds that raiding’s share of total organizing was low but not constant over the period studied. Regression analysis shows that the ratio of raid to non-raid certification applications decreased during Ontario’s NDP government (roughly 1991 to 1995) and that it increased after the Progressive Conservative government’s Bill 139 (in late 2000), although some of these changes were statistically significant at only the 10% level. Averaged over the period of the sample, the ratio of raid to non-raid organizing activity increased over time. As noted above, raiding activity generally decreased over the sample but non-raid organizing decreased even more.
Based on the data, we contend that analyses of organizing activity or success, and their implications for union coverage or density are unlikely to be affected greatly by including raids in the organizing data for periods before 2000. Analyses that cover the 2000 to 2001 period, however, cannot ignore the effects of raiding activity. The numbers of employees and applications involved in the movement of a significant number of Canadian based SEIU locals to the CAW are very large compared to the levels of organizing activity directed at unorganised workers. Thus total organizing data seriously overstate the amount of new union organizing and the data must be adjusted to avoid incorrect inferences about organizing and its implications for union density. Once raid cases are removed, the data show clearly that union organizing in Ontario has continued to decline in recent years.
Appendices
Remerciements
We would like to thank Heather McCutcheon for excellent research assistance and Kevin Jenkins from the Ontario Workplace Tribunals Library for assistance with the data. Martinello gratefully acknowledges financial support from SSHRC standard research grant # 410-2001-1232.
Notes
-
[1]
Johnson (2002a) and (2002b) actually studies the sum of the provincial and federal jurisdictions (save PEI) in her analysis. But Ontario is included in her work and it is, by far, the largest jurisdiction.
-
[2]
Bartkiw (2005) is an exception. Slinn (2003) also performs certain data “cleaning” in an attempt to remove raid files, but her correction process also removes cases involving more than one bargaining unit and/or more than one representation vote.
-
[3]
See, for example, Krislov (1954) and (1955), Chaison (1973) and (1976), Odewahn and Scott (1989), and Troy (1960).
-
[4]
See Sack and Mitchell (1997-), pp. 3.231.3 – 3.269.
-
[5]
If there is a bona fide voluntary recognition agreement instead, the raid application may only be filed one year after the signing of the agreement.
-
[6]
For the full set of restrictions on timing in relation to the conciliation process, see subsections 67(1) and 67(2) of the Labour Relations Act, 1995, S.O. 1995, c. 1.
-
[7]
For the full set of restrictions on timing in relation to lawful strikes, see subsection 67(3) of the Labour Relations Act, 1995, S.O. 1995, c. 1.
-
[8]
Canadian John Wood Manufacturing Co. Ltd., 46 ¶ 16,449; Evans Lumber and Builders Supply Ltd., 58 CLLC ¶ 18,117; Thomas Fuller Construction Co. (1958) Ltd., [1963] OLRB Rep., May 108; York Board of Education, [1988] OLRB Rep., Jan. 106.
-
[9]
See J. Sack and M. Mitchell, supra, p. 3.31. See also Campeau Corp. Ltd., [1972] OLRB Rep. Feb 167; Laura Secord, [1980] OLRB Rep. Mar. 334.
-
[10]
S.O. 1986, c. 17.
-
[11]
S.O. 1992, c. 21.
-
[12]
See Labour Relations Act, 1995, Sch. A., S.O. 1995, c. 1.
-
[13]
Bill 40 and Bill 7 also changed the timing rules that apply when there is an application for first contract arbitration and when there is voluntary recognition and/or a voluntary recognition agreement. Both of these events are fairly rare, however, so the changes are unlikely to have had a significant effect.
-
[14]
Labour Relations Amendment Act, 2000, S.O. 2000, c. 38.
-
[15]
S.O. 1977, c. 31, s. 3.
-
[16]
There is also some provision enabling construction unions that are not included in the provincial designation scheme (such as the Christian Labourers Association of Canada) to certify employees in that sector. See s. 158 (4) of the Labour Relations Act, 1995. See also Clifford Restoration Ltd. [1999] OLRB Rep. Jan/Feb 4.
-
[17]
S.O. 1991, c. 56.
-
[18]
S.O. 1991, c. 56, s. 2.
-
[19]
Labour Relations Amendment Act (Construction Industry), 2000, S.O. 2000, c. 24.
-
[20]
Supra, note 10.
-
[21]
Over the period 1985 to 2003, withdrawn certification applications accounted for roughly 15% of all certification applications.
-
[22]
The average (median) of the annual raid success rates, 1975–2003 is 72.0% (74.5%). The average (median) of the annual non-raid certification success rates, 1985–2003 is 75.3% (76.9%). If the raid data are restricted to the years where annual certification data are available (1985–2003), the average (median) of the annual raid success rates is 73.8% (76.7%). Again, withdrawn applications are excluded from the data.
-
[23]
See, for example, Canadian Press Newswire, 2000, “Tug of war between CAW and SEIU shaking up house of labour.” Canadian Press Newswire, April 24 or Rennie, Gary, 2000, “CAW ranks to balloon; Service Employees International Union to join CAW – pending ratification vote.” The Windsor Star, February 21, p. A1.
-
[24]
The smoothed series consist of the predicted values from locally weighted linear regressions of the number raids, regressed on time. A separate regression is run for each observation (i.e. number of raids in that month) using data from (roughly) one year before and one year after the month. Shorter, uncentered subsets of data are used for the beginning and ending observations in the data.
-
[25]
The big exception is the dummy variable for the December 2000 changes (Bill 139) in the number of employees regression. In this case the estimated coefficient is negative but the estimated t-statistic is around -0.5. This is not surprising given the increase in the number of employees covered by raids in early 2002 shown in Figure 2. The other exception is the Bill 40 dummy variable in the number of raids granted regression. The estimated coefficient is negative but generally only significant at the 20% level in various specifications.
-
[26]
The regression analyses all use Newey-West standard errors that adjust for arbitrary heteroscedasticity and up to third order auto-correlation.
-
[27]
The quantitative analysis of raiding activity as a proportion of overall organizing activity, and the inquiry into the impact of labour law upon these patterns, was originally performed in an unpublished manuscript prepared by Timothy Bartkiw towards his doctoral dissertation. Much of the work in this paper builds upon material prepared in early drafts of a chapter of this doctoral dissertation.
-
[28]
The zero number for March of 1996 in Figures 4, 5 and 6 occurs because the Ontario government employees were on strike and the OLRB disposed of no applications in that month.
-
[29]
See, for example, Martinello (2000) for a more detailed analysis of the changes in organizing activity from 1987 to 1998.
References
- Bartkiw, Timothy. 2005. “Labour Law and Union Certification Success Rates in Ontario.” Proceedings of the Annual Canadian Industrial Relations Conference, June 2004, forthcoming.
- Chaison, Gary N. 1973. “The Outcomes of Multi-Union Representation Elections Involving Incumbents.” Public Personnel Management, 2 (5), 435–438.
- Chaison, Gary N. 1976. “The Frequency and Outcomes of Union Raids.” Industrial Relations, 15 (1), 107–110.
- Gilson, Clive H. J., and Ian Spencer. 1987. “Trade Union Growth: A Marketing Model.” Relations Industrielles/Industrial Relations, 42 (4), 756–773.
- Johnson, Susan. 2002a. “Card Check or Mandatory Vote? How the Type of Union Recognition Procedure Affects Certification Success.” Economic Journal, 112 (April), 344–361.
- Johnson, Susan. 2002b. “Canadian Union Density 1980–1998 and Prospects for the Future: An Empirical Investigation.” Canadian Public Policy, 28 (3), 333–351.
- Krislov, Joseph. 1954. “Raiding Among the ‘Legitimate’ Unions.” Industrial and Labor Relations Review, 8 (1), 19–29.
- Krislov, Joseph. 1955. “The Extent and Trends of Raiding Among American Unions.” Quarterly Journal of Economics, 55 (February), 145–152.
- Kumar, Pradeep and Dennis Ryan. 1988. Canadian Union Movement in the 1980s: Perspectives from Union Leaders. Kingston, Ontario: Industrial Relations Research Centre, Queens University.
- Martinello, Felice. 2000. “Mr. Harris, Mr. Rae and Union Activity in Ontario.” Canadian Public Policy, 26 (1), 17–34.
- Martinello, F., R. Hanrahan, J. Kushner, and I. Masse. 2003. “Union Raiding Activity and the Value of Canadian Firms: Do Unions Pick Stock Market Winners?” Canadian Journal of Administrative Sciences, 20 (2), 135–148.
- Odewahn, C. and C. Scott. 1989. “An Analysis of Multi-Union Elections Involving Incumbent Unions.” Journal of Labor Research, 10 (2), 197–205.
- Ontario Labour Relations Board. Annual. Ontario Labour Relations Board Annual Report. Toronto, Ontario: Government of Ontario.
- Ontario Labour Relations Board. March 1975 to January/February 2003. Ontario Labour Relations Board Reports. Toronto, Ontario: Government of Ontario.
- Perlmutter, Gary. 2004. “Against the Tide: CAW Organizing in Ontario from 1998–2003.” Mimeo. CAW/TCA Toronto.
- Riddell, Chris. 2002. “Union Raiding as a Disciplinary Device: Empirical Evidence from British Columbia, 1978–1998.” Mimeo. Center for Industrial Relations, University of Toronto.
- Roberge, Pierre. 1969. “Les conflits intersyndicaux au Québec (1957–1967).” Relations Industrielles/Industrial Relations, 24 (3), 521–558.
- Sack, J. and M. Mitchell. 1997–. Ontario Labour Relations Board Law and Practice, 3rd edition. Toronto: Butterworths.
- Slinn, Sara. 2003. Ph.D. Dissertation, Centre for Industrial Relations, University of Toronto.
- Stelmacszinski, Voy (Solicitor, Ontario Labour Relations Board). 2003. Interviews with Timothy Bartkiw, June 2003.
- Stocks, Alex. 1985. “Union Raiding: Rivalry in B.C. Mines, Smelters and Metal Industries.” Kingston, Ontario: Industrial Relations Research Centre, Queens University.
- Troy, Leo. 1960. “Local Independent and National Unions: Competitive Labor Organizations.” Journal of Political Economy, 68 (5), 487–506.
 10.7202/028044ar
List of figures
Figure 1
Number of Raid Applications, no 2000/01 CAW/SEIU
Figure 2
Number of Employees in Raids Granted, no 2000/01 CAW/SEIU
Figure 3
Raids as a Proportion of Certification Activity, no 2000/01 CAW/SEIU
Figure 4
Raids and Non-Raid Certification Applications: Granted plus Dismissed
Figure 5
Raid and Non-Raid Certifications Granted
Figure 6
Number of Employees in Raid and Non-Raid Certifications Granted
List of tables
Table 1
Raid and Non-Raid Certifications in Ontario
* 1975 covers only April to December 1975. 2003 covers only January to November 2003.
Table 2
Regression Results Ratio of Raid to Non-Raid Organizing Activity
* and ** represent statistically significant at the 10% and 5% levels, respectively.
Absolute value of t-statistics calculated from Newey-West standard errors are shown in parentheses.
Monthly dummy variables and the Ontario rate of change of employment for 1, 2, and 3 month lags were also included in the regressions, but are not reported here. The 2000/2001 CAW/SEIU cases are excluded.