
Abstracts
Abstract
This paper develops and applies several meta-analytic techniques to investigate the presence of publication bias in industrial relations research, specifically in the union-productivity effects literature. Publication bias arises when statistically insignificant results are suppressed or when results satisfying prior expectations are given preference. Like most fields, research in industrial relations is vulnerable to publication bias. Unlike other fields such as economics, there is no evidence of publication bias in the union-productivity literature, as a whole. However, there are pockets of publication selection, as well as negative autoregression, confirming the controversial nature of this area of research. Meta-regression analysis reveals evidence of publication bias (or selection) among U.S. studies.
Résumé
Quels sont les critères de sélection des études publiées ? Est-ce exclusivement la qualité de la recherche menée ? Si les travaux de recherches ont d’autant plus de chance d’être publiés que leurs résultats sont significatifs, alors on court le risque d’introduire un biais, appelé biais de publication. Un biais de publication peut apparaître lorsque la sélection des études s’opère sur le degré de significativité statistique des résultats ou lorsque les résultats confortent toujours les mêmes hypothèses théoriques. L’objectif principal des investigations empiriques consiste à renforcer une théorie en éliminant d’autres théories en concurrence. Malheureusement, les résultats empiriques peuvent ne pas refléter la réalité mais en donner une vision déformée en ne publiant que les travaux en faveur d’une théorie unique.
Le problème du biais de publication a suscité l’intérêt de nombreux chercheurs, notamment en psychologie et en médecine (c.f. Begg et Berlin, 1988). Plus récemment, les économistes ont commencé à s’intéresser à cette question (Card et Krueger, 1995 ; Ashenfelter, Harmon et Oosterbeek, 1999 ; Gorg et Strobl, 2001) et ont montré que les revues en sciences sociales et économiques avaient également tendance à un certain degré de publication sélective. À notre connaissance, il n’existe pas d’études spécifiquement dédiées au problème du biais de publication dans le domaine des relations industrielles. Ceci est d’autant plus surprenant que ce champ d’étude est l’un des plus controversé en sciences sociales. De nombreux aspects du travail et de l’emploi sont fortement discutés par les chercheurs, à l’instar de l’impact économique du syndicalisme.
Dès lors, l’objet de cet article est, d’une part, d’examiner l’existence et l’importance du biais de publication dans la littérature consacrée aux effets de la présence syndicale sur la productivité du travail et, d’autre part, de développer des outils d’investigation du biais de publication transposables dans le champ des relations industrielles.
Le biais de publication. Le biais de publication est un phénomène qui désigne un ensemble de distorsions dans le processus de publication des résultats de travaux de recherche (Sutton et al., 2000b). Le biais de publication peut avoir plusieurs causes, liées aux auteurs des travaux et aux comités de lecture des revues.
En premier lieu, il arrive souvent que les auteurs s’autocensurent et considèrent d’emblée que leurs résultats non significatifs sont sans intérêt et ont peu de chance d’être publiés. Par ailleurs, il arrive aussi que les auteurs choisissent de ne présenter à la publication que les résultats de leurs études qui confortent un positionnement théorique voire idéologique particulier.
En second lieu, plusieurs études ont montré que certaines revues se laissent influencer par les résultats d’un travail pour décider de publier ou non. Ainsi, les revues auraient tendance à publier les études dont les résultats sont statistiquement significatifs. Il arrive d’ailleurs souvent que les rédacteurs en chef écartent de la publication les travaux de recherche portant sur de petits échantillons ou encore ceux fondés sur des approches qualitatives (études de cas, monographies, etc.). Le rejet des articles dont les résultats sont non significatifs reflète parfois un positionnement théorique ou idéologique du comité de lecture des revues lui-même.
Les synthèses de la littérature jouent un rôle essentiel dans la diffusion de la connaissance scientifique sur un objet d’étude. Le fait que la revue de la littérature s’effectue uniquement sur la base d’un échantillon d’études – c’est-à-dire sans tenir compte des études non publiées – plutôt que sur l’ensemble des études existantes fait courir le risque de l’introduction d’un biais de publication. Ce phénomène est alors susceptible d’entraîner des conséquences au niveau des résultats des généralisations empiriques. Bien que le biais de publication soit souvent difficile à identifier, il existe plusieurs techniques permettant d’en détecter l’existence.
Dans le cadre de cette étude, nous nous interrogeons sur l’existence d’un biais de publication dans la littérature consacrée à l’étude du lien entre la présence syndicale et la productivité des salariés. Du fait de l’existence de deux approches théoriques contradictoires, il est possible d’envisager l’existence de résultats à la fois négatif et positif au sein du corpus empirique existant. L’approche de Freeman et Medoff (1984) postule que les effets négatifs de la présence syndicale sur la productivité (grèves, pratiques de travail restrictives, etc.) mis en exergue par les économistes néoclassiques peuvent être contrebalancés par des effets positifs de la présence syndicale (effet voice). Dès lors, il est possible d’envisager également des résultats non significatifs.
Les techniques présentées dans cet article permettent de rechercher l’existence d’un biais de publication à partir des données collectées par Doucouliagos et Laroche (2003). Dans un premier temps, des techniques purement descriptives ont été utilisées puis des techniques quantitatives plus avancées ont permis d’obtenir une estimation du biais de publication au sein de cette littérature.
En effet, le biais de publication peut être examiné en utilisant à la fois des outils qualitatifs ou quantitatifs. L’approche classique consiste à analyser des représentations graphiques telles que les funnel plots (« graphiques en entonnoir ») – qui consistent à représenter, pour chaque étude, la valeur estimée de la relation (ici la corrélation partielle entre le syndicalisme et la productivité) en fonction de la taille des échantillons de chaque étude –, des histogrammes et d’y associer des tests statistiques permettant de quantifier la probabilité d’existence d’un biais de publication (test des rangs de Kendall par exemple). Cette approche n’est pas toujours très robuste, ce qui explique le recours à d’autres outils quantitatifs plus avancés et notamment à la méta-analyse de régression.
Conclusion. Plusieurs méthodes d’identification du biais de publication ont été appliquées à la littérature consacrée au lien syndicat/productivité du travail. Les résultats obtenus montrent qu’il n’existe pas de biais de publication au sein de ce corpus empirique.
Jusqu’alors dans le domaine des sciences économiques, les investigations avaient révélé l’existence de biais de publication dans certains champs d’étude. Par exemple, Card et Krueger (1995) ont mis en évidence un biais de publication dans la littérature existante sur le salaire minimum. De même, Ashenfelter, Harmon et Oosterbeek (1999) ont identifié un biais de publication parmi les estimations portant sur les effets de l’éducation.
Cette étude conduit à un constat intéressant. Il semble que les domaines de recherche au sein desquels une théorie unique est acceptée par l’ensemble des chercheurs (ex. une élasticité-prix négative) sont susceptibles d’aboutir à des résultats empiriques fortement entachés par un biais de publication. Au contraire, les domaines de recherche au sein desquels il n’y a pas de théorie largement acceptée par tous ont plus de chance de présenter des résultats empiriques sans biais de publication. Le problème du biais de publication semble plus prononcé lorsqu’il existe un large consensus des chercheurs autour d’une théorie. Parce que les recherches sur le lien syndicat/productivité s’appuient sur des théories contradictoires, le problème du biais de publication se pose beaucoup moins qu’ailleurs.
Néanmoins, des « poches » de sélection peuvent être mises en évidence. D’une part, les résultats positifs obtenus par les études sur le lien syndicat/productivité sont souvent suivis par des études révélant des résultats négatifs. De telles autocorrélations négatives reflètent simplement la nature contestée et controversée de la recherche sur le sujet. D’autre part, on constate une tendance forte à un certain degré de publication sélective parmi les études étatsuniennes, indiquant généralement un lien positif entre la présence syndicale et la productivité. Ce résultat mériterait une analyse plus approfondie.
Resumen
Este documento desarrolla y aplica varias tecnicas de meta-analisis para investigar la presencia de publicación tendenciosa en las investigaciones de relaciones industriales, especificamente en la literatura relativa al efecto sindical en la productividad. Las publicaciones tendenciosas surgen cuando los resultados estadísticamente non significativos son suprimidos o cuando se da preferencia a los resultados que satisfacen las expectativas iniciales. Como en muchos campos, la investigación en relaciones industriales es vulnerable a la publicación tendenciosa. A diferencia de otros campos como la economía, no hay evidencia de desviación de publicación en la literatura sobre la productividad sindical en su conjunto. Sin embargo, hay indicios de publicación selectiva, así como de auto-regresión negativa, lo que confirma la naturaleza controvertida de esta área de investigación. El analisis de meta-regresión revela evidencias de publicación tendenciosa (o selección) en los estudios estado-unidenses.
Article body
“We know that publication bias exists and that it is a serious problem.”
Begg and Berlin (1988: 440)
What determines which research manuscripts are published? Is it the quality of the research, alone? If the statistical significance of the submitted results is given preference, then the distribution of published studies will be affected by publication bias. Publication bias is a subtle, often covert, form of bias in empirical research arising when the selection of studies for publication is made on the basis of the statistical significance of results, and/or on whether the results satisfy preconceived theoretical expectations.[1] The ultimate aim of empirical explorations is to weed out invalid theories and to strengthen our confidence in supported ones. Unfortunately, if publication bias exists, then this task is greatly hindered. Publication bias can distort both scientific inferences and policy decisions.
The issue of publication bias has received considerable attention in a number of fields, especially in psychology and medicine (see Begg and Berlin, 1988). Recently, economists have started to address the issue. So far, all existing investigations in economics have found evidence of publication bias. For example, Card and Krueger (1995) found publication bias in minimum wage research, Ashenfelter, Harmon and Oosterbeek (1999) among estimates of returns to education and Gorg and Strobl (2001) among the productivity effects of multinationals. Stanley, Florax and deGroot (2003) uncovered these same signs of publication bias among estimates of the price elasticity of water. Doucouliagos (2005) found strong evidence of publication bias in the economic freedom and economic growth literature.
The aim of this paper is to investigate the existence and extent of publication bias in the union-productivity effects literature. We do this by analyzing the entire literature, as well as sub-samples of it, especially the U.S. group of studies. To our knowledge, the issue of publication bias in industrial relations research has not received any formal attention. This is surprising since industrial relations is one of the most controversial research areas. Most aspects of work and employment receive considerable attention from varying theoretical and empirical perspectives. In particular, the nature of the production and labour processes, the role of incentives, ownership and management structures, and bargaining regimes, have all received intense debate. This is especially so in the case of the economic impact of unions.
In this paper, we advance and test the tentative hypothesis that areas of research where mainstream economic theory supports a specific effect (e.g., negative price elasticity and the effect of property rights on economic growth) are likely to contain publication bias. Similarly, if the mainstream view is that a particular effect takes on a certain magnitude (e.g. constant returns to scale), we expect publication bias to be a problem. Where there is widely accepted theoretical support for both positive and negative effects (e.g. union-productivity effects), or where a range of values is “acceptable” (e.g. decreasing, constant and increasing returns to scale), research areas are likely to be free of significant publication bias because all empirical outcomes are consistent with theory. Publication bias should be most pronounced where there is overwhelming professional consensus, for example that education has a positive return. In more one-sided areas of research, it is unlikely that all research findings will be treated equally. Given the intense theoretical debates raging in the union-productivity effects, we expect that this area of industrial relations research will largely escape one-sided distortion from systematic publication selection.
In the union-productivity effects literature, controversy is not confined to researchers who publish union-productivity effects. For example, in their survey of the opinions of 65 specialists in labour economics, Fuchs, Krueger and Poterba (1998: 1393) found that: “The median best estimate of the effect of unions on productivity (Q19) is zero, while the mean is slightly positive.” They found also a large interquartile range in the estimates, consistent with a highly controversial research area in which leading labour economists hold conflicting views. It is precisely in such an environment of theoretical controversy that we expect empirical investigations to support all possible outcomes and journals to publish them even-handedly.
The ‘Two-Faces’ View of Unionism
Most industrial relations researchers are familiar with the conflicting predictions regarding the impact of unions on productivity. For example, the conceptual framework known as the ‘two-faces’ view of unionism highlights both the monopoly face and the collective voice/institutional response face of unions (Freeman, 1976; Freeman and Medoff, 1984). Standard economic theory predicts that unions can reduce productivity by: (a) constraining management through restrictive work rules and practices, such as overtime restrictions, job protection and seniority rules; (b) striking or taking other industrial actions; (c) encouraging an adversarial industrial relations climate with low trust and a lack of cooperation; and (d) increasing wages above competitive levels and capturing part of the quasi-rents, so that unionized firms end up with lower levels of tangible and intangible assets.
In their now classic book What Do Unions Do? Freeman and Medoff (1984) argue that union presence can also have a positive effect on productivity. This can arise through several channels: (a) improving communication between workers and management; (b) providing a mechanism for expressing discontent at the workplace, reducing quit rates and absenteeism; (c) establishing explicit grievance procedures which help resolve disputes between management and workers; and (d) ‘shocking’ managers to improve methods of production and adopt more efficient personnel policies. Unions may influence also factor accumulation. For example, unions may improve worker morale and cooperation between workers and management. Unions may also encourage increased capital intensity and higher quality labour through higher wages for unionized workers. Freeman and Medoff (1984) point out, however, that higher productivity arising from unionism requires a favourable industrial relations climate as well as product market competition.
The net effect of these positive and negative influences on productivity is largely indeterminate and would likely vary across firms, industries, regions and over time. The net impact of unions on productivity is thus an empirical issue (Hirsch, 2004). If unions increase productivity, and if the magnitude of the effect is of economic significance, then a case can be made for spreading unionism. However, in order to draw clear inferences from the available empirical studies, it is important to be confident that publication bias is not a problem.
The union-productivity effects literature has been reviewed extensively by several authors. For example, expert narrative literature reviews have been conducted by Addison and Hirsch (1989), Booth (1995), Kuhn (1998), Turnbull (2003), Addison and Belfield (2004) and Hirsch (2004). Doucouliagos and Laroche (2003) provide a meta-analysis of this literature. None of these reviews, however, has explored the existence of publication bias; thus, their findings may be tainted. It is the purpose of this paper to identify the presence of publication bias in this area of research and to mitigate its effects.
Publication Bias
Publication bias is a collective label for a set of distortions in the process of reporting of results (Sutton et al., 2000b). Several categories of publication bias can be identified. First, authors may submit only research with statistically significant results. Second, journals may publish only, or give preference to, statistically significant results. That is, journal editors may use statistical significance to screen findings and this may lead to potential bias if studies with non-significant results are not published. Moreover, editors may be biased against studies with small samples, and they may be biased against so-called “soft” methodologies, such as qualitative case studies. Third, authors may report only findings that are consistent with prior expectations, prior beliefs, and ideological positions. Fourth, journals may have a publication preference for findings that are consistent with the prior expectations or theoretical prejudices of the editors and referees. Fifth, interesting or surprising findings (perhaps even those in conflict with established views) may be given preference from time to time (Goldfarb, 1995).
Bias need not arise because of the deliberate suppression of insignificant results, motivated by some urge to deceive. Authors may, for example, refrain from submitting statistically insignificant results on the expectation (unquestionably true in some fields) that they will have a lower probability of publication (Sutton et al., 2000b). Insignificant results may not be as interesting to readers and, given that journal space is a scarce resource, journals may prefer that insignificant results not be published, choosing instead to devote space to what are regarded as more informative results.[2]
Literature reviews play an important role in disseminating research information, drawing conclusions, and in forming consensus. Whether a review is conducted on a sample of studies or on the entire pool of studies, it is important to consider the existence and degree of publication bias in a literature. If a group of studies is under-represented in the literature, it will impact on the conclusions drawn from the truncated pool of available studies. Although publication bias is a very difficult area to explore, it does leave a number of traces. We explore the available studies in the union-productivity literature for several of these traces. In particular:
Is there statistical evidence of publication bias?
Are both positive and negative findings reported?
Is there a bias against small sample studies?
Are smaller studies more likely to report larger effects?
Do publication patterns differ across journals, over time, or across nations?
Many other questions regarding the selection of research during the peer-review process and the evolution of that research are innately interesting to researchers. However, data limitations do not permit us to address all of the potentially interesting questions. For example, we are unable to explore differences in results between submitted manuscripts and published papers, as we do not have access to original manuscripts and would be unable to locate all working papers. However, such an undertaking would be useful, and it might provide deeper insight into publication bias and selection.
In the union-productivity literature, we expect to find both positive and negative findings because conventional theory supports both. A literature contaminated by publication bias will have a dearth of published studies with statistically insignificant results. However in this area of research, we expect to find statistically insignificant results to be published. The ‘two-faces’ theory makes it clear that positive effects can cancel out the negative effects. In many cases, this may mean a near zero effect, and in this application we expect such null results to be published. Publication bias is often manifested by small-sample studies reporting larger effects to overcome their larger standard errors. We explore the union-productivity literature for such patterns, explicitly, using graphs (funnel plots) and statistical analysis (meta-regression analysis).
Data
In this paper we extend the dataset used by Doucouliagos and Laroche (2003) to explore publication bias in the union-productivity literature. Doucouliagos and Laroche compiled information on 73 published studies, including partial correlations between unionization and productivity, total union-productivity effects and statistical significance status of the reported results. For our purposes however we expand their dataset in two directions. First, we update Doucouliagos and Laroche (2003) by including the more recent studies by Hubler and Jirjahn (2003), DiNardo and Lee (2004), Hosios and Siow (2004) and Zwick (2004). Second, in addition to the best estimate from each study, we use all the estimates reported by the authors. This means we use 410 estimates of the union-productivity effect, instead of the 73 estimates used by Doucouliagos and Laroche (2003). The 77 studies are denoted as the Best-Set and the 410 estimates as the All-Set. The former can be considered as the best estimates available to the profession, while the All-Set is the total publicly available pool of estimates, which includes many estimates presented simply for sensitivity analysis.
Following Doucouliagos and Laroche (2003), the criteria for inclusion of a study in the analysis is that a study had to be published and the study had to use regression analysis to explore the links between unions and productivity. Hence, case studies were excluded, as were studies that did not report the relevant regression estimates. This selection process means that a few studies are excluded from our analysis, but this criterion is necessary to ensure a consistent set of union-productivity effect measures that can be investigated analytically. To anticipate a potential criticism, our ‘selection bias’ is entirely dictated by the possibility of making meaningful comparisons and is not influenced by the source or the outcome of the research. If a study’s results can be converted to a regression measure of union-productivity effect size, it is included.
Basic regression information was collected from each study, such as estimated coefficients, t-statistics, sample sizes, and standard errors. Partial correlation coefficients were also calculated and serve as our central measure of effect size, measuring the direction and magnitude of correlation between unions and productivity. The total union-productivity effect is available for only a smaller group of studies; thus, we use the partial correlations coefficients. Because the focus of this paper is publication selection, we are as inclusive as possible.
In order to conduct publication bias tests, we need t-values and standard errors. These can either relate to the partial correlations or the underlying regression coefficients. Unfortunately, four of the studies use a sample of 30 or less observations, while 20 of the 77 studies have a sample size less than 100. Hence, it is inadvisable to use the conventional standard error of the correlation coefficient, as this will be biased for small samples (Fisher, 1970). Instead, in this paper we can use a direct t-test and derive the implied standard errors (see Hald, 1952 and Fisher, 1970 for details).[3] Descriptive statistics for the key variables are provided in Table 1.
Table 1
Descriptive Statistics, Means (Standard Deviations)

Publication bias can be explored formally through both qualitative and quantitative tools. The standard approach is to use some graphical display, such as funnel plots, and to supplement this with quantitative analysis.
Graphical Inspection
Of the 77 studies offering a quantitative assessment of the impact of unions on productivity, 47 report a positive association and 30 report a negative one. More importantly, 34 of the 77 studies reported statistically insignificant results. That is, positive, negative, as well as statistically insignificant results are well-represented in this literature. Hence, our immediate assessment of this literature is that publication bias, if it exists at all, is not a major problem. This casual observation is supported below in graphical displays and by meta-regression analysis.
Funnel Plots
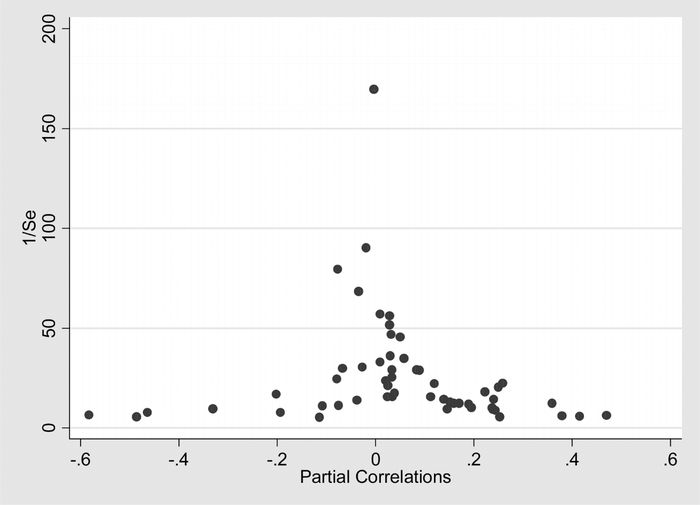
The funnel plot is probably the most popular graphical technique for assessing publication bias. This scatter plot derives its name from the funnel-like pattern that emerges when there is no publication bias (see Figure 1). The funnel plot compares the effect size against some measure of precision, such as sample size or the inverse of the standard error (Sutton et al., 2000c). The logic behind funnel plots is that those studies with a smaller sample size or precision will have larger random error; thus a larger spread when graphed. Hence, in the absence of publication bias, the union-productivity effects from smaller studies will have a larger, but symmetric, spread around the mean effect. This, of course, is based on the assumption that there is one universal mean union-productivity effect. Some authors argue that the union-productivity effect will vary from industry to industry and country to country (e.g. Freeman and Medoff, 1984), while others imply that there is a universal relationship. Even if the size the union-productivity effect were to vary randomly across studies due to variations in industry and country choices, the funnel graph would retain its basic symmetric shape in the absence of publication bias.
If there is no publication bias, the funnel plot should be symmetric and hence look like an inverted funnel. Figure 1 presents the funnel plot for these 77 published studies. The partial correlations are measured on the horizontal axis and the inverse of the standard error (1/Se) on the vertical. As can be seen from Figure 1, the graph clearly resembles a symmetric inverted funnel. As expected, smaller studies (those at the bottom of the graph) display greater variation in productivity effects. The distinct funnel shape of this distribution gives clear visual evidence of the absence of publication bias. If there are publication biases, they do not strongly favour one side or the other. As a contrast, consider Figure 2 which is the funnel plot associated with the All-Set. This funnel plot also appears symmetric with the possible exception of a few outliers, both positive and negative, in the middle range of the data.
The idea behind funnel plots is that if small studies with insignificant results are not published, then the funnel shape will become asymmetric. Actually, the funnel graph will only become asymmetric when there is a preference for significant results of a given direction. When there is an equal preference for both significant positive and significant negative results, the funnel graph remains symmetric, but hollow. If smaller studies with insignificant results are known to be difficult to publish, then authors may endeavour to select larger estimated effect sizes through specification searching. Thus, the reported/published effect sizes will overestimate the underlying empirical finding. This selection leads to publication bias because the authors are responding to journal preferences and skewing what they report rather than reporting unfiltered empirical results. Thus, only those small studies with large effects will be published, causing a correlation between effect size and sample size. Some authors argue that smaller studies are likely to be poorly designed studies (e.g. Sigelman, 1999). However, Gerber, Green and Nickerson (2001: 386) note correctly that: “published studies based on small samples should be well-executed studies, but there should be no tendency for studies based on small samples to show unusually large effects.” The reality in many economic applications is that only small samples are available to researchers. If insignificant results are established from small samples, this fact should still be revealed to other researchers. It should be noted that publication bias does not require any unethical or unscientific action by the researchers. If editors and referees are more likely to select significant findings for publication, then the same biases will be found in the literature, without additional searching or selection by the authors or theoretical biases of editors and referees.
Figure 1
Funnel Plot, Union-Productivity Partial Correlations, Best-Set of Estimates (n = 77)

Figure 2
Funnel Plot, Union-Productivity Partial Correlations, All-Set of Estimates (n = 414)

In meta-analysis, the potential distortion of small-samples and the resulting potential for publication bias is routinely mitigated by using weighted averages. In economics, weighted averages have been constructed using sample sizes, the number of specification tests passed, citations, and journal rankings (Stanley, 2001; Doucouliagos and Laroche, 2003). A lower weight is preferable to the zero weight that would arise if smaller studies were suppressed altogether. The inverse of the effect’s variance is usually considered optimal because it minimizes the variance of the weighted average (Sutton et al., 2000c: 58). For our union-productivity literature, this weighted average gives a value that is effectively zero (+0.002).
Normal Quantile Plots
Wang and Bushman (1998) recommend the use of the normal quantile plot, which compares the distribution of the effect sizes against the normal distribution, plotting the quantiles of one distribution against the other. This is a useful alternative to the subjective funnel plots. Figure 3 presents the normal quantile plot for the unions and productivity effects. On the plot is drawn a linear regression line as well as confidence intervals constructed against the normal quantile plot. If the quantiles of the standardized union-productivity effect sizes are similar to the quantiles of the normal distribution, then the points should be close to the regression line. If the points are outside the confidence intervals, the conclusion is that the study results are not normally distributed. Figure 3 confirms that the results reported in this literature are normally distributed, and this can also be interpreted as no evidence of publication bias.
Figure 3
Normal Quantile Plot, Unions and Productivity Effects, All Studies (n = 77)

Rank Correlation Analysis
The rank correlation is a measure of correlation of the relative ranks of two variables. In this paper, we consider the correlation between partial correlations and sample size, testing whether there is a statistically significant association. For this test, the effect sizes are standardized (see Sutton et al., 2000b). Two different statistics are reported, Kendall’s Tau and Spearman’s Rank-Order correlation test statistics in Table 2, together with their associated prob-values (in brackets), for all studies combined, for U.S. studies and non-U.S. studies, separately.[4] These non-parametric tests indicate that there is no correlation between effect size and sample size; however, they are well known to have low power (Begg and Mazumdar, 1994).
Table 2
Non-parametric Tests of Publication Bias

Meta-Regression Analysis
The main problem with funnel plots is that they are graphical devices, hence prone to subjective interpretation. However, meta-regression analysis (MRA) can be used to provide a more objective test of a funnel graph’s asymmetry.[5] Egger et al. (1997) offers a funnel asymmetry test (FAT) that looks for a significant intercept in the regression of the standardized effect (e.g., the t-value) on the inverse of the standard error (1/Se). This MRA is the weighted-least squares version of a meta-regression of a study’s effect on its standard error. In the absence of publication bias, so the reasoning goes, there should be no relationship between the magnitude of the reported effect and its standard error. However, with publication bias, smaller studies will tend to select larger effects (in magnitude) to overcome their inherently larger standard errors. When we divide this simple meta-regression model by the standard error to correct for obvious heteroskedasticity, the slope coefficient becomes the intercept, and visa versa.
Table 3 column 1 presents the meta-regression analysis corresponding to FAT for the Best-Set. The intercept is not statistically significant (t = 1.81; p > .05); hence, Egger’s asymmetry test confirms our visual inspection of the funnel plot. However, there is a problem with Egger’s asymmetry test. Because the standard error is estimated from the sample data of each study, it contains estimation error (Macaskill, Walter and Irwig, 2001). It is widely recognized, that whenever the independent variable is measured with error, the regression estimates will be biased and inconsistent—i.e., errors-in-variables bias.
In this application, two strategies are readily available to remedy this errors-in-variables bias. First, the square root of the sample size, which does not contain sampling error, could be used as a proxy for the inverse of the estimate’s standard error. Table 3 column 2 reports this approach and again finds no evidence of publication bias (accept H0: β0 = 0; t = 1.76; p > .05).[6] Secondly, instrumental variables estimators are known to correct for errors-in-variable bias, and, in this case, the square root of the sample size is the obvious instrument.
Table 3
Funnel-Asymmetry Tests, Best-Set and All-Set (Dependent Variable = t-statistics)

t-values are reported in parenthesis and are calculated from heteroskedasticity-consistent standard errors.
*, **, *** statistically significant at the 10%, 5% and 1% levels, respectively.
Square brackets report standard errors for the All-Set derived from bootstrapping.
For theoretical statistical reasons, we know that the square root of the sample size should be highly correlated with the inverse of the standard error; here, this correlation is 0.99. Yet, the sample size will be independent of the standard error’s random sampling errors. The funnel asymmetry instrumental variables estimator (FAIVE) is reported in column 3 of Table 3. Again, FAIVE accepts the null hypothesis that there is no publication bias (accept H0: β0 = 0; t = 1.77; p > .05). Regardless of the estimation approach taken, we accept the symmetry of the funnel plot and find no significant statistical evidence of publication bias in the union-productivity literature. This finding of no significant publication bias in the union-productivity literature should be seen against the backdrop of other investigations for publication bias. In all other applications in economics conducted thus far, evidence of publication bias has been claimed (Card and Krueger, 1995; Ashenfelter, Harmon and Oosterbeek, 1999; Gorg and Strobl, 2001; Doucouliagos, 2005). Hence, our finding of no publication bias in this area of industrial relations research is rather exceptional.[7]
Nonetheless, the full sample (All-Set) finds clear evidence of publication selection (see columns 4, 5 and 6 of Table 3). Many of the All-Set estimates are not statistically independent, as some studies contribute more than one observation. Hence, we used both OLS as well as the bootstrap to derive the associated standard errors (see Efron and Tibshirani, 1993). Not all studies report the same number of ‘other’ estimates. The process of reporting additional results is not random and may be affected by publication bias. That is, even though the best estimates taken as a group seem free of publication bias, the four-fold increase in sample size allows the publication bias among U.S. studies to be identified against background variation—see “National Difference” below.
Note that using the standard error of the associated regression coefficients produces the same conclusions. For example, if the standard error of the regression coefficients and associated regression t-statistics are used in the FAT tests, the intercept in Table 3, column 1, becomes +0.58 with a t-statistic of 1.50, with no publication bias in the Best-Set. Similarly, the intercept for Table 3, column 4 becomes +0.64 with a t-statistic of 5.00, with publication bias in the All-Set.[8]
Table 3 reports the FAT results when all studies are included. Positive publication bias can, however, be clearly seen among the earliest studies (Figure 4) which illustrates a dearth of negative findings, and among U.S. studies (Figure 5, discussed below), if not in the literature as a whole (Figure 1).
Figure 4
Funnel Plot, Studies Published Prior to 1985 (n = 13)

The slope coefficient of Egger’s asymmetry test may also be used to provide a corrected estimate of the true effect; hence, it is an additional test of significance (Macaskill, Walter and Irwig, 2001: 644). Regardless of which estimation strategy we use, including FAIVE, the estimated slope of the funnel relation is statistically insignificant (see Table 3, columns 1 to 6). It may be interesting to note that the corrected estimate of the partial correlation for the union-productivity effect is negative (-0.01, e.g. column 3, Table 3); whereas, the unadjusted average is positive (+0.021) and the weighted average is effectively zero (+0.002), consistent with some positive (but insignificant) publication bias. This is consistent with Doucouliagos and Laroche (2003: 666) who conclude that: “taking all the available evidence, the conclusion is that the central tendency of the published results falls around zero.”
Other Patterns of Publication Selection
Autoregression: Timing is Everything
Are there patterns across time among the reported union-productivity effects? Goldfarb (1995) has suggested that there is a predictable pattern to empirical economic research. First, there is a tendency to report evidence confirming a new theory or hypothesis. Then, after a sufficient passage of time for confirmations to accumulate (typically years), further confirmation is thought to contain little new information. Thus, contradictions become more likely to be published. Again, after sufficient time elapses, such empirical criticisms will become passé, engendering another reversal of publication preferences. Such a view of empirical economic research leads to cycles of fashion much like those found in the economy. To render Goldfarb’s conjecture testable, waves of publication fashion should produce positively autocorrelated findings. That is, if several years of positive reported findings are followed by years of primarily negative ones, positive autocorrelation will result.
Clearly, existing research acts as a catalyst to future research, but this does not necessarily mean that similar results will be published in the future. To test for the existence of autoregressive effects, we estimated a number of autoregressive (or AR) models, where the dependent variable was an effect size, regressed against its past values. A yearly weighted average is constructed by averaging all the studies published in 1980, 1981, and so on, weighting each by its sample size. The most striking finding is the statistically significant negative autocorrelation coefficient (ρ = -0.20; t = -2.70; p = .015) for a one-year lag—AR(1). This means that a positive finding tends to be followed by a negative finding, and vice versa. Such negative autocorrelations seem to refute Goldfarb’s conjecture, unless of course economic fashions are very fickle.
Perhaps this negative autocorrelation can be interpreted as a form of publication bias, but one that is not entirely undesirable. A vigorous critical empirical environment may be a socially useful process. This negative autocorrelation among reported union-productivity effects may be a reflection of the controversial nature of the union-productivity effects literature. Whenever a finding in one direction or the other seems to be in the ascendancy, there is increased motivation of members of the opposing camp to quickly publish an counterbalancing finding. Such contentiousness is not unknown in other areas of labour economics. For example, there is the notorious controversy over the employment effects of the minimum wage (The Economist, February 3, 2001: 80). Although union-productivity research may not be quite as contentious as minimum wage research, the observed negative autocorrelation may be a reflection of its controversial nature.
National Differences: ‘U.S. vs. Them’
Geography is an important dimension across which we search for publication selection. Do effects, or their selection, differ across countries? Obviously, there are important historical, cultural, policy and industrial relations differences among nations that might well affect union productivity and/or the research climate. Here, we investigate only the broadest of such distinctions, U.S. vs. all other nations, because a large majority of studies (71%) in this literature use U.S. data.
In a previous study of this literature, Doucouliagos and Laroche (2003) find a positive union-productivity effect among U.S. studies and speculate that this result “derives from real economic forces” (p. 680), noting, however, that their findings may be influenced by publication bias. Like all other forms of literature reviews, meta-analysis is vulnerable to publication bias if it is not explicitly addressed. In this case, it seems that the apparent real differences found among U.S. studies are little more than the artifact of selection for positive union-productivity effects.
To see this, note the meta-regression results reported in Table 4, which test for publication bias (FAIVE, column 1) after adding a dummy variable for studies that use U.S. data (U.S. = 1, 0 for other countries). The findings are quite interesting and robust. U.S. studies appear to be selected for their positive union-productivity effects, and this bias is confirmed by two tests in Table 3. The FAIVE intercept reported in column 2 for the 55 U.S. studies alone is clearly significantly positive (t = 2.77; p < .01). Likewise, the sum of the intercept and the FAIVE coefficient for U.S. in column 1, where all studies are included, is statistically significant (Wald restriction test χ2(1) = 6.72; p < .01). This selection is also evident in the funnel graph where only U.S. studies are displayed (see Figure 5). Note the relative scarcity of values on the lower half of the left side, relative to Figure 1. Yet interestingly, the three largest studies (i.e., those at the top of the funnel graph) are all negative. It is this asymmetry that FAIVE detects. Column 3 presents the FAIVE results for the 22 non-U.S. studies. While the number of observations is small, this is the population of available estimates. The intercept is not statistically significant (t = -0.99), suggesting an absence of publication bias among the non-U.S. union-productivity studies. Note that the FAT results lead to a conclusion that differs from the non-parametric tests for the U.S. studies reported in Table 2, consistent with the low power of these non-parametric tests.
Table 4
Funnel-Asymmetry Tests for U.S. and Non-U.S. Selection Effects (Dependent Variable = t-statistics)
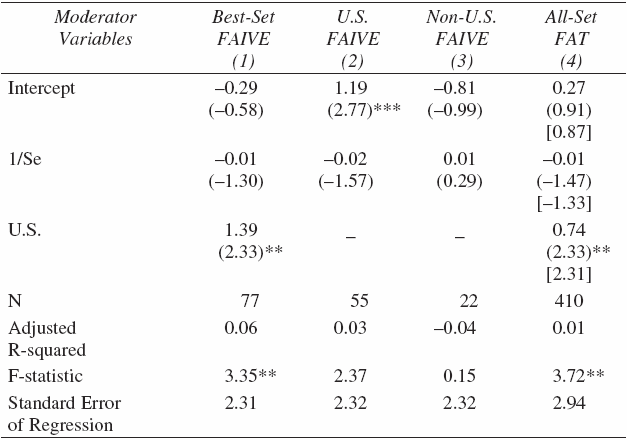
t-values are reported in parenthesis and are calculated from heteroskedasticity-consistent standard errors.
*, **, *** statistically significant at the 10%, 5% and 1% levels, respectively.
Square brackets report standard errors for the All-Set derived from bootstrapping.
As a further test of the U.S. effect, we estimated also FATMRA models. These are extensions of the FAT model, with the inclusion of other variables that may influence the magnitude of reported t-statistics. As control variables, we considered dummy variables controlling for studies that use data only on manufacturing, studies that are published in management type journals (as opposed to economic and industrial relations journals), as well as dummies for the main economics and industrial relations journals that have published union-productivity effects. The coefficient on U.S. has a coefficient of 1.38 and remains statistically significant (t = 2.29; p = .02), so that the U.S. effect is robust.
Figure 5
Funnel Plot, Union-Productivity Partial Correlations, U.S. Studies (n = 55)
In sum, allowing for national differences reveals significant publication selection among U.S. studies, while no publication bias is indicated for non-U.S. studies. It appears that there are areas of publication selection in the union-productivity literature even though the overall literature appears to be free from any trace of publication bias. Fortunately, the ‘two-faces’ view and its attendant controversy are sufficient to balance out these pockets of bias.
Analysis of Journals
To investigate whether there are additional pockets of publication selection, we turn to individual journals and groups of journals. In order to explore this possibility, we grouped the journals together and categorized the findings according to whether statistically significant negative, statistically insignificant negative, statistically significant positive and statistically insignificant positive results were reported in a journal. The journals are separated according to whether they are economics, management or industrial relations journals, with a separate category for studies published in books. The categories are presented in Table 5. The last column reports the median total productivity effect associated with a group of studies.
Table 5
Journal Analysis

* The Other Economics category includes the Journal of Political Economy, Economica, International Journal of IndustrialOrganization, European Economic Review and International Journal of Applied Economics.
** The Other Industrial Relations category includes Advances in Industrial and Labor Relations, British Journal of Industrial Relations, Travail et Emploi and Relations Industrielles.
One of the problems with this approach is that, in many cases, there are only a couple of studies reported in the journals. Hence, it is difficult to draw any inference from many of the journals. There appears to be a clear difference in the distribution of results across the three different types of journals. Although a small number of papers are involved, management journals report only positive effects. Among the industrial relations journals, it is strikingly obvious that the Journal of Labor Research has published a greater percentage of negative findings, as do the various books. Importantly, there are significant differences with the median productivity effects across the journals. Table 6 presents summaries by publication outlet, combining all insignificant studies together. Industrial relations and economics journals have a similar distribution of results.[9]
Table 6
Publication Outlet Comparisons

Conclusion
Publication is the most efficient way of disseminating research and communicating empirical results. However, the publication process is plagued by a number of problems, including publication bias. Identifying and correcting publication selection for its pernicious effects is essential if economic and industrial relations research is to be trusted. Otherwise, the validity of theory cannot be evaluated, and policy advice would remain of dubious value.
In this paper, quantitative techniques were applied to the union-productivity literature in order to explore the existence of publication bias. From the results presented, we find no evidence of systematic publication bias across the entire literature of union-productivity effects. This finding supports our hypothesis that publication bias is less likely when an area of research is controversial. Controversy mitigates publication bias and can contribute to scientific progress.
We draw this conclusion from the total pool of studies when using the best estimates from the studies. Nonetheless, pockets of publication selection may still be identified against this backdrop of seemingly balanced and objective reporting. First, positive findings are likely to be followed and countered by negative reported results. Such signs of negative autocorrelation may simply reflect the fact that union-productivity research is contested and controversial. Second, there is clear evidence of publication selection among U.S. studies for positive union-productivity effects. Third, analysis of journals suggests that while the distribution of results across journals is consistent with the absence of publication bias, some journals are more likely to publish negative findings and others more likely to publish positive findings. Fourth, publication bias was evident when all available estimates are considered (the All-Set), further reflecting the publication selection among U.S. studies. These tantalizing hints and patterns merit further analysis.
While the lack of publication bias in the literature as a whole is heartening for the profession, policy interest tends to focus on industry specific research. That is, the more important issue is the impact of unions on productivity, for example, in U.S. manufacturing, Japanese construction and German education. Unfortunately, with few industry specific studies available, we are unable to explore meaningfully the existence of publication bias at the industry level. This requires additional studies to be made available and is a task for future research.
One positive implication of our study is that literature reviews and meta-analyses can provide a fair assessment of the overall union-productivity literature. There are a number of existing reviews that do not consider the dangers of publication bias. Nevertheless, it is encouraging to note that the results presented in this paper indicate that the conclusions drawn by the existing reviews are unlikely to have been seriously affected by publication bias.
Appendices
Notes
-
[1]
Publication bias is also known as positive-outcome bias or the ‘file drawer’ problem. Studies that report statistically insignificant results tend to remain in the researchers’ file drawers never to be published or, if published, delayed (‘pipeline’ bias).
-
[2]
The financial press in general prefers statistically significant results and rarely reports non-significant results.
-
[3]
This t-test for the partial correlation is given by t = r/√(1-r2)*√(df-2), and the standard error is given by r/t (Fisher, 1970). An alternative approach is to use the Fisher z-transform given by z = ½{loge(1+r) – loge(1-r)} and its standard error 1/√(df-3).
-
[4]
Metawin was used for these tests (see Rosenberg, Adams and Gurevitch, 2000).
-
[5]
See Stanley and Jarrell (1989), Stanley (2001), and Stanley, Florax and de Groot (2003) for an introduction and discussion of these tools of meta-analysis.
-
[6]
Replacing sample size with degrees of freedom produces essentially the same results (ß0 = 0; t = 1.78; p > .05).
-
[7]
Egger et al. (1997) advocate using a less stringent significance level (i.e., α = .10) to compensate for the low power of their test. By this criterion, there is weak evidence of publication bias.
-
[8]
Using either the standard error for the partial correlation for large samples, or the Fischer z transform does not change the conclusions regarding the lack of publication bias in the entire pool of studies and the presence of publication bias among U.S. studies.
-
[9]
A Chi-square test can be used to determine whether the observed distribution of studies differs across the journals. This test would be based on the assumption that studies are received by journals on a random basis, and that the probability of publishing a negative finding is the same as the probability of publishing a positive finding. Unfortunately, we are unable to perform this test because there are too few observations in most cases.
References
- Addison, J. and B. Hirsch. 1989. “Union Effects on Productivity, Profits, and Growth: Has the Long Run Arrived?” Journal of Labor Economics, 7, 72–105.
- Addison, J. and C. Belfield. 2004. “Union Voice.” Journal of Labor Research, 563–596.
- Ashenfelter, O., C. Harmon and H. Oosterbeek. 1999. “A Review of Estimates of the Schooling/Earnings Relationship, with Tests for Publication Bias.” Labour Economics, 6, 453–470.
- Bauchau, V. 1997. “Is There a “File Drawer Problem” in Biological Research?” Oikos, 79, 407–409.
- Begg, C. B. and J. A. Berlin. 1988. “Publication Bias: A Problem in Interpreting Medical Data.” Journal of Royal Statistical Society, Series A, 151, 419–463.
- Begg, C. B. and M. Mazumdar. 1994. “Operating Characteristics of a Rank Correlation Test for Publication Bias.” Biometrics, 50, 1088–1101.
- Booth, A. 1995. The Economics of Trade Unions. Melbourne and New York: Cambridge University Press.
- Card, D. and A. B. Krueger. 1995. “Time-Series Minimum-Wage Studies: A Meta-Analysis.” American Economic Review, 85, 238–243.
- DiNardo, J. and D. S. Lee. 2004. “Economic Impacts of New Unionization on Private Sector Employers: 1984–2001.” The Quarterly Journal of Economics, 1383–1441.
- Doucouliagos, C. 1995. “Worker Participation and Productivity in Labor-Managed and Participatory Capitalist Firms: A Meta-Analysis.” Industrial and Labor Relations Review, 49, 58–77.
- Doucouliagos, C. 2005. “Publication Bias in the Economic Freedom and Economic Growth Literature.” Journal of Economic Surveys, 19, 367–387.
- Doucouliagos, C. and P. Laroche. 2003. “What do Unions do to Productivity: A Meta-Analysis.” Industrial Relations, 42, 650–691.
- Efron, B. and R. J. Tibshirani. 1993. An Introduction to the Bootstrap. San Francisco: Chapman and Hall.
- Egger, M., G. D. Smith, M. Scheider and C. Minder. 1997. “Bias in Meta-Analysis Detected by a Simple, Graphical Test.” British Medical Journal, 316, 629–634.
- Fernie, S. and D. Metcalf. 1995. “Participation, Contingent Pay, Representation and Workplace Performance: Evidence from Great Britain.” British Journal of Industrial Relations, 33, 379–415.
- Fisher, R. A. 1970. Statistical Methods for Research Workers. Edinburgh: Oliver and Boyd.
- Freeman R. 1976. “Individual Mobility and Union Voice in the Labor Market.” American Economic Review, 66, 361–368.
- Freeman R. and J. Medoff. 1984. What Do Unions Do? New York: Basic Books.
- Fuchs, V., A. Krueger and J. Poterba. 1998. “Economists’ Views about Parameters, Values, and Policies: Survey Results in Labor and Public Economics.” Journal of Economic Literature, 36, 1387–1425.
- Gerber, A. S., D. P. Green and D. Nickerson. 2001. “Testing for Publication Bias in Political Science.” Political Analysis, 9, 385–392.
- Goldfarb, R. S. 1995. “The Economist-as-Audience Needs a Methodology of Plausible Inference.” Journal of Economic Methodology, 2, 201–222.
- Gorg, H. and E. Strobl. 2001. “Multinational Companies and Productivity: A Meta-Analysis.” The Economic Journal, 111, 723–739.
- Green, W. H. 1990. Econometric Analysis. New York: MacMillan.
- Hald, A. 1952. Statistical Theory with Engineering Applications. New York: John Wiley and Sons.
- Hirsch, B. 1991. Labor Unions and the Economic Performance of Firms. Kalamazoo, Mich.: W.E. Upjohn Institute for Employment Research.
- Hirsch, B. 2004. “What Do Unions Do for Economic Performance?” Journal of Labor Research, 15, 415–455.
- Hosios, A. and A. Siow. 2004. “Unions Without Rents: The Curious Economics of Faculty Unions.” Canadian Journal of Economics, 37, 28–52.
- Hubler, O. and U. Jirjahn. 2003. “Works Councils and Collective Bargaining in Germany: The Impact on Productivity and Wages.” Scottish Journal of Political Economy, 50, 471–491.
- Hunter, J. E. and F. L. Schmidt. 1990. Methods of Meta-Analysis: Correcting Error and Bias in Research Findings. Newbury Park: Sage Publications.
- Jarrell, S. B. and T. D. Stanley. 1990. “A Meta-Analysis of the Union-Nonunion Wage Gap.” Industrial and Labor Relations Review, 44, 54–67.
- Kochan, T. A., H. C. Katz and R. B. McKersie. 1986. The Transformation of American Industrial Relations, New York: Basic Books.
- Kuhn, P. 1998. “Unions and the Economy: What We Know; What We Should Know.” Canadian Journal of Economics, 31, 1033–1056.
- Macaskill, P., S. D. Walter and L. Irwig. 2001. “A Comparison of Methods to Detect Publication Bias in Meta-Analysis.” Statistics in Medicine, 20, 641–654.
- Neumark, D. and W. Wascher. 2002. “Meta-Analysis.” Journal of Economic Perspectives, 16, 226–227.
- Perotin, V. and A. Robinson. 2000. “Employee Participation and Equal Opportunities Practices: Productivity Effect and Potential Complementarities.” British Journal of Industrial Relations, 38, 557–583.
- Rosenberg, M. S., D. C. Adams and J. Gurevitch. 2000. MetaWin: Statistical Software for Meta-Analysis. Version 2.0. Sunderland, Mass.: Sinauer Associates.
- Rosenthal, R. 1979. “The “File Drawer Problem” and Tolerance for Null Results.” Psychological Bulletin, 86, 638–641.
- Rust, R. T., D. R. Lehmann and J. U. Farley. 1990. “Estimating Publication Bias in Meta-Analysis.” Journal of Marketing Research, 27, 220–226.
- Scargle, J. D. 2000. “Publication Bias: The “File-Drawer” Problem in Scientific Inference.” Journal of Scientific Exploration, 14, 91–106.
- Sigelman, L. 1999. “Publication Bias Reconsidered.” Political Analysis, 8, 201–210.
- Stanley, T. D. 2001. “Wheat from Chaff: Meta-Analysis as Quantitative Literature Review.” The Journal of Economic Perspectives, 15, 131–150.
- Stanley, T. D. 2002. “Response by T. D. Stanley.” Journal of Economic Perspectives, 16, 227–229.
- Stanley, T. D. and S. B. Jarrell. 1989. “A Meta-Regression Analysis: A Quantitative Method of Literature Surveys.” Journal of Economic Surveys, 3, 54–67.
- Stanley, T. D, R.J.G.M. Florax and H.L.F. deGroot. 2003. “It’s All About Power: Differentiating Genuine Empirical Significance from the Artifact of Publication Bias.” Discussion Paper 3, Center for Entrepreneurial Studies, Hendrix College.
- Sutton, A. J., S. J. Duval, R. L. Tweedie, K. R. Abrams and D. R. Jones. 2000a. “Empirical Assessment of Effect of Publication Bias on Meta-Analyses.” British Medical Journal, 320, 1574–1577.
- Sutton, A. J., F. Song, S. M. Gilbody and K. R. Abrams. 2000b. “Modelling Publication Bias in Meta-Analysis: A Review.” Statistical Methods in Medical Research, 9, 421–445.
- Sutton, A. J., K. R. Abrams, D. R. Jones, T. A. Sheldon and F. Song. 2000c. Methods for Meta-Analysis in Medical Research. Chichester: John Wiley and Sons.
- Turnbull, P. 2003. “What Do Unions Do Now?” Journal of Labor Research, 14, 491–527.
- Wang, M. C. and B. J. Bushman. 1998. “Using the Normal Quantile Plot to Explore Meta-Analytic Data Sets.”Psychological Methods, 3, 46–54.
- Zwick, T. 2004. “Employee Participation and Productivity.” Labour Economics, 11, 715–740.
List of figures
Figure 1
Funnel Plot, Union-Productivity Partial Correlations, Best-Set of Estimates (n = 77)
Figure 2
Funnel Plot, Union-Productivity Partial Correlations, All-Set of Estimates (n = 414)
Figure 3
Normal Quantile Plot, Unions and Productivity Effects, All Studies (n = 77)
Figure 4
Funnel Plot, Studies Published Prior to 1985 (n = 13)
Figure 5
Funnel Plot, Union-Productivity Partial Correlations, U.S. Studies (n = 55)
List of tables
Table 1
Descriptive Statistics, Means (Standard Deviations)
Table 2
Non-parametric Tests of Publication Bias
Table 3
Funnel-Asymmetry Tests, Best-Set and All-Set (Dependent Variable = t-statistics)
t-values are reported in parenthesis and are calculated from heteroskedasticity-consistent standard errors.
*, **, *** statistically significant at the 10%, 5% and 1% levels, respectively.
Square brackets report standard errors for the All-Set derived from bootstrapping.
Table 4
Funnel-Asymmetry Tests for U.S. and Non-U.S. Selection Effects (Dependent Variable = t-statistics)
t-values are reported in parenthesis and are calculated from heteroskedasticity-consistent standard errors.
*, **, *** statistically significant at the 10%, 5% and 1% levels, respectively.
Square brackets report standard errors for the All-Set derived from bootstrapping.
Table 5
Journal Analysis
* The Other Economics category includes the Journal of Political Economy, Economica, International Journal of IndustrialOrganization, European Economic Review and International Journal of Applied Economics.
** The Other Industrial Relations category includes Advances in Industrial and Labor Relations, British Journal of Industrial Relations, Travail et Emploi and Relations Industrielles.
Table 6
Publication Outlet Comparisons