Abstracts
Abstract
This paper will present and discuss the results of an empirical study on perception of quality in interpretation carried out on a sample of 286 interpreters across five continents.
Since the 1980’s the field of Interpreting Studies has been witnessing an ever growing interest in the issue of quality in interpretation both in academia and in professional circles, but research undertaken so far is surprisingly lacking in methodological rigour. This survey is an attempt to revise previous studies on interpreters’ perception of quality through the implementation of new Information Technology which allowed us to administer a traditional research tool such as a questionnaire, in a highly innovative way; i.e., through the World Wide Web. Using multidimensional scaling, a perceptual map based upon the results of the manner in which interpreters ranked a list of linguistic and non-linguistic criteria according to their perception of importance in the interpretative process, was devised.
Keywords/Mots-clés:
- interpreter’s perception,
- quality of interpretation,
- information technology,
- World Wide Web
Résumé
Cette étude présente et examine les résultats d’une enquête sur la qualité en interprétation auprès d’un échantillon de 286 interprètes distribués à travers cinq continents. Depuis les années 1980, l’étude de la qualité en interprétation soulève de plus en plus d’intérêt, aussi bien dans la recherche universitaire que sur le plan professionnel. Toutefois, cette recherche manque encore de rigueur méthodologique. La présente enquête représente une mise à jour des études précédentes sur la perception de la qualité, grâce à l’apport innovateur de l’informatique. L’Internet rend plus efficace un instrument traditionnel comme le questionnaire, dont il permet la distribution et la restitution sous forme de fichier électronique. Les échelles à plusieurs dimensions, utilisées pour décrire la perception de la qualité dans notre questionnaire, ont permis d’examiner l’ordre des priorités en matière de critères linguistiques et non linguistiques.
Article body
1. Introduction
Systems of quality control are gradually becoming common practice in every imaginable walk of life. No longer limited to the control of safety standards of hi-tech goods and household appliances, excellence is an essential feature in all trade sectors. From the food industry to public services, quality policies are unavoidable, yet the work of translators and interpreters is still largely in a state of mayhem that is often simply governed by unspoken negotiations of trust between specialist and client rather than by externally determined standards.
The issue of quality in translation is slippery. Research demonstrates a widespread superficial attitude adopted by clients towards the linguistic services they require, services that frequently lack any kind of end product quality control. It would appear that at the beginning of the 21st century, despite the consolidation of a truly global marketplace, an area as significant as translation has not yet developed a system of standards capable of guaranteeing top-quality services to clients or even of assigning more noteworthy professional standing to translators (for detailed discussions of issues regarding quality in translation see Hermans and Lambert 1998 and Chiaro and Nocella 1999 and 2000). Let us not forget that without translation there can be no globalization.
With regard to interpreting, given the transient nature of this activity, quality control is even more complex than that of written translation, yet despite this, interest in this issue is growing both amongst practitioners and academics. Nonetheless, although there is considerable agreement in the literature regarding criteria that are involved in assessing quality in this field, there appears to be little harmony concerning which perspective to take when undertaking research: whether it is best to explore the success of an interpretation from the perspective of the interpreter or from that of the user is a debateable issue. Ideally, of course, both standpoints should be considered simultaneously, but owing to the large variety of topics embraced by both conference and community interpreting, developing a research project capable of covering every possible topic in a significant number of linguistic combinations, while not impossible, would certainly be impractical both in methodological and in financial terms.
The present study is based on an empirical study on perception of quality in interpreting carried out on a sample of 286 conference interpreters across five continents. We thought that the perspective of specialists could be considered a helpful starting point in an attempt to untangle the twisted mesh of the problematic issue of quality in interpreting. Aware of the fact that our results would not supply us with the full story, we were confident that they would nonetheless constitute a reliable springboard for further research.
Following a brief introduction on the question of quality in interpreting and the results of previous studies, taking Daniel Gile’s criticism of research in this field as a starting point (Gile 1994), we shall describe the methodological design adopted in our study, present the results and finally draw up and discuss our conclusions.
2. Methodological Issues in Research on Quality in Interpretation
Since the late 1980’s, the field of interpreting studies has been experiencing an ever-growing interest in the issue of quality in interpretation both in academia and in professional circles. Although there is a general consensus as to which criteria make up a good quality interpretation; i.e., fidelity to the source text, linguistic correctness and stylistic and terminological acceptability, much research remains philosophical in nature while attempts at more scientific research in interpreting often appear to be based on rather uncertain methodological principles.
We would like to approach the issue of quality from the angle of economics, bearing in mind that interpreting is a service which, like any other service, by definition can be analysed from three different perspectives, namely:
the supplier of the service;
the client/customer or user of the service, and
the service itself.
In order to set up quality standards, there is clearly a need to gain a thorough knowledge of the needs and expectations both of the supplier (the interpreter) and of the client/customers. Naturally, the nature of the object itself (i.e., the interpreted text) must also be understood in detail. Only by means of studies that consider all three areas can we arrive at a complete picture of this service. We firmly believe that the results of such investigations can be the only foundation upon which serious standards can be constructed. However, such an enterprise is by no means simple as each of these three areas is a potential can of worms.
As might be expected, attempts at empirical research carried out so far on quality in interpreting reflect these three perspectives and have thus been based upon:
Analyses of the product; i.e., the transcribed texts of interpretations[1];
Field work (based upon the results of questionnaire surveys) regarding end-user perception of interpretations, and
Field work (based upon the results of questionnaire surveys) regarding interpreter perception of interpretations in general.
2.1 Analyses of the transcribed texts of interpretations
In order to achieve a detailed knowledge of an interpreted text by analysing an interpreter’s output, the product, i.e., the text itself, must surely be the researcher’s most obvious starting point. However, methodologically speaking, this area is a potential minefield. As Gile points out (1994: 43-49), from the difficulty of obtaining truly authentic materials, to the sheer variability of text-types, texts and indeed languages and language combinations involved in the procedure, many are the problems awaiting the scholar attempting to explore the process from such a direction. Furthermore, it soon becomes clear that any generalization resulting from such research, is, to say the least, tentative.
Obtaining authentic interpreted texts and their corresponding source texts is by no means an easy task when one considers that professionals are not necessarily disposed to have their work scrutinized by researchers. Thus many studies resort to laboratory-style experimentation. Such a technique lends itself perfectly to interpreting especially if we consider that the interpreting situation is extremely similar to that of a ‘real life’ laboratory experiment (Flores d’Arcais 1978). Unfortunately though, here too, it is not so easy to find practitioners who are willing to lend themselves to such trials. Consequently, research is often conducted using students of interpretation or even bilinguals as guinea pigs; thus, perfectly valid experiments may be quite skewed simply owing to the fact that the subjects under scrutiny are not true interpreters.
Usually such text-analyses of transcribed texts of interpretations are conducted by linguists and examined in terms of error count – typically, timing and placing of hesitations, omissions, choice of syntactic structure and so on. Basically, the researcher seeks to compare how an interpreted text differs from the original text by objectively quantifying lack of correspondence between the two.[2] Hypothetically, this should result in an evaluation of fidelity, but how is fidelity to be defined? Assessors may not agree on the definition of fidelity or else may vary in their judgement of deviance from source to target text (Gile 1999:52 passim). Moreover, the problem of evaluating errors is further complicated if we consider that such ‘errors’ may not necessarily be ‘errors’ to the professional but deliberate interpreting strategies instead (Gile 1994: 47). With regard to omission, for example, Jones points out (1998:139) “there are cases when the interpreter is unfortunately not in a position to provide a totally complete and accurate interpretation” and when this occurs, “the interpreter omits in order to preserve as much of the original message as possible.”
Research carried out by Barik (1971 re-proposed in 1994) and Altman (1994) can be considered good examples of such an approach. Barik examines departures from the source text and assesses them in terms of non-equivalence. A major weakness in this study is that departures (like certain ‘errors’) may well be deliberate pragmatic ploys adopted by interpreters to produce more ‘user-friendly’ target texts, while Altman rather unsurprisingly claims that mistakes may “affect the communicative value of the speakers message” (1994:30).
2.1.1 Field work regarding end-user perception of interpretations
There are numerous examples of research based upon field work regarding end-user perception of interpretations. These studies can be generally subdivided into studies on the reception of fixed interpretations and studies on perception in general. However, the validity of surveys based entirely on the perception of quality by the end user is highly debatable. This is because the end user, e.g., a delegate at a conference who is likely to be an expert in the subject matter at issue but unfamiliar with the language of the source text, can only partially judge the quality of the target text.
The idea behind these studies probably comes from business studies where manufacturers have to produce not what they want but what consumers desire. So far, so good. In fact, it makes perfectly good sense to understand consumer needs (in our case end users) so that producers (i.e., interpreters) may then hypothetically gauge their deliveries. Unfortunately, the issue is not that simple. In fact, the first problem that we encounter in reasoning in business terms is that interpretations are not goods. Interpreting is a service and according to economics a service is an intangible and non-transferable economic good and thus quite distinct from a physical commodity. Therefore the special nature of interpreting makes its evaluation difficult for people who consume this service but know very little about it. Interpreting is not like food where consumers can use their sensorial capabilities (smell, taste and colour) to express their perceptions. Interpreting is a service that can be evaluated by end users only up to a certain point. In fact, delegates at conferences who put on a pair of headphones are likely to do so because they are not proficient in the speaker’s language; otherwise, why bother?
Hence, such surveys by questioning delegates, rather than investigating the quality of the interpretation, are looking at customer satisfaction, which is only half the story. A participant at a conference may well be satisfied with an interpretation but may not necessarily know how valid it is in terms of fidelity. Thus, with no terms of comparison, the average delegate is not the best person to judge. Such respondents can indeed make judgements on features such as intelligibility of discourse, speed of delivery and voice quality, but these features are only a small part of the interpreting process. A delegate would be hard put to judge features such as faithfulness of content or style, for example. Delegates who do not understand the orator’s language must simply put themselves in the hands of the interpreter and trust that an acceptable service will be offered. Translations are unlike other goods and services in that the proof of the translating pudding is not only in the eating.
Two important studies from the point of view of users were published by Kurz (1988 and 1993) in which she aimed at establishing whether there was any correspondence between interpreters’ opinions of quality criteria and users’ opinions. Basing her research tool on Bühler’s (see 2.1.2.) quality criteria for interpreters, she administered 47 questionnaires to delegates at a medical conference (1988) and subsequently to 29 participants at a conference on quality control and 48 delegates at a Council of Europe meeting (1993). She compared her results with those published by Bühler using the average on an ordinal scale from 1 to 4 (irrelevant, less important, important, highly important). Even if percentage would have given a better comparison, she found that user expectations differed according to the fields to which they belonged. Kurz’s samples were very small and uneven as well as being based upon returns of a questionnaire administered in three very different moments in time and in different contexts, thus weakening the rigour of the experiment. However, despite her discouragingly poor returns, Kurz’s research obviously struck a chord in many researchers who subsequently followed in her footsteps (e.g., Mack & Cattaruzza 1995, Moser 1996, Collados Ais 1998).
Other similar studies by Meak (1990) and Gile (1990) both revealed that different user groups differ in their perception of quality. In 1994, Kopezynski examined expectations at conferences from the point of view of both delegates and speakers. Rather unsurprisingly Kopezynski concluded that speakers and delegates have different expectations.
Finally Viezzi (1996) claims that users cannot give an objective account of quality evaluation and provides four parameters for assessing quality: equivalence, accuracy, adequacy and user-friendliness.
2.1.2. Field work regarding interpreter perception of interpretations in general
There appears to be only a single example of field work regarding interpreter perception of interpretations, the well-known study conducted by Bühler (1986) who realised that interpreters themselves can greatly contribute to assessing quality in interpretation. Bühler distinguishes a set of sixteen linguistic and extra-linguistic criteria (1986:234) that interpreters were asked to evaluate according to a scale that allowed respondents to choose between the following four values: highly important, important, less important, irrelevant. However, results from this study showed that interpreters valued most of the items as important or highly important, thus highlighting their difficulty in assigning an order of importance to the items that the researcher was investigating. The fact that respondents could not (or rather would not) make a choice perhaps could be avoided during the pilot stages of the questionnaire. If the interpreters were incapable of discriminating and were giving equal importance to all the criteria, this meant that something was faulty in the research design of the study rather than the supposition that everything is of equal importance in an interpretation.[3] Unfortunately, a substantial shortcoming of this particular study is that the mean was used as the descriptive statistic for analysing and discussing data and drawing conclusions when dealing with ordinal data. Percentages, mode or median would have described the data more correctly.[4]
3. The Investigation
3.1. Research Design
In the light of the considerations and results discussed so far, not least of which was the low number of respondents (47 in Bühler’s case) and the use of student interpreters as opposed to practitioners in so many other studies, the present investigation is an attempt to revise interpreters’ perception using a traditional instrument – the questionnaire, but administered in a highly innovative way; i.e., using a service offered by Internet: the World Wide Web. As a result, great care was taken in this research project not to fall into the traps that previous studies had failed to avoid. In fact, in methodological terms this study:
adopts an interdisciplinary attitude through the collaboration of interpreters, a linguist and a statistician[5];
allows researchers to swiftly reach a large number of heterogeneous respondents via the implementation of New Technology, and
uses fully-fledged practitioners rather than students.
3.1.1. Research Tools
Taking Bühler’s criteria as a starting point, following endless brainstorming sessions with professional interpreters, several interviews were conducted with different interpreters to establish which criteria especially came into play during interpreting. On the basis of these interviews, a short questionnaire was devised consisting of the following two blocks:
Block 1 (General Information): elicited information regarding respondents’ age, place of birth, qualifications and experience. These variables were subsequently used to describe the general characteristics of the sample.
-
Block 2 (Perception of linguistic and extra-linguistic criteria affecting the quality of interpretation): The criteria used in this investigation are the same as those used by Bühler but with two major differences:
As Bühler’s results showed that interpreters found it difficult to point to unimportant factors, in this study the criteria under scrutiny were not measured on an itemized-category scale but on a rank order scale instead. The difference between these two types of single-item scales is that respondents of an itemized-category scale must choose from one of several responses, options or categories, while on a rank order scale they are required to order a set of objects with regard to a common criterion.
Since rank order scales are more difficult than itemized-category scales because they involve comparison and hence require more attention and mental effort, linguistic and extra-linguistic criteria factors were kept separate on two different ranking-order scales. Respondents were asked to rank nine linguistic criteria and eight extra linguistic criteria from the most important to the least important. Thus interpreters who adhered to this initiative had to make 36 mental comparisons to complete the first scale and 28 for the second.[6] This is an acceptable number according to the literature on consumer perception (see Aaker et al. 1995).
3.1.2. Information technology[7]
In order to gather the data through the World Wide Web a Personal Web Server (PWS) running under Windows 2000 Professional and implementing Internet Information Server 5 was configured. Once the PWS was ready the research design required the preparation of two files in HTML (Hypertext Mark-up Language, see Oliver 1999), one file in ASP (Active Server Page) and another one in Access. Of the two files in HTML, one was a letter which presented the research to prospective respondents. This was linked to the other HTML file: the questionnaire. The transformation of the questionnaire into HTML required the implementation the <FORM> tag with the method ‘post’ and its mandatory attribute, ‘action,’ which specified what the PWS had to do with the information:
<FORM name=”X” action=”URL” method=post>
.
.
.
<\FORM>
In order to allow respondents to answer the questions the <FORM> tag included other tags such us <INPUT> … <\INPUT>, <SELECT> … <\SELECT> and their relative attributes. In this file, a control function in Java Script (see Flannagan 1998) was superimposed over the <FORM> tag. This script implemented the method alert and the instruction ‘If ‘ to avoid respondents submitting the questionnaire without having completed it. A special effort was made to devise a cycle FOR in Java Script that did not allow respondents to fill the rank order scale using the same number twice. In fact, when respondents clicked on the submit button without having filled in all the questionnaire or without having ranked correctly, Java Script did not permit them to do so. A message appeared on the respondents’ screens indicating which field had been left empty or if they had used the same number twice in ranking the linguistic and non linguistic criteria affecting quality. Finally, the action of the <FORM> tag was linked to an ASP file (see Russell Jones 2000). Each time the questionnaire was completed correctly an OBJDBCONNECTION was opened and closed to update the database in Access. The fields of the data base were, of course, linked to the form to store the records coming in from the World Wide Web.
The questionnaire was piloted on the web for a few days and launched definitively at the beginning of October 2000. Several spammings[8] were used to reach the interpreters and it was very interesting to observe how quickly respondents replied.
The advantages of this new technology applied to social science surveys are obvious. Not only do we save time and money, but we can also bank on a wider number of respondents. In fact, out of about 1000 invitations sent out to interpreters belonging to several professional associations, roughly 200 of which were returned to the sender because of mail delivery faults, 169 had responded within a fortnight. Thus the 10-15% rate of questionnaire returns that is normal for traditional surveys was doubled. A few clicks of the mouse while the recipient’s mail is open does not involve the effort of filling in and above all posting a traditional hard copy questionnaire.
3.1.3. Statistical analysis
In order to explore interpreters’ perception of linguistic factors affecting quality, multidimensional scaling (MDS) was performed using statistica for Windows. MDS is a multivariate statistical technique which allows the researcher to develop perceptual and evaluative ‘maps’ (i.e., geometric configurations) that summarize how people perceive various stimuli as being similar or different (see Hair et al. 1995). MDS uses principal components analysis as the starting configuration of the similarity matrix. The programme will then begin iterations under ‘steepest descent’ (Schiffman, Reynolds and Young 1981) with the goal of maximizing the goodness of fit (or minimizing ‘lack of fit’). The goodness of fit is measured by the raw stress value Phi:
In this formula, dij stands for the reproduced distances, given the respective number of dimensions and δij stands for δ the input data (i.e., observed distances). The expression f(δij) indicates a non-metric monotone transformation of the observed input data (distances). Thus the programme will attempt to reproduce the general rank-ordering distances of linguistic criteria affecting quality and thus to depict a map of interpreters’ attitudes regarding linguistic criteria.
4. Results
4.1. Description of the sample
The total sample of 286 respondents, is made up of 29% of males and 71% females. Roughly 44% were born in Western European countries, 27% in South and Central America, 19% in North America, 5% in Eastern European countries and 5% come from other countries. Data on qualifications of respondents show that people involved in this profession are highly qualified. In fact, 44% have a degree in interpreting, 25% in other subjects, 18% in languages, 5% are educated up to high school and 8% have other qualifications (see fig. 1).
The age of respondents is well distributed with a mean of 45 and a standard deviation of 9.8. It is also interesting to observe that on average respondents have at least 16 years’ experience and interpret around 66 hours per month (see table 1). Most of these interpreters work freelance and just 15% as permanent members of staff. Finally, most respondents do not interpret into their mother tongue.
Figure 1
Gender, country of birth and education of respondents

Table 1
Age and experience of respondents

These data show that the sample is quite robust as regards the qualification and experience of the respondents and thus should help to draw a significant map of interpreters’ perception of the criteria under investigation.
4.2. Perception of criteria affecting quality
The distribution of the degree of importance that interpreters assigned to each of these criteria has been represented in fig. 2. As can be observed from this figure, interpreters ranked linguistic criteria in the following way:
consistency with the original, completeness of information and logical cohesion were considered to be the three most important factors involved;
fluency of delivery, correct terminology and correct grammatical usage were the second most three important factors and
appropriate style, pleasant voice and native accent were considered the least important.
Figure 2
Distribution of the degree of importance given to each linguistic criteria

The distributions of degree of importance given to the three most important criteria are skewed to the right showing preference towards the high rank of the scale. Among these three, ‘consistency with the original’ is considered the most important criterion (mode 41%) as could be expected and in line with other studies. Among the distribution of the second three most important factors ‘fluency of delivery’ is the fourth most important. In fact, its distribution is slightly skewed on the right while that of the other two criteria resembles a Gaussian indicating that most interpreters consider these factors of medium importance. The distribution of the least important three features tails off to the right and here we find stylistic and vocal features on a continuum of judgemental subjectivity which moves from style, through accent to mother tongueness.
Thus, the consensus was to rank two non-discrete features in first and second position. We would like to suggest that this is likely to correspond closely to end-user desirability. After all, the end-user needs to have a faithful rendering of what is being said, with as little as possible left out and furthermore delivered in a logical fashion. Interestingly, we find the latter feature, logical cohesion, an obviously important element for the end user, in third position on the boundary of the two most discrete items terminology and grammar.
Whether cohesion is seen as a grammatical element which defines the property of words as grammatical units or in Hallidayan terms as a surface structure feature of text, cohesion could not have occurred in a more apt position. It is also worth noting that the three most important features all concern content and logic of discourse and tail to the left while, as we approach discrete items, we find a normal distribution curve. What surprised us somewhat was practitioners’ leniency towards terminology and grammar, the scores of which produce normal distribution. We would like to suggest that this reflects a certain tolerance in the average delegate who possibly may not expect terminological precision.
With regard to the ratings given to extra-linguistic criteria, data analysis has shown, with the exception of the first two, that the degree of importance is not so neat as that resulting from linguistic factors. In order to summarise and to depict the classification of non-linguistic criteria the sum of the score for each of these was plotted in fig. 3. As can be observed, ‘concentration’ and ‘preparation of documents’ are perceived as being the most important extra linguistic features contributing to quality totalling respectively a score of 1932 and 1598.
Figure 3
Sum of the scores given to extra-linguistic criteria

The other factors are perceived as more or less of equal importance and follow the first two in the following order: ability to work in a team (1218), endurance (1208), physical well-being (1184), mnemonic skills (1122), encyclopaedic knowledge (1068) and absence of stress (1064).
Not surprisingly, concentration is considered by far the most important non-linguistic feature as it must surely be the effort sine qua non upon which other simultaneous efforts must pivot. Preparation of conference documents is also given great importance, even if it falls way behind concentration. It would thus appear that interpreting into a specific micro language with which, for example, the practitioner may not have much experience and consequently causing him to feel ill at ease, must surely be responsible for considerable stress.
In order to draw a perceptual map (i.e., geometric configurations), the data on linguistic criteria were further explored using Multidimensional scaling. The ‘scree test’,[9] which was performed plotting the stress value against a different number of dimensions, indicated that in our analysis two dimensions were the best solution for our data. Moreover, the Shepard diagram shows that reproduced distances fall close to the step-function (monotone transformation of the input data) and thus fit the model well.
Figure 4
Shepard diagram of linguistic criteria
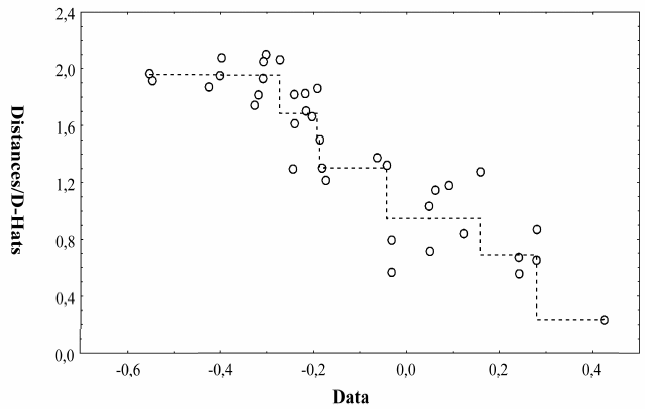
 Distances and
 D-Hats vs. Data
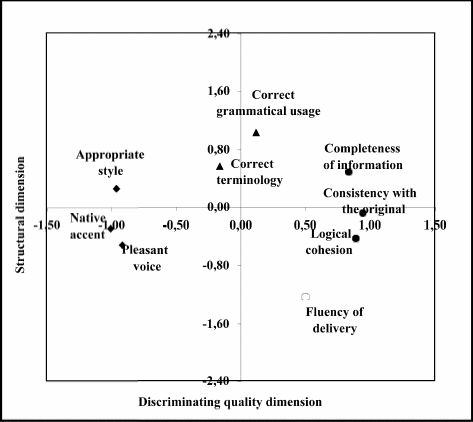
The map drawn in this bi-dimensional space summarises how interpreters have perceived the similarity of the criteria under investigation. We have thus labelled this map interpreter’s image of linguistic criteria; its horizontal axis discriminating quality axis and the vertical axis structural axis. This chart confirms and strengthens our previous findings i.e., the first three factors (completeness of information, consistency with the original and cohesion) score very closely on the right of the discriminating quality axis highlighting that they appear to be perceived in a more or less similar way. We have labelled these factors crucial quality criteria. As we move along the axis towards the left we move towards the negative side finding voice quality, accent and style. These three criteria score very closely with each other showing that interpreters perceive them in a similar way. We have labelled these three features embellishing criteria. The discrete features of lexis and grammar score very closely and positively on the structural axis.
The only criterion in this map that appears to stand alone and thus results in being dissimilar to any other features is fluency of delivery. Why this should be so is hard to say, but the map certainly suggests that intonation is considered by interpreters to be neither entirely crucial nor totally embellishing, yet on the interface of the two dimensions. On balance, considering that fluency in language plays the double role of both embellishment (i.e., in terms of speed, voice control and absence of hesitation.) and structure (i.e., the supra segmental significance of stress, pitch and tone) then it would appear that this feature has indeed been placed where it would most obviously occur.
Figure 5
Interpreter’s image of linguistic criteria
5. Conclusions
Firstly, we would like to stress the importance of information technology without which the findings of this investigation would not have been possible without spending vast sums of money and employing twice the number of researchers. Thanks to web technology, the research did away with the inconvenience of questionnaire administration and inputting data. All we had to do was to sit comfortably and wait for replies from respondents to appear on our desktops: the data arrived like manna from heaven! Thus the methodology employed seems to open up new avenues not only in the field of interpretation but also for investigation in other social sciences as the New Economy is calling and pushing for new research methods.
However, with respect to our findings, contrary to common belief, results highlight that interpreters do not consider all the criteria in question as being of more or less equal importance but that they do have preferences and are constantly making preferential choices that affect the quality of interpretation. Such preferences should be taken into consideration by people involved in improving working standards of interpretation and by those involved in education.
However, even if the results of our survey seem to indicate yardsticks upon which to base quality standards, these criteria only seem to be marginally within the control of interpreters themselves. There appears to be an element of uncontrollability inherent to the interpretative process that is obviously linked to the ‘speaker-interpreter-environment’ triad. This triad, according to us, appears to generate both technical and personal difficulties as well as variables that are highly dependent on the context of the situation. None of these elements are easy to postulate a priori.
In conclusion, the absence of quality standards that characterises the work of professional interpreters appears to be linked to the uniqueness of the interpreting process itself. In fact, both the complexity and the interaction of the various factors involved in the course of interpreting are not easy to manage, simply because interpreters are not machines that are directed by human beings. In this case it is human beings themselves who are responsible for the quality of the process in question. As well as being unique, each interpreter must also manage the context (which is also always unique) in which s/he operates in the best possible way.
So, how can quality be improved? We would like to suggest that the answer lies in three basic areas: training, specialization and technological innovation. Firstly, with regard to quality, specialists involved in training interpreters should certainly focus more closely on quality. It is a well known fact that traditionally training schools for interpreters in Europe rely on tough selective processes and tend towards the creation of an ‘élite.’ However we must not forget that it is still possible to slip through even the most discriminating cracks. Secondly, not only should we aspire towards the development of more terminological databases, but it is also desirable that such databases be used much more by interpreters. It would appear that at present terminological databases are mainly used by translators. Last but not least, the use of PC’s in booths, on-line terminological databases etc. may well be an added bonus to improvements in quality standards, as shown by the results of a recent survey carried out by the European Commission.[10]
Only by working simultaneously on all three of the aforementioned fronts will it be possible to reduce the causes that have negative effects on interpreters’ performance and obtain interpretations that constantly offer acceptable standards of quality. At that point, any variation observed in the output of interpreters can only be attributed to the ability of the single professional. And this is likely to be the case until machines completely replace the work of interpreters. But fortunately that day is still a long way off.
Appendices
Notes
-
[1]
The term ‘product’ here is not used in the strict economic sense because interpreting is a service and therefore does not provide goods. In this study the term product is used to indicate interpreted texts as physical entities that are thus ‘tangible’ (and hence analysable) with the support of transcription.
-
[2]
Interest in error counts is clearly reflected by the numerous degree dissertations based on laboratory style experimentation carried out by undergraduates from the two Italian Scuole Superiore di Lingue Moderne per Interpreti e Traduttori of the Universities of Bologna (Forlì) and Trieste.
-
[3]
While we do not wish to undermine the difficulty and the complexity of interpreting, we would nevertheless like to suggest that the interpreter continually makes choices and that, while bearing in mind the inextricability of the individual elements involved in the process, he/she must, in some way, privilege some at the cost of others.
-
[4]
Again, Gile (1994) is highly critical of many researchers’ mathematical skills and calls for more collaboration with experts outside the field when attempting linguistic analyses.
-
[5]
The authors would like to particularly thank Peter Mead and Alessandro Messina for their precious advice.
-
[6]
For n objects there are [n(n-1)/2] comparisons – in our case the objects were 9 and 8.
-
[7]
The authors would like to thank Mauro Andrea Cremonini for transmitting his passion in Information Technology.
-
[8]
Spamming is the term used in IT to refer to the same e-mail sent to more people at the same time. The e-mail addresses of these interpreters were gathered visiting the websites of the interpreters.
-
[9]
The scree plot is a test performed to decide how many dimensions are used in drawing the perceptual map. Starting with the first dimension the plot slopes steeply downward initially and then slowly becomes an approximately horizontal line. The point at which the curve first begins to straighten out is considered to indicate the maximum number of dimensions to plot.
-
[10]
Survey 23/05-03/09/2001 Commission Europeenne Service Commun Intreprétation – Conference (SCIC) 1/10/2001.
References
- Aaker, D.A., Kumar, V. and G.S. Day (1995): Marketing Research, New York: John Wiley.
- Altman, J. (1994): “Error analysis in the teaching of simultaneous interpreting: a pilot study,” S. Lambert and B. Moser-Mercer (eds.), pp. 25-48.
- Barik, H.C. (1971): “A description of various types of omissions, additions and errors of translation encountered in simultaneous interpretation,” Meta 16-4, pp. 199-210.
- Barik, H.C. (1994): “A description of various types of omissions, additions and errors of translation encountered in simultaneous interpretation,” S. Lambert and B. Moser-Mercer (eds.), pp. 121-137.
- Bühler, H. (1986): “Linguistic (semantic) and extra-linguistic (pragmatic) criteria for the evaluation of conference interpretation and interpreters,” Multilingua 5 (4) pp.231-235.
- Chiaro, D. and G. Nocella (2000): “Impresa e Servizi Linguistici: un’indagine conoscitiva in Emilia-Romagna,” (Giuliana Garzone ed.) Quale curriculum linguistico per l’azienda? Linguisti ed Aziendalisti a confronto, CLUEB, Bologna, pp. 87-197.
- Chiaro, D. and G. Nocella (1999): “Language Management in Italy: a Survey of the Translation Market in Emilia-Romagna,” Basnett S., Bosinelli R.M.& Ulrych M.(eds). Textus, XII pp. 351-368.
- Collados Ais, A. (1998): La evaluación de la calidad en interpretación simultánea. La importancia de la comunicación no verbal, Granata, Editorial Comares.
- Flanagan, D. (1998): Java Script: la guida, Milano, Apogeo.
- Flores d’Arcais, G.B. (1978): “The Contribution of Cognitive Psychology in the Study of Interpretation,” D. Gerver and W. H. Sinaiko (eds.) Language Interpretation and Communication. New York, Plenum, pp. 385-402.
- Gile, D. (1990): “L’évaluation de la qualité de l’interprétation par les délégués: une étude de cas,” The Interpreters’ Newsletter, 3, pp. 66-71.
- Gile, D. (1994): “Methodological Aspects of Interpretation and Translation Research,” Sylvie Lambert and Barbara Moser-Mercer (eds.) Bridging the Gap. Empirical Research in Simultaneous Interpretation, Amsterdam, John Benjamins.
- Gile, D. (1999): “Variability in the perception of fidelity in simultaneous interpretation” Hermes, Journal of Linguistics, 22, pp. 51-79.
- Hair, J. F., Anderson, R. E., Tatham, R. L., and W. C. Black (1995): Multivariate Data Analysis with Readings, New Jersey, Prentice Hall.
- Hermans, T. and J. Lambert (1998): “From Translation Markets to Language Management, the Implications of Translation Services,” Target 10/1, pp. 113-133.
- Jones, R. (1998): Conference Interpreting Explained, Manchester, St. Jerome.
- Kurz, I. (1988): “Conference Interpreting: User Expectations,” in ATA Proceedings of the 30th Annual Conference, pp. 143-148.
- Kurz, I. (1993): “Conference interpretation: expectations in different user groups,” The Interpreters’ Newsletter, 5, pp. 13-21.
- Kopezynski, A. (1994): “Quality in conference interpreting: some pragmatic problems,” Sylvie Lambert and Barbara Moser-Mercer (eds.).
- Lambert, S. and B. Moser-Mercer (eds.) (1994): Bridging the Gap. Empirical Research in Simultaneous Interpretation, Amsterdam, John Benjamins.
- Mack, G. and L. Cattaruzza (1995): “User surveys in SI: a means of learning about quality and/or raising some reasonable doubts,” Tommola, pp. 37-49.
- Meak, L. (1990): “Interprétation et congrès medical: attentes et commentaires,” The Interpreters’ Newsletter, 3 pp. 8-13.
- Oliver, D. (1999): Teach Yourself HTML 4 in 24 Hours, Indianapolis, Sams Publishing.
- Russell Jones, A. (2000): Mastering Active Server Page 3, San Francisco, Sybex.
- Schiffman, S. S., Reynolds, M. L. and F. W. Young (1981): Introduction to multidimensional scaling: Theory, methods and applications, New York, Academic Press.
- Viezzi, M, (1999): Quality Forum 199 Esperienze, Problemi, Prospettive, Trieste, Scuola Superiore di Lingue Moderne per Interpreti e Traduttori.
List of figures
Figure 1
Gender, country of birth and education of respondents
Figure 2
Distribution of the degree of importance given to each linguistic criteria
Figure 3
Sum of the scores given to extra-linguistic criteria
Figure 4
Shepard diagram of linguistic criteria
Distances and
D-Hats vs. Data
Figure 5
Interpreter’s image of linguistic criteria
List of tables
Table 1
Age and experience of respondents