
Résumés
Abstract
Inference using large datasets is not nearly as straightforward as conventional econometric theory suggests when the disturbances are clustered, even with very small intra-cluster correlations. The information contained in such a dataset grows much more slowly with the sample size than it would if the observations were independent. Moreover, inferences become increasingly unreliable as the dataset gets larger. These assertions are based on an extensive series of estimations undertaken using a large dataset taken from the U.S. Current Population Survey.
Corps de l’article
Introduction
In econometrics and statistics, it is generally believed that a large sample is always better than a small sample drawn in the same way from the same population. There are at least two reasons for this belief. When each observation contains roughly the same amount of information, a large sample must necessarily contain more information than a small one. Thus we would expect to obtain more precise estimates from the former than from the latter. Moreover, we would expect a large sample to yield more reliable inferences than a small one whenever confidence intervals and hypothesis tests are based on asymptotic theory, because the assumptions of that theory should be closer to being true.
In practice, however, large samples may not have the desirable properties that we expect. In this paper, I point out that very large samples need to be used with care. They do indeed contain more information than small samples. But they may not contain nearly as much information as we think they do, and, if we are not careful, inferences based on them may actually be less reliable than inferences based on small samples.
The fundamental problem is that, in practice, the observations in most samples are not entirely independent. Although small levels of dependence have minimal consequences when samples are small, they may have very substantial consequences when samples are large. The objective of this paper is to illustrate those consequences.
The theoretical implications of within-sample dependence have been studied in detail in Andrews (2005). Unlike that paper, this one is not concerned with econometric theory, except at a rather superficial level. Instead, the paper attempts to see whether such dependence is actually a problem. To that end, it performs various estimations and simulations using a real dataset, which is quite large (more than 1.15 million observations), and it obtains some surprising results. Of course, because the data are real, we do not really know how they were generated. But it seems clear that there is dependence and that it has profound consequences.
1. The Data and an Earnings Equation
The data are taken from the Current Population Survey for the United States. There are 1,156,597 observations on white men aged 25 to 65 for the years 1979 through 2015. Each observation is associated with one of 51 states (including the District of Columbia). There are 4,068 observations for the smallest state (Hawaii), and there are 87,427 observations for the largest state (California).
It is common to estimate an earnings equation using data like these. The dependent variable is the logarithm of weekly earnings. The independent variables are age, age squared, and four education dummies (high school, high school plus two years, college/university, at least one postgraduate degree). Thus the basic equation to be estimated is
where g indexes states from 1 to 51, t indexes years from 1 to 37, i indexes individuals within each year, and Yearjgti is a dummy variable that equals 1 whenever t = j. The time fixed effects are essential because earnings (which are not adjusted for inflation) tend to increase over time and vary over the business cycle.
Suppose we are interested in the value of having a postgraduate degree. The percentage increase in earnings relative to simply having a university degree is
where φ ≡ β5 – β4. The OLS estimates of β5 and β4 are 0.80293 and 0.68498, respectively. Using the left-hand side of equation (2) and the delta method, we estimate the percentage increase to be 12.519% with a standard error of 0.225. The latter is based on a heteroskedasticity-consistent covariance matrix, specifically the HC1 variant; see MacKinnon and White (1985). This implies that a 95% confidence interval is [12.077, 12.961].
So far, everything looks good. I seem to have obtained a fairly precise estimate of the effect on earnings of having a postgraduate degree. However, equation (1) is a bit too simple. Because the data have both a time dimension and a cross-section one, it makes sense to model the disturbances as
This is called an error-components model. The vt are time components, and the wg are cross-section components, which can be treated as either fixed or random.
It has been known for a very long time that ignoring error components can lead to severe errors of inference; see Kloek (1981) and Moulton (1986, 1990). The conventional approach is to use either a random-effects or a fixed-effects specification. The former is a particular type of generalized least squares, and the latter involves adding dummy variables for the time and cross-section fixed effects. Because the random-effects specification requires the strong assumption that the vt and wi are uncorrelated with the regressors, it is safer to use the fixed-effects specification when possible. With a large sample like this one, and no regressors that would be explained by all the dummies, it is natural to use fixed effects.
Since equation (1) already contains time dummies, using fixed effects simply means adding 50 state dummies. When that is done, the OLS estimate of β5 – β4 is 0.10965. The implied percentage increase is 11.589% with an HC1 standard error of 0.222. The resulting 95% confidence interval is [11.155, 12.023]. Adding the state dummy variables has caused our estimate of the value of a postgraduate degree to drop by almost a full percentage point, or more than four standard errors. However, the width of the confidence interval is almost unchanged.
2. Clustered Disturbances
Until fairly recently, many applied econometricians would have been quite happy with the estimates given at the end of the previous section. If the earnings equation (1) and the error-components specification (3) are correct, those estimates and their standard errors should be reliable. However, the error-components specification is actually quite restrictive. Among other things, it forces the effects of time trends and the business cycle to be the same for every state. It also implies that what remains of the disturbances after the time and state dummies have removed their respective error components must be uncorrelated. As we will see shortly, this implication is emphatically not true for the model and dataset that I am using.
In modern applied work with individual data that come from multiple jurisdictions, it is customary to treat each jurisdiction as a cluster and to allow for arbitrary patterns of intra-cluster correlation. The model (1) can be thought of as a special case of the linear regression model
where g indexes states and the gth cluster has Ng observations. Here X, y, and u have N = ∑Gg = 1Ng rows, X has K columns, and β is a K–vector. In the case of (1) with state dummies added, G = 51, K = 83, and N = 1,156,597. If we allow for an arbitrary pattern of within-cluster correlation and assume that there is no inter-cluster correlation, then the true covariance matrix of the vector u is
where Ωg = E(ugu'g) is the covariance matrix of the disturbances for the gth cluster.
Even though we do not know, and cannot consistently estimate, the Ωg matrices, it is possible to estimate the covariance matrix (5) consistently when G is large. The most popular cluster-robust variance estimator, or CRVE, is
where ûg denotes the vector of OLS residuals for cluster g, and û denotes the vector of all the OLS residuals. This matrix seems to have been proposed first in Liang and Zeger (1986). It can be thought of as a generalization of the HC1 heteroskedasticity-consistent covariance matrix.
There are also cluster generalizations of the HC2 and HC3 matrices. The former was proposed in Bell and McCaffrey (2002), and there is evidence that it performs somewhat better than CV1; see MacKinnon (2015) and Imbens and Kolesar (2016). Unfortunately, the CV2 and CV3 covariance matrices involve taking either the inverse symmetric square root or the ordinary matrix inverse of Ng × Ng matrices for g = 1,…,G. These matrices are the ones on the diagonal block of the projection matrix MX ≡ I – X(X'X)–1X'. For the dataset I am using, Ng can be as large as 87,427, for California, so that it would be totally infeasible to use either CV2 or CV3 [1].
It is easy to compute a test statistic that has the form of a t statistic by dividing any parameter estimate by the square root of the appropriate diagonal element of (6). It is then customary to compare this test statistic with the t(G – 1) distribution rather than the t(N – K) distribution; see Donald and Lang (2007) and Bester, Conley et Hansen (2011). Intuitively, we use G – 1 because there are only G terms in the summation in (6).
For the earnings equation (1), there are at least two natural ways to form a cluster-robust covariance matrix. One is to cluster by state, so that there are 51 clusters, and the other is to cluster by state-year pair, so that there are 1887 clusters. I now re-estimate the standard error of the percentage change in wages associated with a postgraduate degree using these two methods.
Table 1
Value of a Postgraduate Degree
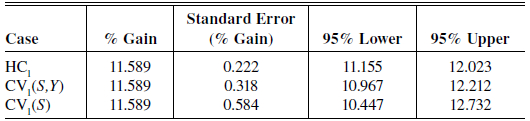
Note: HC1 does not cluster at all. CV1(S,Y) uses 1887 clusters at the state-year level, and CV1(S) uses 51 clusters at the state level.
Table 1 shows three different standard errors, and the associated confidence intervals, for the value of a postgraduate degree. The substantial variation among the standard errors provides clear evidence of clustering, both within state-year pairs and across years within states. Since clustering at the state-year level imposes stronger restrictions on the covariance matrix than clustering at the state level, the large drop in the standard error when we move from the latter to the former provides convincing evidence that state-year clustering is too restrictive.
The only standard error in Table 1 that might be reliable is the one in the last line. It is 2.63 times the standard error in the first line. Increasing the standard error by a factor of 2.63 is equivalent to reducing the sample size by a factor of 2.63 squared. In other words, this sample of 1,156,597 observations, which are evidently dependent within state -level clusters, appears to be equivalent to a sample of approximately 167,000 independent observations.
It is not hard to see why this sample contains much less information than its large size would lead us to expect. Consider the sample mean y̅ = (1/N)∑Ni = 1 yi. The usual formula for the variance of y̅ is
Thus the standard error of y̅ is proportional to N–1/2.
The standard formula (7) assumes that Var(yi) = σ2 and Cov(yi,yj) = 0. A formula for the variance of the sample mean that is valid under much weaker assumptions is
Heteroskedasticity is not a serious problem. IfVar(yi) = σ2i, we just need to define σ2 as N–1 ∑Ni = 1σ2i, and the first term on the right-hand side of equation (8) simplifies to (7). However, if the Cov(yi, yj) are not all zero, equation (8) as a whole cannot possibly simplify to equation (7).
Now consider the two terms on the right-hand side of equation (8). The first term is evidently O(1/N). But the second term is O(1), because it involves two summations over N, and it is divided by N2. Thus, even if the Cov(yi, yj) terms are very small, the second term on the right-hand side of equation (8) will eventually become larger than the first term[2]. As N → ∞, under appropriate regularity conditions, the first term will vanish, but the second term will converge to a positive constant. Thus, for large enough sample sizes, additional observations will provide essentially no additional information.
This disturbing result implies that, for large samples with clustered disturbances and a fixed number of clusters, the accuracy of the estimates will grow more slowly than N1/2 and will be bounded from above.
Figure 1
Inverse of s( ) as a Function of M
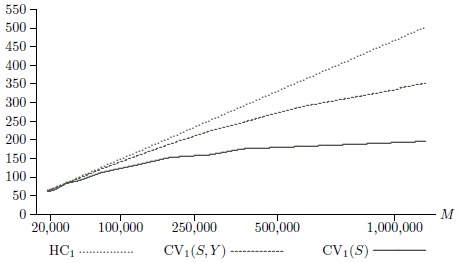
In order to investigate whether this phenomenon is important for the model and data used here, I created multiple subsamples of various sizes, ranging from 1/64 of the original sample to 1/2 of the original sample. Let M denote the reduced sample size, where M ≅ N/m for m = 2, 3, 4, 6, 9, 16, 25, 36, 49, 64. Then the subsamples of size M were created by retaining only observations m + j, 2m + j, and so on, for a number of values of j ≤ m.
Figure 1 graphs the inverse of the average of the reported standard errors of ![]() for three covariance matrix estimators against M, where the horizontal axis is proportional to the square root of M. For values of M less than about 30,000, the three standard errors are essentially the same. For larger values of M, the heteroskedasticity-robust standard errors remain proportional to
for three covariance matrix estimators against M, where the horizontal axis is proportional to the square root of M. For values of M less than about 30,000, the three standard errors are essentially the same. For larger values of M, the heteroskedasticity-robust standard errors remain proportional to ![]() , so the figure shows a straight line. However, the two cluster-robust standard errors decline more slowly than
, so the figure shows a straight line. However, the two cluster-robust standard errors decline more slowly than ![]() . In consequence, their inverses increase more slowly. For state-level clustering, the inverse standard errors increase very slowly indeed beyond about M = 250,000.
. In consequence, their inverses increase more slowly. For state-level clustering, the inverse standard errors increase very slowly indeed beyond about M = 250,000.
We cannot be at all sure that the state-level clustered standard errors are reliable[3], but we do know that the other two standard errors are too small. Thus the lowest curve in Figure 1 puts an (approximate) upper bound on the rate at which accuracy improves with sample size for the parameter φ with this dataset. As the theory suggests, this rate is very low for large sample sizes.
3. Placebo Law Experiments
Although it is important to obtain accurate confidence intervals for economically interesting parameters such as φ, it is probably even more important to make valid inferences about the effects of public policies. Equations similar to (1) are often used for this purpose. Suppose that certain jurisdictions (in this case, certain states) have implemented a particular policy at various points in time. Then, by adding a treatment dummy variable that equals 1 for every state and time period when the policy was active to such an equation, economists can estimate the effect of the policy on the dependent variable and test whether it was statistically significant.
This sort of empirical exercise is often called “difference in differences” or “DiD.” In the simplest case, such as Card and Krueger (1994), there are just two jurisdictions and two time periods, and it is not possible to use clustered standard errors. However, most DiD regressions involve several jurisdictions (for example, 51 states) and quite a few time periods, and it is routine to allow for clustering. It may not be immediately obvious that adding an appropriate dummy variable to an equation like (1) is equivalent to difference in differences, but this is in fact how almost all DiD exercises are performed nowadays; see Angrist and Pischke (2008).
One way to examine the reliability of inference with clustered data is to simulate the effect of “placebo laws” in DiD regressions. This ingenious idea was developed in Bertrand, Duflo and Mullainathan (2004), which uses a regression similar to (1), but for a shorter time period, with data for women instead of men, and with different education variables. Instead of generating a new dataset for each replication, a placebo-law experiment simply generates a new treatment dummy variable. These treatment dummies are entirely artificial, so they should not actually have any impact on the dependent variable. MacKinnon and Webb (2017) performs an extensive set of placebo-law experiments using essentially the same dataset and specification as Bertrand, Duflo and Mullainathan (2004).
In this section, I perform a large number of placebo-law experiments. The number of “treated” states, denoted G1, varies from 1 to 51. If a state is treated, its treatment can start in any year from 1984 to 2010, with equal probability. Thus the number of possible treatment dummy variables is 51 × 27 = 1377 for G1 = 1, 51 × 50 × 272/2 = 929,475 for G1 = 2, and very much larger numbers for larger values of G1. In the experiments, I enumerate all possible treatment dummies for G1 = 1, so that there are 1377 replications. For G1 > 1, I choose 40,000 treatment dummies at random, with replacement, from the sets of all possible treatment dummies.
Figure 2
Rejection Frequencies for Placebo Law Tests, N = 1,156,597
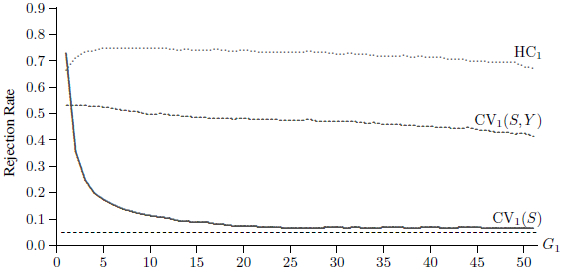
Figure 2 reports rejection frequencies at the 5% level for t statistics based on the HC1, CV1(S, Y), and CV1(S) covariance matrices for all 51 possible values of G1. Only CV1(S) ever yields inferences that are close to being reliable. Tests based on heteroskedasticity-robust standard errors always overreject extremely severely. Tests based on clustering at the state-year level also always overreject very severely. In contrast, tests based on clustering at the state level overreject moderately for G1 > 15. However, there is severe overrejection for G1 ≤ 5 and extreme overrejection for G1 = 1 and G1 = 2.
The reason for the extreme overrejection by CV1(S) when G1 is small is explained in MacKinnon and Webb (2017). Suppose that δ denotes the coefficient on the treatment dummy, which must be orthogonal to the residuals for all treated observations. When the treated observations all belong to very few groups, this means that the row and column of the middle factor in expression (6) which correspond to δ are much too small. In consequence, the CRVE grossly underestimates the variance of ![]() when G1 is small. This causes the variance of the t statistic to be much too large, leading to severe overrejection.
when G1 is small. This causes the variance of the t statistic to be much too large, leading to severe overrejection.
Since they reject so often, the test statistics for δ = 0 must have very much larger standard deviations than t statistics should have. In fact, for G1 = 25, the standard deviations are 5.65, 2.78, and 1.10 for statistics based on HC1, CV1(S, Y), and CV1(S), respectively. This means that, if the HC1 and CV1(S, Y) t statistics are approximately normally distributed, we will obtain test statistics greater than 5.65 and 2.78 in absolute value, respectively, more than 30% of the time. Thus, when we use the wrong covariance matrix, there is a very substantial probability of obtaining by chance a test statistic that appears to be not merely significant, but highly significant.
Based on the results of Section 2, in particular the ones in Figure 1, it seems plausible that the placebo-law experiments would have yielded different results if the sample size had been smaller. In order to investigate this conjecture, I reduced the sample size to M ≅ N/m by retaining observations numbered m, 2m, and so on, for m = 2, 5, 10, and 20. I then performed the same set of 51 placebo-law experiments for each value of M as for the full sample, except that I used 100,000 replications instead of 40,000 for m = 5, 10, and 20.
Figure 3
Rejection Frequencies for Placebo Law Tests, HC1

Figure 3 shows 5% rejection frequencies for HC1t statistics for five sample sizes. These decrease steadily and quite dramatically as the sample size drops. When M = N/20 = 57,829, they are never more than 22.4%. In contrast, when M = N = 1,156,597, they can be as large as 74.8%. Thus it is evident that failing to account for clustered disturbances leads to increasingly serious errors of inference as the sample size increases.
Figure 4
Rejection Frequencies for Placebo Law Tests, CV1(S, Y)
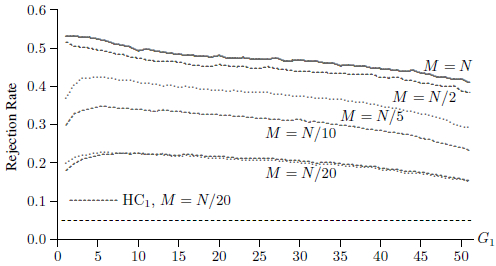
Figure 4 shows 5% rejection frequencies for CV1(S, Y) t statistics for the same five sample sizes. These also decrease quite dramatically as the sample size drops, but they are not as bad for large sample sizes as the ones in Figure 3. For the very smallest sample, with M = 57,829, the CV1(S, Y) and HC1 rejection frequencies are almost indistinguishable. This suggests that the consequences of whatever within-sample correlations clustering at the state-year level picks up must be relatively small compared to those of the within-state, cross-year correlations that clustering at the state level picks up.
Figure 5
Rejection Frequencies for Placebo Law Tests, CV1(S)

Figure 5 shows 5% rejection frequencies for CV1(S) t statistics for the same five sample sizes. It looks very different from Figures 3 and 4. In this case, sample size does not seem to matter. The five curves are almost on top of each other[4]. This suggests that the CV1(S) covariance matrices are taking proper account of whatever within-sample correlations there may be. Clustering at the state level seems to be sufficient.
4. The Wild Cluster Bootstrap
Based on Figure 5, it appears that, with large samples like this one, inferences based on cluster-robust covariance matrices are likely to be inaccurate, especially when the number of treated clusters is small. For most values of G1, however, it is possible to obtain more accurate inferences by using the wild cluster bootstrap. This procedure was proposed by Cameron, Colbach and Miller (2008) and studied in detail by MacKinnon and Webb (2017).
For hypothesis testing, the preferred variant of the wild cluster bootstrap uses the following DGP to generate the bootstrap data:
Here Xig is the vector of regressors for observation i within cluster g, ũig is the residual for that observation based on OLS estimation subject to whatever restriction(s) are to be tested, β̃ is a vector of restricted OLS estimates, and ![]() is an auxiliary random variable. Notice that the same value of
is an auxiliary random variable. Notice that the same value of ![]() multiplies every residual ũig in group g. This ensures that the bootstrap DGP mimics the intra-cluster correlations of the residuals. Unless G is very small, it seems to be best to draw
multiplies every residual ũig in group g. This ensures that the bootstrap DGP mimics the intra-cluster correlations of the residuals. Unless G is very small, it seems to be best to draw ![]() from the Rademacher distribution, which is equal to 1 and –1 with equal probabilities. However, this can cause problems when G is less than about 12; see Webb (2014).
from the Rademacher distribution, which is equal to 1 and –1 with equal probabilities. However, this can cause problems when G is less than about 12; see Webb (2014).
The DGP (9) is used to generate B bootstrap samples which satisfy the null hypothesis, say that βk = 0. In order to test that hypothesis, each of these is used to calculate a bootstrap test statistic
where ![]() is the estimate of βk from the bth bootstrap sample, and
is the estimate of βk from the bth bootstrap sample, and ![]() is the kth diagonal element of a corresponding cluster-robust covariance matrix such as (6). The bootstrap P value is then the fraction of the
is the kth diagonal element of a corresponding cluster-robust covariance matrix such as (6). The bootstrap P value is then the fraction of the ![]() that are more extreme than the actual test statistic tk. For a symmetric bootstrap test, this would be
that are more extreme than the actual test statistic tk. For a symmetric bootstrap test, this would be
where ![]() (⋅) denotes the indicator function.
(⋅) denotes the indicator function.
Figure 6
Rejection Frequencies for Bootstrap Placebo Law Tests

Figure 6 shows rejection frequencies for wild cluster bootstrap tests at the .01, .05, and .10 levels. These are based on 10,000 replications with B = 399. Results are shown only for G1 = 1, … , 24 and G1 = 25, 30, … , 50 because each experiment took at least seven days of computer time. The bootstrap tests perform very well, although not quite perfectly, for G1 ≥ 25. They underreject severely when G1 is very small, and they overreject moderately for values of G1 that are quite small but not very small.
MacKinnon and Webb (2017) explains why the bootstrap tests underreject to such an extreme extent when G1 is very small. An alternative form of the wild cluster bootstrap test, which uses unrestricted residuals and parameter estimates instead of restricted ones, would have overrejected very severely in the same cases. These features of the wild cluster bootstrap are very unfortunate. We cannot learn much from a test that almost never rejects (restricted wild cluster bootstrap) or from a test that very often rejects (unrestricted wild cluster bootstrap). A number of alternative methods have been proposed to handle the situation in which G1 is very small, but it appears that none of them can safely be relied upon to provide reliable inference in all cases; see Conley and Taber (2011) and MacKinnon and Webb (2016a, 2016b).
5. “Canadian” Data
Because the CPS dataset I have been using is for the United States, there are 51 clusters. In many empirical studies, however, the number of clusters is much smaller than that. With Canadian data, for example, it would often be natural to cluster at the provincial level, which implies that G = 10.
In order to see what happens when there are just ten clusters, I perform an additional set of placebo-law experiments using “Canadian” data. The data are not actually for Canada. Instead, I take data for ten U.S. states from the dataset I have been using. The idea is to choose states for which the sample sizes closely match the sample sizes for the Labour Force Survey in Canada. The chosen states, with their Canadian counterparts in parentheses, are California (ON), Texas (QC), New Jersey (BC), Massachusetts (AB), North Carolina (MB), Minnesota (SK), Maine (NS), Oregon (NB), Louisiana (NL), and the District of Columbia (PE). The sample has N = 317,984 observations.
The model is the same one used in the previous section, except that there are 9 “provincial” dummies instead of 50 state dummies. Once again, placebo-law treatments are allowed to start in any year between 1984 and 2010. This implies that, when G1 = 1, there are only 10 × 27 = 270 possible choices for the treatment dummy. When G1 = 2, there are (10 × 9 × 272)/2 = 32,805. For both these cases, I enumerate every possible case. For G1 ≥ 3, I pick 100,000 cases at random for the methods that do not involve bootstrapping and 25,000 for the wild cluster bootstrap.
Figure 7
Rejection Frequencies for “Canadian” Placebo Law Tests

Figure 7 shows rejection frequencies for four different tests at the .05 level of the coefficient on the placebo-law dummy variable. When we ignore intra-cluster correlation and simply use heteroskedasticity-robust standard errors, rejection frequencies are extremely high, always exceeding 84%. Clustering at the state-year level reduces these only modestly, to between 68% and 81%.
Clustering at the state level reduces the rejection frequencies dramatically, except when G1 is small. For G1 ≥ 4, the rejection frequencies are always between 12.1% and 13.3%. Of course, these would have been substantially higher if I had used asymptotic critical values instead of ones based on the t(9) distribution. As before, the wild cluster bootstrap performs best. Except for G1 = 1, where it never rejects, it performs quite well. For 3 ≤ G1 ≤ 10, it always rejects between 5.6% and 7.7% of the time.
Even though genuine Canadian data would undoubtedly yield different results, this exercise is interesting. It suggests that the wild cluster bootstrap is not too unreliable when the number of clusters is as small as 10, provided the number of treated clusters is not extremely small. In contrast, methods that do not involve clustering at the jurisdiction level are likely to be highly unreliable, and cluster-robust t statistics are not reliable even when clustering at that level.
6. Why Are the Residuals Clustered?
There are at least two explanations for the state-level intra-cluster correlations that apparently exist in the residuals for regression (1). The first is that these correlations arise because of model misspecification, and the second is that they arise from the way in which the data are gathered. In this section, I briefly discuss these two explanations.
Although equation (1) with the addition of state fixed effects is a very standard one, it could be misspecified in many ways. Perhaps there should be a larger set of education dummy variables, or perhaps the effect of age on earnings should be more complicated than the quadratic specification in the model.
The assumption that there are state and year fixed effects is particularly strong. It implies that the impact of time on earnings is the same for every state and that the impact of location on earnings is constant across time. A more general specification would include 51 × 37 – 1 = 1886 state-year dummy variables instead of the state and year fixed effects. However, such a model would be useless for evaluating policies that vary across states and years but not across individuals, because the state-year dummies would explain all the variation in every possible treatment variable. A less general but more useful model would be one that incorporated state-level time trends as well as state-level fixed effects. It might be of interest to investigate such a model.
It seems plausible that misspecification will cause residuals to be correlated within states, with weak or nonexistent correlations for observations that are several years apart and stronger ones for observations belonging to the same year or nearby years. This would explain why clustering at the state-year level works badly but clustering at the state level works fairly well.
The second explanation for state-level intra-cluster correlation of the residuals is that the Current Population Survey is a complex survey. It uses specialized sampling techniques such as clustering, stratification, multiple stages of selection, and unequal probabilities of selection. This complexity is necessary in order to achieve a reasonable balance between the cost and statistical accuracy of the survey.
Unfortunately, the complex design of the C.P.S. also ensures that the observations are not entirely independent within states. For reasons of cost and feasibility, the basic unit of sample selection is the census tract, not the household. Once a tract has been selected, it typically contributes a number of households to the surveys that are done over several adjacent years. Any sort of dependence within census tracts will then lead to residuals that are correlated within states both within and across years.
It is sometimes possible to take account of the features of the design of a particular survey. See, among others, Fuller (1975), Binder (1983), and Rao and Wu (1988). Kolenikov (2010) provides an accessible introduction to this literature along with Stata code for bootstrap inference when the survey design is known. When the survey design is very complex, however, it would be extremely difficult to implement this sort of procedure. When the design is unknown to the investigator, it would be impossible. In many cases, the best we can do is to cluster at the appropriate level.
It may well be the case that other large datasets display less intra-cluster correlation than this one, or different patterns of it, perhaps because the survey design is different or the data do not come from a survey. Data from online retailers or other websites probably have different characteristics than data from the Current Population Survey. However, it seems unlikely that any large dataset will have observations that are entirely independent. Even very low levels of intra-cluster correlation can have a substantial effect on inference when the sample size is very large. Therefore, in the absence of evidence to the contrary, I conjecture that the results of this paper are potentially relevant for most large datasets in econometrics.
Conclusion
This paper has investigated a particular dataset, with more than one million observations, taken from the Current Population Survey of the United States. With large datasets, even very small correlations of disturbances within clusters can cause severe errors of inference. These correlations may arise from misspecification (such as omitted variables that vary by cluster) or from the survey design. Including fixed effects for time and location does not fully account for them. Not surprisingly, the problems associated with clustering seem to be more severe for Canada, with 10 provinces, than for the United States, with 51 states.
The information content of a sample is not proportional to sample size, but, when we use standard errors that are not clustered, we pretend that it is. For very large samples, the loss of information from clustered disturbances may be very large.
Using standard errors clustered at the right level, together with the critical values from the t(G – 1) distribution, where G is the number of clusters, helps a lot. Using the wild cluster bootstrap helps even more, provided the number of treated clusters is not too small; see MacKinnon and Webb (2017). It is particularly important to use appropriately clustered standard errors when the sample size is large, because the severity of erroneous inference tends to increase with the sample size.
There are special problems associated with regressions that focus on the effects of economic policies that vary across jurisdictions and possibly time periods. When the number of treated clusters is small, cluster-robust t statistics and bootstrap tests based on unrestricted estimates tend to overreject severely, and bootstrap tests based on restricted estimates tend to underreject severely.
Parties annexes
Acknowledgements
This research was supported, in part, by a grant from the Social Sciences and Humanities Research Council of Canada. Much of the computation was performed at the Centre for Advanced Computing of Queen’s University. The paper was first presented under the title Données massives et regroupements as the Conférence François-Albert-Angers at the 56th conference of the Société canadienne de science économique on May 12, 2016. It was also presented at the University of Missouri and at Aarhus University. The author is grateful to seminar participants and to Stas Kolenikov, Matt Webb, and Russell Davidson for comments.
Notes
-
[1]
Simply storing the diagonal block of MX that corresponds to California would require about 57 GB of memory. Inverting it, or finding its inverse symmetric square root, would require additional memory and an enormous amount of CPU time. This would have to be done for all 51 states.
-
[2]
The result would be different if the Cov(yi, yj) terms had mean zero, of course, but there is no reason to expect that to be the case. On the contrary, we expect the mean to be positive.
-
[3]
This is true for two reasons. First, the disturbances may still be correlated across clusters, although the bootstrap results in Section 4 suggest that this is not a serious problem. Second, when cluster sizes differ a lot, as they do in this case, CV1 standard errors tend to be unreliable; see MacKinnon and Webb (2017).
-
[4]
The curve for M = N/20 is a bit below the others for larger values of G1, but this probably just reflects sampling variability.
Bibliography
- Andrews, D. W. K. (2005). “Cross-section Regression with Common Shocks.” Econometrica, 73(5): 1551-1585.
- Angrist, J. D., and J.-S. Pischke (2008). Mostly Harmless Econometrics: An Empiricist’s Companion. 1st ed. Princeton University Press.
- Bell, R. M., and D. F. McCaffrey (2002).“Bias reduction in standard errors for linear regression with multi-stage samples.” Survey Methodology, 28(2), 169-181.
- Bertrand, M., E. Duflo, and S. Mullainathan (2004). “How much Should we Trust Differences-in-differences Estimates?” The Quarterly Journal of Economics, 119(1): 249-275.
- Bester, C. A., T. G. Conley, and C. B. Hansen (2011). “Inference with Dependent data using cluster covariance estimators.” Journal of Econometrics, 165(2): 137-151.
- Binder, D. A. (1983). “On the variances of asymptotically normal estimators from complex surveys.” International Statistical Review, 51(3): 279-292.
- Cameron, A. C., J. B. Gelbach, and D. L. Miller (2008). “Bootstrap-based improvements for inference with clustered errors.” The Review of Economics and Statistics, 90(3): 414-427.
- Card, D., and A. B. Krueger (1994). “Minimum wages and employment: A case study of the fast food industry in New Jersey and Pennsylvania.” American Economic Review, 84(4): 772-793.
- Conley, T. G., and C. R. Taber (2011). “Inference with ‘Difference in Differences’ with a small number of policy changes.” The Review of Economics and Statistics, 93(1): 113-125.
- Donald, S. G, and K. Lang (2007). “Inference with difference-in-differences and other panel data.” The Review of Economics and Statistics, 89(2): 221-233.
- Fuller, W. A. (1975). “Regression analysis for sample Survey.” Sankhya, 37: 117-132
- Imbens, G. W., and M. Kolesár (2016). “Robust standard errors in small samples: Some practical advice.” Review of Economics and Statistics, 98(4): 701-712.
- Kloek, T. (1981). “OLS estimation in a model where a microvariable is explained by aggregates and contemporaneous disturbances are equicorrelated.” Econometrica, 49(1): 205-207.
- Kolenikov, S. (2010).“Resampling variance estimation for complex survey data.” The Stata Journal, 10: 165-199.
- Liang, K.-Y., and S. L. Zeger (1986). “Longitudinal data analysis using generalized linear models.” Biometrika, 73(1): 13-22.
- MacKinnon, J. G. (2015). “Wild Cluster Bootstrap Confidence Intervals.” L’Actualité économique, 91(1-2): 11-33.
- MacKinnon, J. G., and H. White (1985). “Some heteroskedasticity Consistent covariance matrix estimators with improved finite sample properties.” Journal of Econometrics, 29(3): 305-325.
- MacKinnon, J. G., and M. D. Webb (2016a).“Randomization inference for difference-in-differences with few treated clusters.” Working Paper No. 1355, Queen’s University, Department of Economics.
- MacKinnon, J. G., and M. D. Webb (2016b).“The subcluster wild bootstrap for few (treated) clusters.” Working Paper No. 1364, Queen’s University, Department of Economics.
- MacKinnon, J. G., and M. D. Webb (2017). “Wild bootstrap inference for wildly different cluster sizes.” Journal of Applied Econometrics, 32(2): 233-254.
- Moulton, B. R. (1986). “Random group effects and the precision of regression estimates.” Journal of Econometrics, 32(3): 385-397.
- Moulton, B. R. (1990). “An illustration of a pitfall in estimating the effects of aggregate variables on micro Units.” Review of Economics and Statistics, 72(2): 334.
- Rao, J. N. K., and C. F. J. Wu (1988). “Resampling inference with complex survey data. ” Journal of the American Statistical Association, 83(401): 231-241.
- Webb, M. D. (2014). “Reworking wild bootstrap based inference for clustered errors.” Working Paper No.1315, Queen’s University, Department of Economics.
 10.7202/1036912ar
Liste des figures
Figure 1
Inverse of s() as a Function of M
Figure 2
Rejection Frequencies for Placebo Law Tests, N = 1,156,597
Figure 3
Rejection Frequencies for Placebo Law Tests, HC1
Figure 4
Rejection Frequencies for Placebo Law Tests, CV1(S, Y)
Figure 5
Rejection Frequencies for Placebo Law Tests, CV1(S)
Figure 6
Rejection Frequencies for Bootstrap Placebo Law Tests
Figure 7
Rejection Frequencies for “Canadian” Placebo Law Tests
Liste des tableaux
Table 1
Value of a Postgraduate Degree
Note: HC1 does not cluster at all. CV1(S,Y) uses 1887 clusters at the state-year level, and CV1(S) uses 51 clusters at the state level.