
Résumés
Abstract
This article is about the Chukotkan component of the international project “Survey of Living Conditions in the Arctic” (SLiCA). The research investigated various aspects of the lives of Aboriginal peoples in Chukotka and compared them with data from Aboriginal peoples of different countries. One of the advantages of the SLiCA project was that researchers worked with Aboriginal people as partners to design and implement the study. In this paper, statistical data obtained previous to SliCA and those collected during the SLiCA project are presented.
Résumé
Cet article concerne la composante «Tchoukotka» du projet international «Survey of Living Conditions in the Arctic» (SLiCA). Cette recherche a investigué des aspects variés de la vie des peuples autochtones de la Tchoukotka et les a comparés avec des données provenant de peuples autochtones de différents pays. Un des avantages du projet SLiCA était que les chercheurs travaillèrent avec les peuples autochtones en tant que partenaires afin de préparer et conduire l’étude. Dans ce texte, des données statistiques recueillies avant SLiCA et pendant ce projet sont présentées.
Corps de l’article
Introduction
Aboriginal peoples of the world have unique cultures and high adaptabilities to extreme environments. Yet, many Aboriginal peoples are helpless and not protected from a technocratic society which promotes “progress” among them, but also undermines their steady development. Naturally, Aboriginal peoples from different countries tried to protect themselves and their rights in a changing world. However, not all Aboriginal peoples have found worthy answers to their present problems. There are many reasons for developmental differences among Aboriginal peoples and nations. These include the types and degrees of crises among their societies; the level of aboriginal participation in the solutions to their problems; their political awareness; and the competence of their government. The development of Aboriginal peoples and their mutual relations with the states grew unequally, and there were many mistakes in the decisions made to address Aboriginal issues in all countries.
The United Nations proclaimed 1993 the International Year of Aboriginal Peoples of the World, and 1994-2004, the International Decade of Aboriginal Peoples of the World. The first decade of aboriginal focus had less than favorable results which convinced the U.N. of the necessity to have a second International decade (2005-2015). The United Nations called the states to continue studying and working toward improvement of the situation of Aboriginal peoples. Therefore, the comparison of objective information about the situation of Aboriginal peoples in the world is very important for understanding the essence and reasons for problems, as well as the general tendencies and differing ways of addressing problems. One of these studies was an international project called “Survey of Living Conditions in the Arctic” (SLiCA).
SLiCA began in Greenland and expanded to include northern Canada, the United States (northern Alaska), Norway, Sweden, Finland, as well as the Chukotka and Kola Peninsula regions of Russia. Special interest in Chukotka was raised by the historic association of Chukotka and Alaska as part of the Bering region. Chukotka and Alaska were a migratory crossroads for people and cultures from different regions. One of the advantages of the SLiCA project was that researchers worked with Aboriginal people, as partners, to design and implement the study. This article presents and discusses some of the results from the SliCA project in Chukotka.
Background of the project
The Arctic Council supports various research projects such as the interaction of northern communities with the environment; transformations of a traditional way of life; and processes of acculturation and urbanization. The importance of such research is clear: understanding the well-being and health of Arctic societies is critical to our understanding of the Arctic as a whole. Individual people suffer when the balance of their relationship with the natural and social environment is broken. When referring to Aboriginal peoples of the Arctic regions, it is a given that traditional knowledge and activities are necessary for their well-being today.
The Bureau of Statistics in Greenland (SG) carried out research of living conditions in Greenland in 1994. That research focused on information received from the Aboriginal people themselves. After analysis of their results, the researchers drew the conclusion that they should design a comparative project in the different Arctic regions, with the cooperation of Aboriginal peoples, and designed to measure living conditions relevant to the Arctic peoples. These circumstances gave rise to the project “Survey of Living Conditions in the Arctic: Inuit, Sami, and Indigenous Peoples of Chukotka” (SLiCA). SLiCA was designated a project of the Sustainable Development Working Group (SDWG) of the Arctic Council and has been included in the list of the International Polar Year (2007) projects. The main idea of the SLiCA project was to do a one-time survey of Aboriginal people in the Arctic to better understand their living conditions. It has been an opportunity to learn more about traditional ways of life, spiritual cultures, use of the wildlife and other basics of balanced development of northern communities. The project approach differed slightly by country based on funding, population, and schedule.
In Russia, the project concerns the Murmansk region and the Chukotka autonomous region. This choice was not random: Sami people live on the Kola Peninsula as well as in the neighbouring Scandinavian states; and in Chukotka there are Yupiget. Sami and Yupiget are the Aboriginal peoples who live in the regions involved in the SLiCA project. The author was the coordinator of the SLiCA project in Chukotka, and with her research team she determined the households (families) which were to be studied by interviewing one randomly selected individual per family. It was planned to interview about 500 households in both the Murmansk region and in Chukotka. One of the main characteristics of scientific research in the Arctic is the participation of scientists with organizations of Aboriginal peoples, including the Association of Indigenous Peoples of the North, Siberia and the Far East of the Russian Federation (RAIPON), and representatives from aboriginal communities.
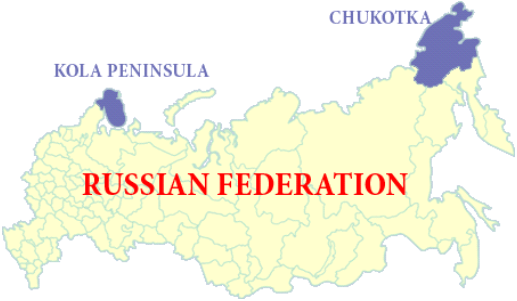
Figure 1
The SLiCA project in Russia.
Previous statistics on Aboriginal peoples of Chukotka
There were some revolutionary turns in the destiny of the Aboriginal peoples of Chukotka which were foreign to their original cultural and historical development. Each such turn subjected the Aboriginal peoples to influences and circumstances which were beyond their capacity to adapt. Even well-intended compulsory measures imposed by the governmental authorities spread too quickly all over Chukotka, leading to dis-adaptation. The Aboriginal peoples of Chukotka did not have an easy life. “Almost all of them have experience of compulsory resettlements, closing of aboriginal settlements, transformations in their way of life, and early death of relatives. Despite ordeals, Aboriginal peoples kept optimism, humor, dignity, wisdom and knowledge of traditions” (Krupnik 2000: 13). In fact, they have accepted the political regimes imposed on them, and contributed to the well-being of Russia.
The introduction of the market system on socialist ground seems to have been the most painful. After the collapse of socialism, the market system was totally alien to Aboriginal peoples of Chukotka. Even more, this radical change was introduced abruptly and lacked scientific argumentation, financing and management. It brought an end to the traditional and original ways of life of the Aboriginal peoples. Other factors also contributed such as the short life expectancy of Aboriginal peoples, especially in the sphere of traditional activity. Today there are few elders (50-60 years old) who can transmit the experiences of their youth. Much traditional knowledge that was widespread 20 years ago has almost disappeared. Another factor is the frequent rotation of non-aboriginal managers, many of whom did not have time to understand ethnic problems, nor have the experience of the previous managers. As a result, information was intermittent and practical actions were inconsistent. Overcoming what is still perceived as the “archaic” components of the aboriginal culture is the single and invariable course of non-aboriginal managers.
It seems that the most realistic prospect for the Aboriginal peoples is the final loss of their ethnocultural features and their total transformation into Russian people. For an objective estimation of the condition of the Aboriginal peoples of Chukotka, one needs to consider some statistical data. First, and due to massive immigration from other Russian regions, the share of Aboriginal peoples in the total population of Chukotka greatly decreased from 75% in 1939 to 10% in 1989, increasing again as a result of massive outmigration of non-Aboriginal Russians to 31% by 2002 (Table 1). The total population of Chukotka was 53,842 in 2002, and Aboriginal peoples made less than one third of the total population (Goskomstat Rossii 2004). In 2002, the remaining non-Aboriginal population of Chukotka was highly concentrated in urban areas (Table 2).
From 1985 to 2000, there was a reduction in jobs related to reindeer breeding, fur crafts, fishing, and fur farming (Table 3). Only the employment related to sea mammal hunting increased (Table 3). The representation of Aboriginal peoples in farm enterprises also decreased between those years from 21.5% in 1985 to 12.2% in 2000 (Anonymous 2001: 5). Although the total population of reindeer had started to decrease in the late 1970s, it dropped drastically in the early 1990s (Table 4).
From 1985 to 2000, the income of reindeer herders decreased (Table 5) and in 2000, delay in getting wages paid was on the average 17.5 months (Anonymous 2001: 15). The same year, the purchasing capacity for food stuffs has decreased 12.3 times since 1985, and 13.2 times if cheap fish and sea mammals products are not taken into account (ibid.).
Table 1
Ethnic populations of the Chukotka according to 1939, 1989 and 2002 census.
|
1939 |
1989 |
2002 |
2002 men |
2002 women |
|||
|---|---|---|---|---|---|---|---|---|
|
|
% |
|
% |
|
% |
|
|
Chukchi |
12,196 |
58,7 |
11,914 |
7.2 |
12,622 |
23.5 |
5,940 |
6,682 |
Yupiget |
1,502 |
7,2 |
1,452 |
0.9 |
1,534 |
2.9 |
733 |
801 |
Evens |
965 |
4,6 |
1,336 |
0.8 |
1,407 |
2.6 |
670 |
737 |
Chuvants |
649 |
3,1 |
944 |
0.6 |
951 |
1.8 |
425 |
526 |
Koryaks |
353 |
1,7 |
95 |
0.1 |
55 |
0.1 |
28 |
27 |
Kereks |
|
|
|
|
8 |
0.0 |
2 |
6 |
Aboriginal peoples |
15,665 |
75,4 |
15,741 |
9.6 |
16,577 |
30.8 |
7,798 |
8,779 |
All population |
20,787 |
100 |
164,783 |
100 |
53,824 |
100 |
28,302 |
25,522 |
Note: The Yukagirs are not presented in the census.
Table 2
Urban versus rural Aboriginal and non-aboriginal populations of Chukotka in 2002.
|
All population |
Chukchi |
Yupiget |
Evens |
Chuvans |
Koryaks |
|---|---|---|---|---|---|---|
Urban |
35,869 |
2,264 |
394 |
313 |
259 |
24 |
|
67% |
18% |
26% |
22% |
27% |
44% |
Rural |
17,955 |
10,358 |
1,140 |
1,094 |
692 |
31 |
|
33% |
82% |
74% |
78% |
73% |
56% |
Table 3
Reduction and increase of employment between 1985 on 2000.
Reindeer breeding |
Fur crafts |
Fishing |
Fur farming |
Sea mammal hunting |
|---|---|---|---|---|
|
Reduced 2.4 times |
Reduced 7.9 times |
Reduced 3.3 times |
Reduced 3.4 times |
Increased 1.4 times |
Table 4
Reindeer livestock and reindeer meat processed in Chukotka, mid-1920s to 2002.
|
mid-1920s |
1978 |
1989 |
2001 |
2002 |
|---|---|---|---|---|---|
Number of reindeer livestock |
about 700,000 |
535,105 |
475,149 |
99,440 |
94,695 |
Kg of reindeer meat at processing centers |
- |
87,950 |
96,028 |
7,294 |
5,114 |
Table 5
Reduction of incomes of reindeer herders from 1985 to 2000.
Continental Chukotka (Kanchalan) |
7.5 times |
Coastal Chukotka (Lorino) |
29.4 times |
Consumption of meat and meat products has decreased by 1.2 times in settlements of the Chukchi Peninsula (37% of the population) and more than 3 times in other areas of Chukotka (63% of the population) (Anonymous 2001: 30). The diet of Aboriginal peoples of Chukotka was greatly affected as the intake of reindeer meat decreased from a daily average of 336.8 gr in 1985 to 43.7 gr in 2000 (Anonymous 2001: 7). However, data for 1988 demonstrate that the average intake of protein and carbohydrates at that time was much higher than the recommended norm (Pika 1999: 156-160) (Table 6). In 2000, 95% of Aboriginal families were deprived of milk and dairy products, fresh and canned vegetables, fruits, eggs and other imported food stuffs. Caloric content of consumed food had decreased 1.2 times mainly due to lower consumption of fats and, to a lesser degree, carbohydrates (Anonymous 2001: 30).
Table 6
Diet structure of Aboriginal peoples of Chukotka in 1988 (in percent).
|
protein |
fat |
carbohydrates |
|---|---|---|---|
Recommended norm |
16% |
39% |
45% |
Consumption in 1988 |
22.5% |
17.1% |
60.4% |
There is a general opinion that extinction does not threaten Aboriginal peoples of Chukotka as their birth rate strongly surpasses their death rate. Officials also point to the decrease of infant mortality as evidence of a positive tendency. Such conclusions are premature since they are based on data concerning only a small subset of the population for only a short time. Besides, this cleanly arithmetic approach does not consider the state of health of the newborns, the condition of families, and other social and psychological characteristics of the Aboriginal population. Hence, today 80% of Aboriginal children are born outside of marriage; 18% of women in childbirth are juvenile girls; For every 1000 childbirths, there are 596 cases of anemia. Healthy children constitute just 2% of the total population of children, unlike 10 years ago when healthy children constituted 25% (Anonymous 2003: 8). Furthermore, the infant mortality rate is not calculated using international standards. If the infant mortality rate were calculated using international criteria, it would be higher (Anonymous 2006). The “improvement” in the health of Aboriginal people is likely not caused by the successes of public health services and social measures, but rather by the fast regeneration of the Aboriginal people. Indeed, the data on suicides of Aboriginal people and mental health problems from 2002-2004 are appalling as shown in Tables 7 to 9.
Table 7
Number of suicide cases in Chukotka per 100,000 population.
|
1992 |
1993 |
1994 |
1995 |
1996 |
1997 |
1998 |
1999 |
2000 |
2001 |
2002 |
2003 |
2004 |
|---|---|---|---|---|---|---|---|---|---|---|---|---|---|
All pop. |
20.6 |
30.9 |
45.0 |
56.7 |
57.2 |
42.2 |
67.2 |
30.9 |
52.5 |
61.6 |
54.0 |
66.0 |
92.4 |
Abor. pop. |
43.4 |
68.0 |
71.8 |
144.5 |
80.4 |
51.4 |
165.7 |
56.8 |
67.4 |
146.1 |
98.5 |
65.7 |
120.4 |
Table 8
The major districts with higher rates of suicides in 2004.
Chukchi district |
Beringovskii district |
Shmidt district |
Provideniya district |
|---|---|---|---|
260.9 * |
233.3 |
160.0 |
152.2 |
Including three cases of suicides among children.
Table 9
Primary mental deficiency per 100,000 population.
Chukotka in 2004 |
The population of Russia (on average) in 2003 |
|---|---|
252.8 |
19.9 |
SLiCA in Chukotka
Prior to the beginning of the Chukotka component of SLiCA, the international SLiCA group developed the basic model of a questionnaire which allowed researchers to make comparative analyses of life conditions in the different countries of the Arctic zone. The preparatory stage of the Chukotka part of the project comprised:
Studying the opportunities for carrying out the research.
Discussions of the project with aboriginal inhabitants.
Drawing up of a Chukotkan variant of the questionnaire, working up the methodology for sampling, and selection of respondents.
Realisation of a pilot research with completion of the questionnaire.
Coordination with the administration of Chukotka.
Researchers visited various areas of Chukotka where they held meetings with the population and explained the essence of the project. During these meetings, people gave advice to improve and expand the questionnaire, and their full approval for the project. Authorities and municipalities were informed of the project and its coordination with the Aboriginal population.
The Chukotka variant of the questionnaire was developed in parallel with the international one, and in many respects is identical to it. After carrying out the pilot research, the questionnaire was modified and edited. The questionnaire consists of eight basic general thematic sections and one additional section which concerns Chukotka specifically (Table 7). In addition, two self-administered sections are part of the questionnaire; one for sensitive questions asked of all respondents and another specifically for female respondents. In total, the questionnaire contains about 280 questions in 70 pages.
Table 7
The thematic sections of the questionnaire used for SLiCA in Chukotka.
Part A: Your Family |
Part B: Your Background |
Pаrt C: Your Work and Traditional Activities |
Part D: Health |
Part E: Housing and Standard of Living |
Part F: Activities |
Part G: Aboriginal Values, Religion, and Spirituality |
Part H: Community and Environment |
Part I: Chukotka Specific Questions |
The definition of ethnic identity, at least from the formal point of view, is simple. Until recently in Russia, at the birth of a child, authorities issued a certificate which included the ethnicity of the parents. Until 2000, all citizens of Russia received passports at the age of 16 years in which their ethnicity was specified. Now passports are issued at the age of 14 years, but the ethnicity is registered only at the will of the citizen. The passport also registers a permanent residence address of the individual.
In villages of Chukotka, “Household books” are kept which contain data on all the families (households) of the village and the tundra, including reindeer herders, hunters, and fishermen. Thus, all persons are accounted for in the system of registration and accounting. Until recently these books also contained data about ethnicity (now registered only at will), age, employment of each member of household, and other information (e.g., about dogs and other animals, etc.). Because of this system of registration, defining aboriginal inhabitants does not represent any methodological or technical complexity. When the ethnicity, for any number of reasons, was not specified, the rural assistant could correctly establish it as this individual knew all the inhabitants of the village. It was more difficult to define Aboriginal families in the large city of Anadyr. In this case, lists of the aboriginal population drawn from applications for free fishing licenses were used.
The study faced difficulties such as the wide geographic dispersion of the Aboriginal population; the absence of regular transportation; a deficient telephone system; and, especially, poor Internet communication. These factors caused complexity and high costs of trips throughout Chukotka. Interviews were conducted even with families who constantly live in the tundra. They were reached by interviewers who travelled on cross-country vehicles. This process provided a statistically representative sample of the various ethnic and social groups of Chukotka, and allowed collection of reliable information about living conditions that can be generalized to the entire Aboriginal population being sampled.
The first practical step taken when planning the sample was to identify all settlements of Chukotka where the Aboriginal population resides. The second step was choosing 25 settlements for the survey. Selection of settlements was made so that the probability of selection was proportional to the size of the Aboriginal population in each settlement. The settlements were stratified so that the sample of settlements represent the different structures of traditional employment of the Aboriginal population including: reindeer breeders, sea mammal hunters, fishermen, and hunters as well as Aboriginal people living in the cities of Anadyr, Bilibino, and Pevek.
In each district a project leader and interviewers were chosen. Interviewers who were hired from among aboriginal people were trained in administering and filling out the questionnaires according to the rules of the international project. The majority of interviewers were chosen at the recommendation of public organisations of aboriginal people and were inhabitants of surveyed settlements. The use of local interviewers induced people to participate in the project. The selected interviewers gathered in Anadyr and were trained in the methods of the work. Then, in settlements, respondents were chosen by a random sampling technique. Interviews started only after the consent of the respondent.
Unexpectedly, officials from the administration of Chukotka stopped the project before the beginning of the first interviews. The Department of Justice had made the verdict that the questionnaire contradicted the legislation of Russia, humiliated and took advantage of the aboriginal population, interfered with the private life of respondents, etc. This expert conclusion was delivered to the municipalities of Chukotka. Two of nine municipalities wrote to RAIPON about the inadmissibility of the survey in their territory. RAIPON then asked for consultations and support from the Government, the scientific and legal organizations of Russia, and the Aboriginal peoples. Positive conclusions and support were received. The situation at last was overcome after the Ministry for Foreign Affairs of Russia wrote a letter to the Governor of Chukotka asking for assistance on the SLiCA project as it was supported by the Arctic Council. Although now work could be continued, most precious time was wasted in those procedures. What was the main motive of the negative verdict by the heads of Chukotka: protection of the rights of the aboriginal population or fear of negative information from the population? It is only possible to speculate an answer. Nevertheless, by the end of 2005 the survey was completed and many results can now be partially presented.
Demographic data from the SLiCA survey
The following tables and diagrams provide a portrait of Aboriginal peoples of Chukotka in 2005, if only superficially. In addition to answering questions, respondents provided informal comments and private opinions, which interviewers wrote down on the margins of the questionnaires. The Aboriginal peoples included were the Chukchi, the Yupiget, the Evens, the Chuvans, and the Yukagirs, Koryaks, and other Aboriginal peoples (Table 8). The sex ratio of the SLiCA survey sample was 69% female and 31% male. The sample is thus inadvertently skewed in favor of female respondents. Data were weighted to achieve a more accurate sex ratio for the analysis. The age groups are presented in Table 9 and show that the majority of Aboriginal adult population in 2005 was between 35 and 54 years old. Table 10 presents data on the ability to use Native language, and Table 11 the highest level of education completed. As for elementary school, 55% thought of it as unstressful and 46% as stressful. Regarding religion, 71% considered aboriginal spiritual beliefs as part of life, while 29% did not.
Table 8
Demographic data on Chukotka Aboriginal peoples sampled by SLiCA.
|
Total |
Among it: |
||||
|---|---|---|---|---|---|---|
Chukchi |
Yupiget |
Evens |
Chuvans |
Yukagirs, Koryaks, and other Aboriginal peoples |
||
Aboriginal population of Chukotka |
about 17,000 (100%) |
74% |
9% |
8% |
6% |
3% |
Aboriginal population sampled |
550 (100%) |
59% |
27% |
2% |
5% |
7% |
Table 9
Age distribution of Aboriginal adults in the Chukotka sample.
Age distribution | |
|---|---|
|
Percentage |
16-24 |
14% |
25-34 |
19% |
35-44 |
30% |
45-54 |
23% |
55-64 |
9% |
65 and over |
4% |
Total |
100% |
Table 10
Ability to use Native language.
|
Very well |
Relatively well |
Not at all or with effort |
|---|---|---|---|
Ability to understand Native language |
40% |
18% |
42% |
Ability to speak Native language |
37% |
17% |
45% |
Ability to read Native language |
25% |
17% |
58% |
Ability to write Native language |
24% |
15% |
61% |
Table 11
Highest level of school completed.
Elementary or less |
26% |
High school |
32% |
Vocational school or college |
42% |
|
100% |
Table 12 presents results about the degree of satisfaction with community features. Here are some comments about them made by the respondents:
There are problems in reindeer breeding: poor salaries, lack of products in the tundra bases; boots are worn, products are delayed. The prices that reindeer breeders have to pay are often higher than their salaries therefore they often owe money to the collective farms. It’s dangerous to work there.
Products in shops are old. The information on work of public organisations is absent. The Aboriginal Peoples working in authorities are under their influence.
Table 13 presents results about the degree of satisfaction with jobs and job opportunities. Below are a few comments about these issues:
I am a tusk carver, but I am not registered anywhere and I do not pay taxes. I am afraid that I will be punished. I need some help to start up a small business. I wish to sell the products to earn money for my children’s education. I do not want them to study in a boarding school.
It is necessary that the youth do not drink. In the settlements there is no work and they probably drink from idleness. The fur farm has been closed and there is no reindeer breeding. Before, all worked and now all young live as pensioners.
The youth does not have knowledge and skills of a traditional life anymore. They aspire to a comfortable city life.
Table 12
Satisfaction with community features in Chukotka.
Recreation facilities |
Very satisfied |
5% |
Somewhat satisfied |
18% |
|
Not satisfied or neither |
77% |
|
|
100% |
|
Cost of living |
Very satisfied |
2% |
Somewhat satisfied |
7% |
|
Not satisfied or neither |
91% |
|
|
100% |
|
Availability of goods in local stores |
Very satisfied |
2% |
Somewhat satisfied |
21% |
|
Not satisfied or neither |
77% |
|
|
100% |
|
Transportation to and from community |
Very satisfied |
1% |
Somewhat satisfied |
17% |
|
Not satisfied or neither |
82% |
|
|
100% |
|
Estimated total |
|
17,081 |
Table 13
Satisfaction with job or job opportunities in Chukotka.
Job |
Very satisfied |
21% |
Somewhat satisfied |
53% |
|
Not satisfied or neither |
26% |
|
|
100% |
|
Job opportunities |
Very satisfied |
1% |
Somewhat satisfied |
9% |
|
Not satisfied or neither |
90% |
|
|
100% |
|
Estimated total |
|
19,508 |
Comments by respondents
Most of the comments were made in “Part H: Community and Environment” concerning questions on work of police and law enforcement. An overwhelming majority of respondents made negative responses: many people believe that the police do not always come to the aid of people in need, but instead are rough with the Aboriginal population, exceeds their powers and do not prosecute illegal dealers of alcohol. Many respondents consider that the non-aboriginal (Russian) population scorns Aboriginal people, as is shown in unfair granting of housing and jobs, in ethnic prejudice, as well as at a personal level. In the opinion of the respondents, the most widespread crimes among Aboriginal people are larceny, hooliganism, fights, and stabbings. It is paradoxical that respondents relate to suicide as a crime which is widespread among Aboriginal people. In contrast, the crimes most typical for the non-aboriginal population are recognized as murders, rapes, larceny, moon-shining and illegal sale of spirits, and swindling.
Many Aboriginal persons used the questionnaire as a chance to address their problems to authorities with requests for help. In the private opinions on the margins of questionnaires, respondents wished to send a signal about the problems they saw. In most cases the complaints were about various difficulties of life, but not pretensions about infringement of their rights. Considering their difficult life, many respondents adopt a traditional readiness to suffer hardship and hope for a bright future. The government of Chukotka remained practically beyond criticism. Moreover, some Aboriginal respondents estimated the management of Chukotka to be no worse than the previous administrations. Respondents consider the governorship of Roman Abramovich especially warmly.
Discussion and conclusion
A comparison of data from Chukotka with that of other Arctic countries reveals both regional and national differences and commonalities. The data invite questions about international problems and tendencies as well as thoughts on the reasons for problems and ways of overcoming them. As we cannot consider all sections of the questionnaire, we shall consider only some questions on health. As can be seen in Table 14, the health conditions are not as good in Chukotka as in other Arctic regions. One of the main reasons is the drastic alteration of all life conditions: loss of traditional economy, decrease in incomes, and reduction of traditional food. It has turned out that the Aboriginal peoples of Chukotka have a hard time in making ends meet (Table 15) and consume less traditional food than Aboriginal people from other Arctic countries (Table 16). The type of dwelling also has influence on health, and contrary to other Arctic countries, the Aboriginal peoples of Chukotka live mainly in apartments (Table 17).
Table 14
Diagnosed health condition of Arctic Aboriginal peoples by country.
|
Canada |
Greenland |
Chukotka |
Alaska |
Total |
|---|---|---|---|---|---|
Arthritis or rheumatism |
8% |
15% |
33% |
18% |
18% |
Stomach problems or intestinal ulcers |
4% |
13% |
33% |
15% |
17% |
High blood pressure |
8% |
14% |
30% |
26% |
17% |
Heart problems |
5% |
7% |
29% |
11% |
11% |
Chronic bronchitis |
2% |
5% |
23% |
5% |
7% |
Hepatitis |
1% |
2% |
23% |
5% |
7% |
Tuberculosis |
4% |
5% |
9% |
8% |
5% |
Asthma |
4% |
6% |
6% |
7% |
5% |
Other kidney diseases |
1% |
3% |
14% |
2% |
5% |
Emphysema or shortness of breath |
3% |
5% |
3% |
4% |
4% |
Diabetes |
2% |
2% |
3% |
5% |
3% |
Effects of a stroke |
1% |
2% |
1% |
2% |
2% |
Cancer |
1% |
2% |
1% |
2% |
2% |
Total |
21,780 |
38,562 |
18,289 |
10,831 |
89,462 |
Table 15
Ease in making ends meet by country.
|
Greenland |
Chukotka |
Alaska |
|---|---|---|---|
Very easily |
21% |
5% |
16% |
Fairly easily |
58% |
17% |
37% |
With some difficulty |
18% |
33% |
42% |
With great difficulty |
3% |
45% |
5% |
Clearly, the life conditions presented here need to be understood in a detailed analysis, and recommendations made. However, the main aim of this article was not to analyse the results of the research but to illustrate the type of data produced by SLiCA. The Aboriginal peoples of Chukotka and RAIPON are naturally concerned about the future. It is expected that scientists will find conclusions and make recommendations for overcoming existing problems. Authorities are also expected to take important steps in the interests of Aboriginal peoples.
Table 16
Percent of traditional food consumed by household by country.
|
Canada |
Greenland |
Chukotka |
Alaska |
|---|---|---|---|---|
None |
1% |
<1% |
9% |
1% |
Less than half |
24% |
33% |
34% |
15% |
About half |
35% |
27% |
29% |
24% |
More than half |
39% |
40% |
28% |
61% |
Table 17
Type of housing by country.
|
Canada |
Greenland |
Chukotka |
Alaska |
|---|---|---|---|---|
Single family |
73% |
44% |
11% |
91% |
Duplex, row house |
22% |
17% |
14% |
2% |
Multiple family |
4% |
32% |
66% |
5% |
Other |
1% |
6% |
9% |
2% |
Number of rooms by country | ||||
Less than 4 |
7% |
13% |
22% |
12% |
4 |
18% |
20% |
50% |
21% |
5 |
32% |
36% |
26% |
40% |
More than 5 |
42% |
31% |
2% |
27% |
Parties annexes
References
- STATE ARCHIVES OF THE CHUKOTKA AUTONOMOUS REGION (SACAR), 1940 GAChAO, Fund No. P-1, file 28, Anadyr, State Archives of the Chukotka Autonomous Region: 255-290.
- ANONYMOUS, n.d. Informatsiia Departamenta promyshlenoi i sel’skokhoziaistvennoi politiki ChAO (Information from the Department of Industrial and Agricultural policies, Chukotka Autonomous Region), unpublished report in possession of the author.
- ANONYMOUS, 1996 Zdorov’e naseleniia ChAO i deyatel’nost’ uchrezhdenii zdravookhraneniia za period 1991-1995 gg, (‘Chukotka Autonomous Region Population Health and activities of the health institutions between 1991 and 1995’), internal report, Anadyr.
- ANONYMOUS, 2001 Obosnovanie potrebnostei korennogo naseleniia Chukotki v produktsii kitoboinogo promysla, (‘Report on Chukotka Indigenous needs in whaling production’), internal report, Anadyr.
- ANONYMOUS, 2003 Aktual’nie voprosy okhrany materinstva i detstva na Chukotke. (‘Current issues in maternity and childhood security in Chukotka’), in Sbornik “Sostoianie zdorov’ia naseleniia Chukotki: problemy i puti resheniia” (‘Chukotka population health: issues and ways for solving them’), Magadan, ChF SVKNII DVO RAN.
- ANONYMOUS, 2005 Zdorov’e naseleniia ChAO i deiatel’nost’ uchrezhdenii zdravookhraneniia za period 1991-2005 gg, (‘Chukotka Autonomous Region Population Health and activities of the health institutions between 1991 and 1995’), Anadyr.
- ANONYMOUS, 2006 Spravka Obshchestvennoi palati RF “Otsenka sostoianiia rossiiskogo zdravookhraneniia” 30.09.06, (‘Note from the Public Chamber of the Russian Federation on “Assessment of the Russian public health services”’), unpublished report in possession of the author.
- GOSKOMSTAT ROSSII, 2004 Osnovnyi itogi Vserosiiskaia perepisi naseleniia 2002, (‘Basic results of the Census of Russia 2002’), Moscow, Goskomstat Rossii.
- KRUPNIK, Igor I., 2000 Pust’ govoriat stariki. Raskazi aziatskikh eskimosov-iupik (‘Let Our Elders Speak. Stories of the Yupik [Asiatic Eskimo] of Chukotka’), Moscow, Naslediya Institute.
- PIKA, Aleksandr (ed.), 1999 Neotraditionalism in the Russian North: Indigenous Peoples and the Legacy of Perestroika, Edmonton, Canadian Circumpolar Institute Press, Circumpolar Research Series, 6.
- POPPEL, Birger, Jack KRUSE, Gérard DUHAIME and Larisa ABRYUTINA, 2007 SLiCA Results, Anchorage, University of Alaska Anchorage, Institute of Social and Economic Research (online at www.arcticlivingconditions.org).
Archival sources
References
Liste des figures
Figure 1
The SLiCA project in Russia.
Liste des tableaux
Table 1
Ethnic populations of the Chukotka according to 1939, 1989 and 2002 census.
|
1939 |
1989 |
2002 |
2002 men |
2002 women |
|||
|---|---|---|---|---|---|---|---|---|
|
|
% |
|
% |
|
% |
|
|
Chukchi |
12,196 |
58,7 |
11,914 |
7.2 |
12,622 |
23.5 |
5,940 |
6,682 |
Yupiget |
1,502 |
7,2 |
1,452 |
0.9 |
1,534 |
2.9 |
733 |
801 |
Evens |
965 |
4,6 |
1,336 |
0.8 |
1,407 |
2.6 |
670 |
737 |
Chuvants |
649 |
3,1 |
944 |
0.6 |
951 |
1.8 |
425 |
526 |
Koryaks |
353 |
1,7 |
95 |
0.1 |
55 |
0.1 |
28 |
27 |
Kereks |
|
|
|
|
8 |
0.0 |
2 |
6 |
Aboriginal peoples |
15,665 |
75,4 |
15,741 |
9.6 |
16,577 |
30.8 |
7,798 |
8,779 |
All population |
20,787 |
100 |
164,783 |
100 |
53,824 |
100 |
28,302 |
25,522 |
Note: The Yukagirs are not presented in the census.
Table 2
Urban versus rural Aboriginal and non-aboriginal populations of Chukotka in 2002.
|
All population |
Chukchi |
Yupiget |
Evens |
Chuvans |
Koryaks |
|---|---|---|---|---|---|---|
Urban |
35,869 |
2,264 |
394 |
313 |
259 |
24 |
|
67% |
18% |
26% |
22% |
27% |
44% |
Rural |
17,955 |
10,358 |
1,140 |
1,094 |
692 |
31 |
|
33% |
82% |
74% |
78% |
73% |
56% |
Table 3
Reduction and increase of employment between 1985 on 2000.
Reindeer breeding |
Fur crafts |
Fishing |
Fur farming |
Sea mammal hunting |
|---|---|---|---|---|
|
Reduced 2.4 times |
Reduced 7.9 times |
Reduced 3.3 times |
Reduced 3.4 times |
Increased 1.4 times |
Table 4
Reindeer livestock and reindeer meat processed in Chukotka, mid-1920s to 2002.
|
mid-1920s |
1978 |
1989 |
2001 |
2002 |
|---|---|---|---|---|---|
Number of reindeer livestock |
about 700,000 |
535,105 |
475,149 |
99,440 |
94,695 |
Kg of reindeer meat at processing centers |
- |
87,950 |
96,028 |
7,294 |
5,114 |
Table 5
Reduction of incomes of reindeer herders from 1985 to 2000.
Continental Chukotka (Kanchalan) |
7.5 times |
Coastal Chukotka (Lorino) |
29.4 times |
Table 6
Diet structure of Aboriginal peoples of Chukotka in 1988 (in percent).
|
protein |
fat |
carbohydrates |
|---|---|---|---|
Recommended norm |
16% |
39% |
45% |
Consumption in 1988 |
22.5% |
17.1% |
60.4% |
Table 7
Number of suicide cases in Chukotka per 100,000 population.
|
1992 |
1993 |
1994 |
1995 |
1996 |
1997 |
1998 |
1999 |
2000 |
2001 |
2002 |
2003 |
2004 |
|---|---|---|---|---|---|---|---|---|---|---|---|---|---|
All pop. |
20.6 |
30.9 |
45.0 |
56.7 |
57.2 |
42.2 |
67.2 |
30.9 |
52.5 |
61.6 |
54.0 |
66.0 |
92.4 |
Abor. pop. |
43.4 |
68.0 |
71.8 |
144.5 |
80.4 |
51.4 |
165.7 |
56.8 |
67.4 |
146.1 |
98.5 |
65.7 |
120.4 |
Table 8
The major districts with higher rates of suicides in 2004.
Chukchi district |
Beringovskii district |
Shmidt district |
Provideniya district |
|---|---|---|---|
260.9 * |
233.3 |
160.0 |
152.2 |
Including three cases of suicides among children.
Table 9
Primary mental deficiency per 100,000 population.
Chukotka in 2004 |
The population of Russia (on average) in 2003 |
|---|---|
252.8 |
19.9 |
Table 7
The thematic sections of the questionnaire used for SLiCA in Chukotka.
Part A: Your Family |
Part B: Your Background |
Pаrt C: Your Work and Traditional Activities |
Part D: Health |
Part E: Housing and Standard of Living |
Part F: Activities |
Part G: Aboriginal Values, Religion, and Spirituality |
Part H: Community and Environment |
Part I: Chukotka Specific Questions |
Table 8
Demographic data on Chukotka Aboriginal peoples sampled by SLiCA.
|
Total |
Among it: |
||||
|---|---|---|---|---|---|---|
Chukchi |
Yupiget |
Evens |
Chuvans |
Yukagirs, Koryaks, and other Aboriginal peoples |
||
Aboriginal population of Chukotka |
about 17,000 (100%) |
74% |
9% |
8% |
6% |
3% |
Aboriginal population sampled |
550 (100%) |
59% |
27% |
2% |
5% |
7% |
Table 9
Age distribution of Aboriginal adults in the Chukotka sample.
Age distribution | |
|---|---|
|
Percentage |
16-24 |
14% |
25-34 |
19% |
35-44 |
30% |
45-54 |
23% |
55-64 |
9% |
65 and over |
4% |
Total |
100% |
Table 10
Ability to use Native language.
|
Very well |
Relatively well |
Not at all or with effort |
|---|---|---|---|
Ability to understand Native language |
40% |
18% |
42% |
Ability to speak Native language |
37% |
17% |
45% |
Ability to read Native language |
25% |
17% |
58% |
Ability to write Native language |
24% |
15% |
61% |
Table 11
Highest level of school completed.
Elementary or less |
26% |
High school |
32% |
Vocational school or college |
42% |
|
100% |
Table 12
Satisfaction with community features in Chukotka.
Recreation facilities |
Very satisfied |
5% |
Somewhat satisfied |
18% |
|
Not satisfied or neither |
77% |
|
|
100% |
|
Cost of living |
Very satisfied |
2% |
Somewhat satisfied |
7% |
|
Not satisfied or neither |
91% |
|
|
100% |
|
Availability of goods in local stores |
Very satisfied |
2% |
Somewhat satisfied |
21% |
|
Not satisfied or neither |
77% |
|
|
100% |
|
Transportation to and from community |
Very satisfied |
1% |
Somewhat satisfied |
17% |
|
Not satisfied or neither |
82% |
|
|
100% |
|
Estimated total |
|
17,081 |
Table 13
Satisfaction with job or job opportunities in Chukotka.
Job |
Very satisfied |
21% |
Somewhat satisfied |
53% |
|
Not satisfied or neither |
26% |
|
|
100% |
|
Job opportunities |
Very satisfied |
1% |
Somewhat satisfied |
9% |
|
Not satisfied or neither |
90% |
|
|
100% |
|
Estimated total |
|
19,508 |
Table 14
Diagnosed health condition of Arctic Aboriginal peoples by country.
|
Canada |
Greenland |
Chukotka |
Alaska |
Total |
|---|---|---|---|---|---|
Arthritis or rheumatism |
8% |
15% |
33% |
18% |
18% |
Stomach problems or intestinal ulcers |
4% |
13% |
33% |
15% |
17% |
High blood pressure |
8% |
14% |
30% |
26% |
17% |
Heart problems |
5% |
7% |
29% |
11% |
11% |
Chronic bronchitis |
2% |
5% |
23% |
5% |
7% |
Hepatitis |
1% |
2% |
23% |
5% |
7% |
Tuberculosis |
4% |
5% |
9% |
8% |
5% |
Asthma |
4% |
6% |
6% |
7% |
5% |
Other kidney diseases |
1% |
3% |
14% |
2% |
5% |
Emphysema or shortness of breath |
3% |
5% |
3% |
4% |
4% |
Diabetes |
2% |
2% |
3% |
5% |
3% |
Effects of a stroke |
1% |
2% |
1% |
2% |
2% |
Cancer |
1% |
2% |
1% |
2% |
2% |
Total |
21,780 |
38,562 |
18,289 |
10,831 |
89,462 |
Table 15
Ease in making ends meet by country.
|
Greenland |
Chukotka |
Alaska |
|---|---|---|---|
Very easily |
21% |
5% |
16% |
Fairly easily |
58% |
17% |
37% |
With some difficulty |
18% |
33% |
42% |
With great difficulty |
3% |
45% |
5% |
Table 16
Percent of traditional food consumed by household by country.
|
Canada |
Greenland |
Chukotka |
Alaska |
|---|---|---|---|---|
None |
1% |
<1% |
9% |
1% |
Less than half |
24% |
33% |
34% |
15% |
About half |
35% |
27% |
29% |
24% |
More than half |
39% |
40% |
28% |
61% |
Table 17
Type of housing by country.
|
Canada |
Greenland |
Chukotka |
Alaska |
|---|---|---|---|---|
Single family |
73% |
44% |
11% |
91% |
Duplex, row house |
22% |
17% |
14% |
2% |
Multiple family |
4% |
32% |
66% |
5% |
Other |
1% |
6% |
9% |
2% |
Number of rooms by country | ||||
Less than 4 |
7% |
13% |
22% |
12% |
4 |
18% |
20% |
50% |
21% |
5 |
32% |
36% |
26% |
40% |
More than 5 |
42% |
31% |
2% |
27% |