Corps de l’article
At this juncture, the new opportunities digital technology brings forth in the area of education are difficult to ignore. It is also impossible to remain indifferent to the ever-increasing presence of artificial intelligence (AI) in all areas of society, such as in education. It is in this context that Quebec’s Chief Scientist, Rémi Quirion, announced in December 2018 the launch of the new International Observatory on the Societal Impacts of Artificial Intelligence and Digital Technologies. The Observatory brings together close to 20 university and college establishments as well as a large number of research centres, including the Centre de recherche interuniversitaire sur la formation et la profession enseignante (CRIFPE). The mission of the Observatory and its more than 160 researchers is to maximize the positive effects of AI and minimize its negative impacts. In a nutshell, focusing on the greater good of AI. The Observatory focuses on eight research themes, including Education and Empowerment. In 2019, the researchers behind Education and Empowerment Working Group, under the leadership of Thierry Karsenti, explored projects that could be carried out collaboratively. The idea of creating an interactive mapping of artificial intelligence in education quickly emerged as a unifying project.
What is a thematic and interactive mapping?
We decided on the thematic mapping of AI in education (figure 1). This portal is decidedly interactive, as it is updated on a regular basis. What is thematic mapping? It is the indexing of resources on a specific theme—AI in education in this case. We created an interactive mapping of the main tools, projects and resources on the use of artificial intelligence in education. This mapping will one day be smart. But at this time, this first iteration does not include a search engine with algorithms that can recommend resources to users based on their use. That said, the public’s use of our platform will allow us to collect valuable data to achieve that goal.
Figure 1
Website of the interactive mapping of artificial intelligence in education: https://cartographieia.ca/en/.
Interactive mapping of AI in education... What for?
When carrying out this large-scale project on AI in education, we thought it necessary to better understand all projects currently in existence around the world. And this is where our mapping is particularly useful. As it is the first project of its kind in this field, it has the potential of becoming the cornerstone of all projects that are directly or indirectly related to the use of AI in an educational or academic context. Beyond this first iteration, our goal is to encourage the indexing of all AI- and education-related initiatives to allow this mapping project to remain relevant and interactive for years to come. Our project could also help guide decisions, research and innovation related to AI in education. By using this mapping, researchers and organizations will be in a position to innovate, backed by a detailed global portrait of what is being done in this leading-edge field.
Main steps in creating an interactive mapping of AI in education
There were many steps involved in the design: 1) census of existing mappings;[1] 2) census of the literature to determine mapping indicators; 3) creation of an ontology of AI in education;[2] 4) design of the interactive platform (which allows for the consultation and indexing of different resources in a collaborative manner); 5) platform testing; 6) enhancements to the platform; 7) dissemination of the website. The scientific literature on mapping development reveals the importance of developing an entry indexing methodology. All members of our working group worked on this indexing strategy. At this stage, we had to configure the mechanics of how the resources would end up on the mapping platform. Determining the indicators to use is a step intimately linked to the indexing methodology. We had to properly identify the indicators to categorize the various resources, tools, projects, applications, etc., indexed in the platform. This work was and will remain iterative. Indicators will be added over time as we evolve and innovate. We also sought out indicators through a census of the scientific literature on the matter, in collaboration with all researchers of the Education and Empowerment Working Group.
The inner workings of our interactive mapping of AI in education
The mapping site of tools and projects in education and artificial intelligence is straightforward in its purpose, which is to enable users to learn more about the numerous educational resources available that rely on artificial intelligence by consulting the database. The site was also designed to allow anyone to submit resources quickly and easily—in English and in French—that have not yet been indexed. All submissions are then validated by our team of researchers prior to being uploaded to the platform.
An interesting feature of this interactive and participatory platform is that it offers users four different ways to search the indexed resources (figure 2):
-
A visual and interactive interface that evolves as resources are indexed (figures 3, 4 and 5);
-
A smart search engine with suggested keywords (figures 6 and 7);
-
A simple list of all indexed resources (figure 8), which can also be downloaded in different formats;
-
An interactive map of the world showing the location of the resources (figures 9 and 10).
Figure 2
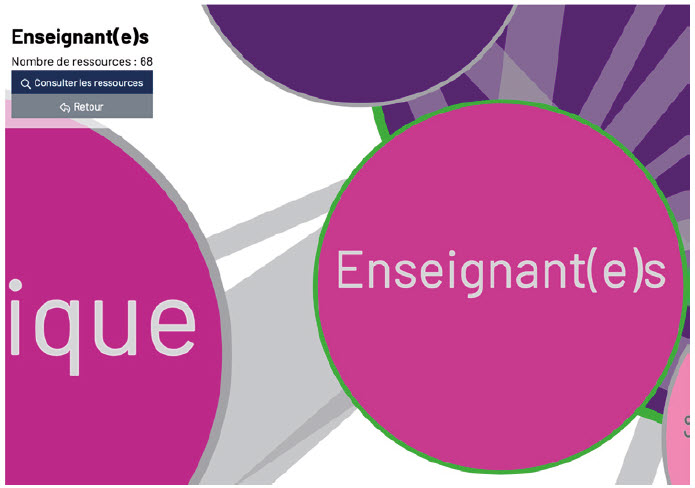
The interactive and visual search interface is truly an innovative aspect of our project. It contains the main indicators used for categorizing the indexed resources (figure 3). The larger the shape, the more projects it contains. For example, there are quite a few resources on learning analytics, with 189 resources. When we click on the bubble, it splits into various smaller bubbles that represent the subcategories of our index, meaning the different target audiences for these resources (figure 4). Once again, users can click on any of the bubbles to see how many resources have been indexed in this subcategory. For instance, there are 68 resources intended for teachers (figure 5).
Figure 3
Figure 4
Figure 5
The search engine, with its keywords and filters to narrow the search results, is inspired by the most up to date and effective search engine strategies (figure 6). For instance, if a user is interested in a specific target audience or AI use, they can simply click on those indicators to filter their search (figure 7). Future versions will feature a more advanced (or smart) search engine, which will make recommendations to users based on their search history, similar to Amazon’s and Netflix’s search engines.
Figure 6
Figure 7
The simple list allows users to see all resources in the form of visually appealing tiles, similar to how Netflix presents its listings (figure 8). These tiles also use the same images used in the search engine’s listing preview. To prevent the same resources from always ending up at the top of the list (e.g., those that start with the letter “A”), we’ve added a “Featured” section. This section presents, randomly and in groups of three, all the mapped resources. Finally, the resources can also be downloaded in PDF or CSV format.[3]
Figure 8
The interactive map of the world shows the location of the indexed projects (figure 9). For example, we indexed two projects from Africa, including UTIFEN, which provided online training to more than 10,000 teachers on a mobile platform. This interface gives us the opportunity to put in more effort to index projects from around the world, and not only those developed or carried out in North America. This component of our mapping project is proof positive of the inclusive nature of our project.
Figure 9
Figure 10
Conclusion
In a societal context where obtaining a comprehensive and evolving portrait of the many tools and projects related to artificial intelligence in education often seems impossible, the interactive mapping project emerges as an interesting solution for weeding through the wide array of AI initiatives. The aim of this project was to provide a virtual location that housed, organized, and indexed a significant number of initiatives. Bringing all these initiatives under one roof and categorizing them was quite a feat in itself. But the platform doesn’t stop there. It also provides easy access—in French and English—on any device to this indexed listing of tools and projects on AI in education through a user-friendly and intuitive interface. Additionally, the ability to easily propose new resources is sure to transform this website into a hub where all stakeholders will be keen to submit AI in education projects. It is clear that the four different methods of consulting the resources indexed by our team—interactive and visual mapping, the simple list, advanced and smart search engine, and map of the world—are sure to transform this tool into a veritable asset for different stakeholders in education with an interest for artificial intelligence, such as researchers, organizations, decision-makers, and even stakeholders on the ground. But how will this truly help the stakeholders on the ground? Instead of viewing AI in education as a panacea or a magic wand, it needs to be considered as a tool that can unleash unbounded educational potential. And that is exactly what the AI in education mapping will enable education practitioners to do: learn more about AI, its uses in education, and its potential impact on educational systems. More generally, this initiative shows that in addition to being an important research centre in the field of AI, Quebec also sets itself apart through its innovative character and its ethical, social and educational concern for the development and application of advances in artificial intelligence. The AI in education mapping project is proof positive of the role Quebec intends to play in terms of AI in education so that our educational systems may reap its benefits. In short, this is a way of focusing on the greater good of AI.
We thank all those who contributed to this major project. To learn more about the mapping project, the team behind it, or to consult or submit resources, go to cartographieia.ca/en.
Parties annexes
Notes
-
[1]
For example, the mapping of French research: https://www.campusfrance.org/en/map-French-research.
-
[2]
By definition, ontology is a structural framework of terms and concepts in a given area of knowledge and research. By extension, it is a streamlined and coherent representation of the conceptualization specific to a field, such as AI or digital technology in education. The creation of the ontology, the underlying framework of the mapping’s indexing of resources, will be addressed in a future publication. It is available on the mapping website.
- [3]
Liste des figures
Figure 1
Website of the interactive mapping of artificial intelligence in education: https://cartographieia.ca/en/.
Figure 2
Figure 3
Figure 4
Figure 5
Figure 6
Figure 7
Figure 8
Figure 9
Figure 10


