Résumés
Abstract
The general extent, outlet location at North Bay, and shoreline tilt pattern of glacial Lake Algonquin were established by Spencer, Gilbert, Taylor, and Goldthwait about a century ago. Chapman and Harrison in the mid 1900s identified several eastward outlets and suggested correlations to named water planes as retreating ice lowered Algonquin levels. The present work supplements the meagre available North Bay shoreline elevation data with about 30 new points. Probable Cedar Point, Payette, Sheguiandah, and Korah shorelines are identified; several lower levels have no known outlets. Algonquin shoreline tilts are about 1.4 metres per kilometre. Using Nipissing shoreline elevations for correlation, North Bay data are compared with Sudbury data, showing closely similar trends, but with offsets of Algonquin shorelines probably attributable to errors from 120‑kilometre-long projections and 5 000‑year changes in uplift pattern. Of 24 radiocarbon dates compiled from the literature, 16 are on gyttja. Some of these incorporate old carbon error and require further testing with dates on terrestrial plant macrofossils. Available data remain sparse and require more basic mapping to improve ice-margin/shoreline correlations near the outlet area.
Résumé
À North Bay, l’étendue générale et le patron incliné des lignes de rivage du lac glaciaire Algonquin ont été établis par Spencer, Gilbert, Taylor, et Goldthwait au siècle dernier. À la moitié des années 1900, Chapman et Harrison ont observé que plusieurs rivages pointent vers l’est et proposent un lien avec les plans d’eau présents lors du retrait des glaces et à la baisse du niveau d’eau du lac Algonquin. Ce projet ajoute des données sur l’altitude des lignes de rivage à North Bay, avec 30 nouveaux points. Les rivages de Cedar Point, Payette, Sheguiandah et Korah sont identifiés; certains niveaux n’ont pas d’exutoire connu. L’inclinaison du rivage du lac Algonquin est d’environ 1,4 m par km. En comparant l’altitude des lignes de rivage du lac Nipissing et celles de Sudbury, les données de North Bay montrent des tendances similaires, mais le décalage des rivages du lac Algonquin est probablement associé aux erreurs de la projection sur 120 km et des changements de patrons survenus lors du soulèvement durant les derniers 5 000 ans. Sur les 24 dates au radiocarbone disponibles dans la littérature, 16 proviennent du gyttja. Certaines dates ont une erreur liée à l’âge du carbone et demandent une datation plus approfondie des macrofossiles végétaux terrestres. Les données disponibles sont floues et exigent une cartographie de base pour améliorer l’étude de la concordance entre les lignes de rivage et les marges glaciaires.
Corps de l’article
Introduction
Lake Algonquin, the most extensive glacial lake in the Great Lakes area, formed during the last ice retreat from the Lake Michigan, Lake Huron, and Georgian Bay basins between 11 500 and 10 000 BP. A profusion of shoreline features has been described and instrumentally surveyed in thick drift areas of the southeastern Georgian Bay-Lake Simcoe area (Goldthwait, 1910; Stanley, 1936, 1937, 1938; Deane, 1950; Cronin, 1984), but shorelines are difficult to trace to the north on the Precambrian shield, where resistant bedrock and discontinuous thin drift prevail. This paper reports on new instrumental surveys of shoreline features near the last outlet of Lake Algonquin at North Bay (Fig. 1), in the northeastern Great Lakes region, the uncovering of which by glacial retreat brought an end to Lake Algonquin.
The large areal extent of Lake Algonquin has led to its being targeted for geophysical modelling of glacioisostatic crustal warping, with inferences about ice thickness and climate. Although the location of the final outlet for Lake Algonquin near North Bay has been recognized for over a century, the location and elevation of Algonquin shorelines has remained poorly documented along its eastern and northern coasts. The present work is part of a long-term effort to define the shoreline record throughout the Lake Algonquin basin and contribute to improved geophysical models of crustal warping.
Previous work
Spencer (1888) named Lake Algonquin and its beaches and presented a generalized drawing of its extent in Ontario (Spencer, 1891). Gilbert (1889) recognized its terminal outlet at North Bay eastward to the Ottawa valley. Taylor (1893) described several raised beach features northeast of North Bay and presented barometric elevations for them, and later named the Nipissing beach (Taylor, 1894). Goldthwait (1910), with more accurate instrumental levelling, determined revised elevations (about 9‑14 m higher) for Taylor’s North Bay shorelines. Taylor (1896) and Goldthwait (1910) noted that the northernmost highest shorelines and limits of submergence did not conform to the slope of the main Algonquin beach extrapolated from the south, but instead indicated lower shoreline elevations and derived gradients near North Bay. The shoreline features at North Bay described by Taylor (1893) and Goldthwait (1910), later were destroyed by gravel pit operations and airport construction.
The succession of lowering water levels marked by beaches associated with the draining of Lake Algonquin was named by Stanley (1936: Wyebridge, Penetang, Cedar Point, and Payette), Deane (1950: Ardtrea, Upper and Lower Orillia), and Hough (1958: Sheguiandah, Korah). Lang (1943) noted apparent shoreline features on air photos east of North Bay and northeast of Lake Talon, but did not visit the features nor survey them. However, he reported air photo parallax measurements of eight terraces or beaches between 289.5 and 384 m. These features, located remotely and far from bench marks, remain isolated and unsurveyed.
Chapman (1954) identified two outlets for lower Algonquin water levels across the highlands south of North Bay at Fossmill and Amable du Fond. He also noted and illustrated in his Figure 3 the decline below the extrapolated main Algonquin beach of the highest shore features northward. Chapman (1975) described lake features east of Georgian Bay to North Bay and reported elevations for a few shoreline features near North Bay.
Figure 1
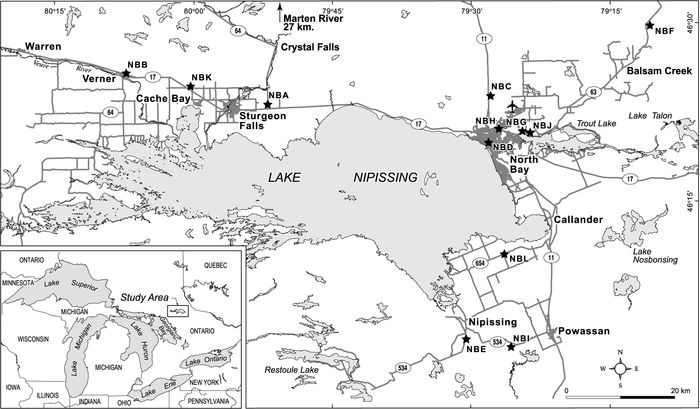
North Bay area, showing locations of survey profiles.
La région de North Bay montrant la localisation des profils à l’étude.
Harrison (1972) identified several additional outlets to the east, south of North Bay, and correlated their use as outlets with the various named declining Algonquin levels. He used a transit to survey four shoreline features and an altimeter for others in a few sequences north, south and east of North Bay. Lewis and Anderson (1989) compiled Great Lakes data on water levels and chronology, including some features of the North Bay area. From water flow calculations in the Mattawa area they postulated large water level fluctuations reflecting floods from Lake Agassiz and Lake Barlow-Ojibway into low level, post-Algonquin lakes Chippewa, Stanley, and Hough in the Lake Michigan, Lake Huron, and Georgian Bay basins, respectively.
Geological and topographic setting of study area
The City of North Bay is situated on the northeast shore of Lake Nipissing (195 m), an irregularly shaped water body 70 km west-east by 25 km north-south and less than 20 m deep. Its long axis parallels a fault-controlled lowland extending east from Georgian Bay which is floored by Ordovician carbonate and clastic sediments dipping gently southwest into the Michigan structural basin. The lowland trends eastward as an extension of the fault-controlled Ottawa-St. Lawrence graben. Local bedrock is Precambrian high-grade gneisses and plutons of the Grenville Province (1.7‑1.2 ), bounded to the northwest along the Grenville Front by the lower-grade metasediments of the Southern Province Huronian sequence (2.5‑2.1 ) (Lumbers, 1971). Small Cambrian intrusive complexes occur as islands and along the eastern shore of Lake Nipissing. Small outliers of Ordovician limestone and dolostone also occur on islands in Lake Nipissing and along the south shore (Colquhoun, 1958; Lumbers, 1971).
The bedrock in the lowland is partly mantled with till and varved silt and clay, which form a belt of deeper drift extending westward along the north shore of Georgian Bay and Lake Huron to Sault Ste. Marie. Ice flow was regionally southwestward (Boissonneau, 1968). On the marginal slopes of the lowland, wave-cut shorecliffs and beach ridges sporadically record the former presence of a succession of water levels formed as the ice retreated from the area.
The lowland has elevations of about 200 to 250 m west and south of Lake Nipissing but is constricted eastward of the lake by encroaching hills; the Lake Hough-Nipissing outlet sill is at the east end of Trout Lake at near 212 m (Goldthwait, 1910). Uplands to the north and south rise eastward to about 400 m, but continue rising southward toward Algonquin Park to over 500 m. Passages eastward across the southern highlands, identified by Chapman (1954) and Harrison (1972), provided the successive outlets for dropping levels of glacial Lake Algonquin during northeastward ice retreat. The isostatically depressed North Bay sill allowed post-Algonquin water levels to drop far below present Lake Huron level (177 m) to form the low water phases of the Lake Michigan (Lake Chippewa), Lake Huron (Lake Stanley), and Georgian Bay (Lake Hough) basins (Karrow and Calkin, 1985).
Methods
Survey profiles were made using plane table and alidade, working from bench marks along highways or in building foundations. Bench mark elevations and locations were from Ontario Ministry of Transport, Geodetic Survey of Canada, and City of North Bay (Table I). In some cases, elevations were carried across lakes using water level as reference. The work was carried out in the spring of the years 1998‑2000, between snow-melt and leafing of deciduous forest for optimum visibility. The resulting survey route maps provided the basis for constructing elevational profiles (in metres above sea level) of the shoreline features and sequences. Readings were taken in the field to the nearest centimetre, with identification of appropriate morphology being the chief source of error and variation.
Table I
Survey profiles and benchmark information, North Bay study

(G) ‑ Geodetic Survey of Canada, (M) ‑ Ministry of Transport of Ontario, (N) ‑ City of North Bay hydrant.
Survey profile sites
Profiles were surveyed at a dozen sites (Fig. 1; Table I). They are described in order from west to east, north, then south.
North and northwest of Lake Nipissing, a well marked low shorebluff lies to the north of and roughly parallels Trans Canada Highway 17. It extends westward up the Veuve River valley beyond Verner, but is less distinct as the valley narrows. Three profiles (NBB, NBK, NBA) near Verner, Cache Bay, and Sturgeon Falls, respectively, yielded elevations of 212 to 214 m for the base of the shorebluff. Another profile on the continuation of this feature, in central North Bay west of Algonquin Avenue, also provided an elevation at the shorebluff base of 212 m (site NBD).
Lewis and Anderson (1989) showed a shorecliff in northern North Bay, which they referred to as the Gateway shore. However, their description of the type site location (Lewis and Anderson, 1989: p. 122), as matched with tree patterns of their Figure 5A, is erroneous, as it is at Terrace Lawn Cemetery, not St. Mary’s Cemetery as stated; the latter is two blocks farther north and lacks clear shoreline features. Three determinations of the base of this bluff (profile NBH) averaged 235.7 m, consistent with the 236 m of Lewis and Anderson (1989). The area around the ski club hill, northeast of the Gateway site, was examined for shoreline features, but only a few unmodified fragments were noted.
A series of benches and bluffs occur on the high forested slope northwest of Trout Lake, in the northeastern part of North Bay. This profile (NBG) records a weak bench (bluff base) at 265.2 m, a stronger bluff base at 283.2 m, another weak bluff base at 292.5 m, and a strong bluff base at 306.7 m. The slope flattens above 319 m but no further shore features were seen.
Profile NBJ extended east from Trout Lake onto low terraces north of Highway 63. The area has been somewhat disturbed by gravel extraction, but appears to record delta edges and bluff bases at 225.3, 230, and 235.3 m. East of the North Bay airport is an ice-contact stratified drift complex heavily disturbed by long-continued gravel extraction. This complex appears to line up along the trend of an esker extending into the area from the north. The area likely contained some significant shoreline morphology in the altitudinal range of 310 to 360 m but is now too disturbed, as well as far from bench marks. The NBG sequence trends northeast into the low end of this area. Similarly, west of the airport is another heavily disturbed area (gravel pitting) in the range of 300 to 360 m that could not be surveyed, but a profile along Highway 11 (NBC) covers part of this range. This area is where Taylor (1893) first described raised beaches near North Bay which were later surveyed by Goldthwait (1910), so some data are available.
North of North Bay, along Highway 11, profile NBC records a strong shorebluff base at three places averaging 345.8 m with a weak lower one at 339.5 m. This shoreline trends northwest and divides higher ground to the northeast from a broad area of lower elevation and relief to the west, likely flooded by shallow glacial lake waters. A large embayment is recognizable on topographic maps, with lacustrine clay extending well north of Sturgeon Falls along the valley of the Sturgeon River. This area, between North Bay, Marten River (north of Sturgeon Falls), and Crystal River (northwest of Crystal Falls), and between Highways 11 and 64, has poor access and, as yet, surveys are not practical. Knowledge of this area would be much enhanced by systematic mapping of Quaternary geology, linking mapping of the Sudbury area (Burwasser, 1979; Barnett and Bajc, 1999) with that at North Bay (Harrison, 1972).
The highest shore feature of this study was determined on a large, flat-topped delta northeast of North Bay along Highway 63 beyond Balsam Creek (profile NBF). This delta, some four kilometres long and 2.5 km wide, heads to the northeast at Antoine Lake and has a small, steep-sided wet kettle about 20 m deep near its head beside the highway, with dating potential for a minimum age on delta formation. The front (southwest) edge of the delta top has an elevation of 359.2 m and at the south edge it is 358.4 m. Shallow channels one to two metres deep are evident on the delta top.
Much of the area south of Lake Nipissing has poor access with low relief, rough, bedrock-controlled topography. The prominent 212 m shorebluff so easily traced along the north side of the lake is seldom visible in the south. Only in the southeast was a measurable low shorebluff found along Highway 654 between Callander and Nipissing in profile NBL at 210.7 m.
Harrison (1972) described shoreline features on two forested hills southwest and southeast of Powassan (south of North Bay), which he referred to as Nipissing Ridge and Graham Lake Hill, respectively. He determined barometric elevations for several features on the north slope of Graham Lake Hill. This site was visited in the present study, but few good features were seen to survey, and it was far from bench marks. Graham Lake Hill is not isolated but is attached at high elevation to higher ground to the south.
In contrast to Graham Lake Hill, Nipissing Ridge is adjacent to bench marks along Highway 534. Harrison (1972) ran one transit survey (HT) up the east side of the hill, determining four shorebluff elevations of 298.4, 308.5, 320.0, and 332.5 m. He measured additional features by barometer from 280.4 to 344.4 m on the north, east, and south sides, as this hill has low ground all around it which isolates it from other high ground to the south. During the present study, an east-to-west traverse was surveyed across the top of Nipissing Ridge (profile NBI). Surveyed shoreline features overlap with those surveyed by transit and altimeter by Harrison (1972). A weak shorebluff was at 319.7 m (HT, 320 m). The crest of a gravel bar at a pit south of Ski Hill Road was at 335.6 and 335.5 m and was traced to the highest surveyed Harrison shorebluff (HT, 332.5 m). The crest of a bar south of Ski Hill Road was at 346.5 and 346.0 m, a possible weak shorebluff was at 345 m, the crest of a bar was at 346.1 m, another was at 346.3 m, and still another was at 338.1 m. Although the highest surveyed shoreline features (bars) were at about 346 m, elevations along Ski Hill Road rise to over 360 m. Whether the bouldery terrain had been submerged was not clear, but no definite evidence of lake action was seen higher than about 346 m.
The most extensive series of shoreline features surveyed in this project was south of South Bay of Lake Nipissing (profile NBE) near the settlement of Nipissing along Kings Road, off Highway 534 just south of its intersection with Highway 654. This site is outside the area mapped by Harrison (1972) and is west of Nipissing Ridge. The Kings Road sequence consisted of a probable shorebluff base at 220.1 m, another at 243.9 m, another at 260.1 and 260.2 m, base of a low subdued bluff at 299.4 and 299.8 m, base of shorebluff at 309.4 m (two places), bluff base at 321.4 m (two places), crest of pitted gravel bar near 334.6 m, bluff base at 337.2 and 337.3 m, and a bluff base at 344.8 and 345.0 m. The last was the highest shore feature seen on this profile, with bare rock rising above this to 351.2 m.
Harrison (1972) also measured by altimeter several bluff bases on the Rutherglen moraine, about half way between North Bay and Mattawa. The site was visited in this study but not surveyed because of the distance from bench marks over hilly terrain. Harrison (1972: p. 18) determined bluff bases as having elevations of 291.4, 301.1, 311.5, and 316.4 m.
Discussion
Elevation data analysis
The topography of the area, with a central lowland, bordered to the north and south by highlands, dictates that shoreline sequences with significant elevation ranges can only be present on the north and south flanks of the lowland. This geometry creates difficulty in correlation between the northern and southern parts of the area. The elevation data resulting from the present surveys (Fig. 2) are supplemented by a few elevations from Goldthwait (1910).
The surveys of Taylor (1893) and Goldthwait (1910) were based on the elevation of the C.P.R. station at North Bay, about which there is some confusion. Taylor (1893) gave this as 200.6 m. Taylor (1896) revised this from later railway and Geological Survey of Canada information to 201.8 m. Goldthwait (1910), employed by the Geological Survey of Canada, based his instrumental surveys on the same C.P.R. station at North Bay, using the elevation of 200.6 m. As of 1986, the Geodetic Survey of Canada, representative of source elevation data used for the present surveys, gave in their survey Line IU82 a bench mark at the North Bay C.P.R. station (“bolt in centre of east end wall, in first course of stonework above platform”) as 201.99 m. This is very close to the later Taylor (1896) elevation. Considering also the recent rate of uplift at North Bay is about 0.39 m per century (Clark and Persoage, 1970), this amount should be accounted for when comparing elevations taken nearly a century apart. Allowing for some 30 cm of uplift, the 1896 and 1986 values are essentially identical. Considering geomorphic sources of error in the field, however, the surveyed data from various sources should be approximately comparable.
Figure 2
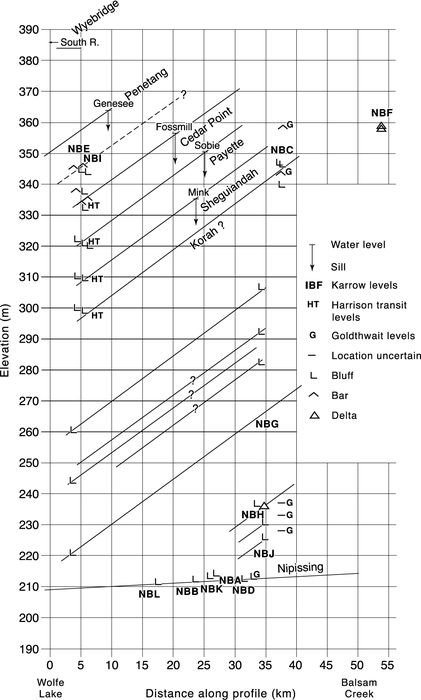
Profile of North Bay shoreline elevational data and water planes projected to a line at north 21˚ east of true north. Distance to northeast is measured from the northeast shore of Wolfe Lake (46˚ 02’ N, 79˚ 32’ W) to beyond Balsam Creek.
Profil d’altitude des lignes de rivage de North Bay et la projection des plans d’eau sur une ligne à 21˚ nord-est du nord véritable. La distance est mesurée à partir de la rive nord-est du lac Wolfe (46˚ 02’ N, 79˚ 32’ W) jusqu’à Balsam Creek.
Harrison (1972) does not present his shoreline data in a way that allows close comparison, but his Figure 2 shows his outlet data, both sill elevations, (presumably from barometric and map data), and former water levels from field observations, as given in his Figure 15. From this, some shoreline features with consistent slopes can be identified as Sheguiandah, Payette, and Cedar Point, as well as the lowest features as Nipissing. A cluster of features above Cedar Point seems too low for the Genesee outlet Harrison (1972) correlates to the Penetang, but this is consistent with his Figure 16 shoreline diagram which shows no corresponding shoreline data points. In Figure 2, some data points in the south (NBE, HT) correlate with the Highway 11 north features (NBC, G), but are somewhat higher than the Balsam Creek delta (NBF), although they could be correlated with a slightly lower slope (perhaps Korah). Still lower features in the south (NBE) have some correspondence to lower features in the north (site NBG), but being below the Korah level, must represent lower and younger unnamed water levels. Post-Korah water level features were also found near Sudbury (Heath and Karrow, unpublished), but the North Bay features are mostly lower than these and do not seem to correspond. The younger and lower phases have yet to be linked to any outlets and not enough is yet known about them to justify naming. Lowest of all is the feature named by Lewis and Anderson (1989) as the Gateway shore, (NBH) which they attributed to hydraulic damming in the Ottawa Valley of Ojibway-Agassiz flood events. Lower features north of Trout Lake (NBJ) may also be so related, representing water levels about 12 to over 20 m above Nipissing. These also correspond to some low features in Figure 2 with uncertain location surveyed by Goldthwait (1910), annotated with “G”.
North Bay data can be compared to Sudbury data (Heath and Karrow, unpublished), as both sets cluster approximately near the same isobase as shown on regional maps (e.g. Lewis and Anderson, 1989). The gently tilted Nipissing shoreline can be used to tie the two data sets together by shifting the plots of shoreline data to match at the 210 m elevation of the Nipissing shoreline. This can be only approximate as Sudbury and North Bay are 120 km apart and the Earth’s surface curvature on maps is an increasing problem with distance of extrapolation. Also, such a method assumes no change in uplift pattern over the 5 000‑year time span between Algonquin and Nipissing shorelines (see Lewis and Anderson, 1989, Figure 2 for contrasting isobase patterns for these shorelines). Nevertheless, the tilted shoreline pattern is very similar, with Algonquin series shoreline tilts of about 1.4 m per km for both sets of data. The tilt of the Nipissing shoreline is also very similar in the two areas (about 0.1 m per km). However, the shorelines named in the two areas are mismatched by about one shoreline interval —i.e. the features at Sudbury correlated to the Payette, correspond to the Sheguiandah of the North Bay area. Put another way, the Sheguiandah shoreline isobases of Sudbury are shifted about 10 km southward at North Bay, and this corresponds to a difference in trend of about 5˚. Considering that there are approximations involved from field work through data interpretation and correlation, these results are not surprising, but pose questions for further study. The close correspondence in the trends, though, suggests a considerable level of confidence in the results. Additional field data from the area between Sudbury and North Bay are needed to clarify the correlations and extents of these lake phases.
Lake chronology
Terasmae and Hughes (1960) used palynology, radiocarbon dates from isolation basin basal organic sediments, and varves to conclude the North Bay outlet was deglaciated between 11 000 and 10 000 BP. Lewis (1969) added several supporting isolation basin dates from near North Bay. Harrison (1972) also obtained basal organic radiocarbon dates. Two of these from “Boulder Lake” [sic] and other data, were used for an Algonquin chronology beginning before 13 000 BP, with drainage to the Payette level before 12 000 BP. In southern Ontario, Karrow et al. (1975) used mainly wood and peat dates from lagoonal and estuarine sites, to derive a main Algonquin transgression chronology of 11 300 to 10 500 BP, with final Algonquin drainage between 10 500 and 10 000 BP.
The literature on the North Bay area yielded 24 radiocarbon dates (Table II). Several other similar dates on gyttja from sites west of Lake Nipissing are not included. Most of these dates were obtained as minimum ages for deglaciation and the dropping of water levels. Of the 24 dates, 16 are on gyttja. Since they cannot be determined to comprise terrestrial plant material, they have to be considered suspect for possible old carbon error — i.e. they may be erroneously old (Karrow and Anderson, 1975). The two oldest gyttja dates (GSC‑1363: 11 800 ± 400; GSC‑1429: 11 500 ± 180) from “Boulder Lake” [sic] were the basis of Harrison’s old chronology. Anderson et al. (2001) recored the site (as Turtle Lake) and using terrestrial seeds from the same stratigraphic level as the old dates obtained an accelerator mass spectrometry (AMS) date about 2 000 years younger (CAMS‑46195: 9450 ± 50), in agreement with the Terasmae and Hughes (1960) and Karrow et al. (1975) chronologies. Another anomalously old date on gyttja from Miron Lake (BETA‑19152: 14 290 ± 170) also appears to involve old carbon error. The validity of all the gyttja dates is thrown into question. Some or many may be correct, but that should be demonstrated selectively by additional AMS dating (see Yansa (2005) for an example of redating of gyttja sites in the prairies, where terrestrial macrofossil dates are up to 1 500 years younger). Non-gyttja dates at Turtle Lake and Frair Lake (S‑100: 9570 ± 150) appear to be valid minimum ages for deglaciation. Of the other six non-gyttja dates, three (BGS‑302, GSC‑1097, GSC‑1097‑2) are on the same log giving consistent, but not closely confining, minimum ages of 8500‑8700 BP for Algonquin drainage. None of the lake levels are directly dated by samples from the North Bay area.
Conclusions
Even with the additional shoreline survey data resulting from the present study, the aggregate data for the North Bay area remain sparse. Available data indicate Algonquin series shorelines are tilted up to the northeast at about 1.4 metres per kilometre. A series of parallel water planes fits the available survey data, and the shoreline and outlet data of Harrison (1972) and suggest the presence of Cedar Point, Payette, and Sheguiandah waterplanes. The next lower water plane is a candidate for the Korah waterplane. Several lower waterplanes are suggested to be unnamed post-Korah water planes with no known outlet locations. The lowest features may correlate with Lewis and Anderson’s (1989) Gateway and other later hydraulic damming flood levels of the Ottawa Valley. More data are needed from northwest and northeast of North Bay to clarify ice-front positions and lowering water levels in the North Bay area.
Meanwhile, this study has documented, synthesized, and clarified shoreline relations in the important North Bay outlet area of Lake Algonquin. Such refinement will provide a firmer basis for geophysical and paleogeographic modelling as other studies move to analyze the effects of outflow floods in the Great Lakes-St. Lawrence-North Atlantic area.
Table II
Radiocarbon dates from the North Bay area
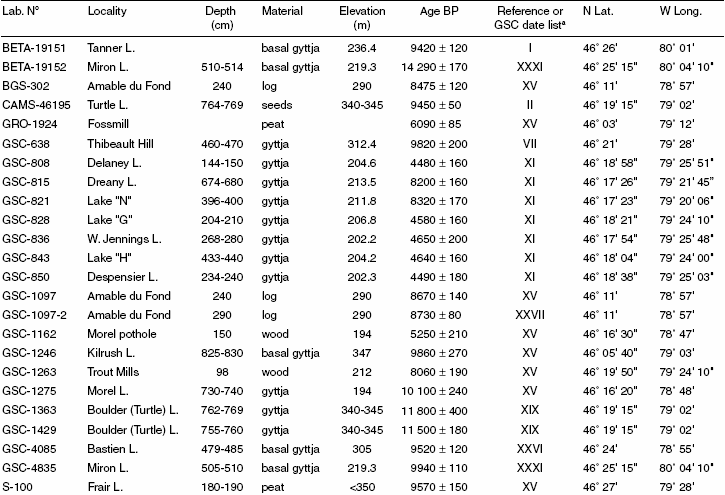
I ‑ Lewis and Anderson (1989), II ‑ Anderson et al. (2001), VII ‑ Lowdon and Blake (1968), XI ‑ Lowdon et al. (1971), XV ‑ Lowdon and Blake (1975), XIX ‑ Lowdon and Blake (1979), XXVI ‑ Blake (1987), XXVII ‑ Blake (1988), XXVIII ‑ McNeely (1989), XXXI ‑ McNeely and Jorgensen (1993).
Parties annexes
Acknowledgements
Bench mark and other elevation control information were supplied by the Ontario Ministry of Transportation, the Geodetic Survey of Canada and the City of North Bay. P.L. Bullock, of the City of North Bay, provided logistical help and information about the area. Field trips with P.L. Bullock, D. Rees of Nipissing University, P.J. Barnett, Ontario Geological Survey, and J.E. Harrison, enhanced appreciation of the local geology. Air photos and other information were loaned by R.I. Kelly, Ontario Geological Survey. The cooperation of the staff of the Ministry of Natural Resources Fish Hatchery near Balsam Creek and the Canadian Armed Forces NORAD base in North Bay for access to survey, was much appreciated. Field assistance was provided capably by D. Brunner in 1998, K. Reich in 1999, and J. Severin in 2000. Figures were prepared by B. Levely, University of Waterloo. Field expenses were provided by a Natural Sciences and Engineering Research Council grant to Karrow. Reviewers S.A. Drzyzga and P.J. Barnett and guest editor S. Wolfe are thanked for their comments, which significantly improved the manuscript. Acknowledgements would not be complete without reference to the interest of V.K. Prest in the North Bay area and his arranging the mapping of the area by J.E. Harrison. He was invited to join us on our field trip in the North Bay area in 2000 but could not attend.
References
- Anderson, T.W., Lewis, C.F.M. and Mott, R.J., 2001. AMS‑revised radiocarbon ages at Turtle Lake, North Bay-Mattawa area, Ontario: Implications for the deglacial history of the Great Lakes region. 27th Annual Scientific Meeting of the Canadian Geophysical Union, Ottawa, Ontario, p. 51.
- Barnett, P.J. and Bajc, A.F., 1999. Surficial geology, Regional Municipality of Sudbury. Ontario Geological Survey, Preliminary Map P‑3399.
- Blake, W., Jr. 1987. Geologcial Survey of Canada radiocarbon dates XXVI. Geological Survey of Canada, Ottawa, Paper 86‑7, 60 p.
- Blake, W., Jr., 1988. Geological Survey of Canada radiocarbon dates XXVII. Geological Survey of Canada, Ottawa, Paper 87‑7, 100 p.
- Boissonneau, A.N., 1968. Glacial history of northeastern Ontario II. The Timiskaming-Algoma area. Canadian Journal of Earth Sciences, 5 : 97‑109.
- Burwasser, G.J., 1979. Quaternary geology of the Sudbury basin area, District of Sudbury. Ontario Geological Survey, Report 181, 103 p.
- Chapman, L.J., 1954. An outlet of Lake Algonquin at Fossmill, Ontario. Proceedings of the Geological Association of Canada, 6, part 2, 61‑68.
- Chapman, L.J., 1975. The physiography of the Georgian Bay-Ottawa Valley area of southern Ontario. Ontario Division of Mines Geoscience, Report 128, 33 p.
- Clark, R.H. and Persoage, N.P., 1970. Some implications of crustal movement in engineering planning. Canadian Journal of Earth Sciences, 7 : 629‑633.
- Colquhoun, D.J., 1958. Stratigraphy and paleontology of the Nipissing-Deux Rivieres outliers. Proceedings of the Geological Association of Canada, 10 : 83‑93.
- Cronin, J.T., 1984. The raised shorelines of the northern Penetanguishene Peninsula. M.Sc. thesis, Department of Geography, University of Western Ontario, 231 p.
- Deane, R.E., 1950. Pleistocene geology of the Lake Simcoe district, Ontario. Geological Survey of Canada, Ottawa, Memoir 256, 108 p.
- Gilbert, G.K., 1889. The history of the Niagara River. Commission of the State Reservation at Niagara, Sixth Annual Report, p. 61‑84.
- Goldthwait, J.W., 1910. An instrumental survey of the shorelines of the extinct lakes Algonquin and Nipissing in southwestern Ontario. Geological Survey of Canada, Ottawa, Memoir 10, 57 p.
- Harrison, J.E., 1972. Quaternary geology of the North Bay-Mattawa region. Geological Survey of Canada, Ottawa, Paper 71‑26, 37 p.
- Hough, J.L., 1958. Geology of the Great Lakes. University of Illinois Press, Urbana, Illinois, 313 p.
- Karrow, P.F. and Anderson, T.W. 1975. Palynological study of lake sediment profiles from southwestern New Brunswick: Discussion. Canadian Journal of Earth Sciences, 12 : 1808‑1812.
- Karrow, P.F., Anderson, T.W., Clarke, A.H., Delorme, L.D. and Sreenivasa, M.R. 1975. Stratigraphy, paleontology, and age of Lake Algonquin sediments in southwestern Ontario, Canada. Quaternary Research, 5 : 49‑87.
- Karrow, P.F. and Calkin, P.E. (eds.), 1985. Quaternary Evolution of the Great Lakes. Geological Association of Canada, Special Publication 30, 258 p.
- Lang, A.H., 1943. Terraces near North Bay, Ontario. Transactions of the Royal Society of Canada, Third Series, v. 37, Section 4, p. 49‑52.
- Lewis, C.F.M., 1969. Late Quaternary history of lake levels in the Huron and Erie basins. Proceedings 12th Conference on Great Lakes Research, p. 250‑270.
- Lewis, C.F.M. and Anderson, T.W., 1989. Oscillations of levels and cool phases of the Laurentian Great Lakes caused by inflows from glacial lakes Agassiz and Barlow-Ojibway. Journal of Paleolimnology, 2 : 99‑146.
- Lowdon, J.A. and Blake, W. Jr. 1968. Geological Survey of Canada radiocarbon dates VII. Geological Survey of Canada, Ottawa, Paper 68‑2, Part B, 39 p.
- Lowdon, J.A., Robertson, I.M. and Blake, W., Jr. 1971. Geological Survey of Canada radiocarbon dates XI. Geological Survey of Canada, Ottawa, Paper 71‑7, 70 p.
- Lowdon, J.A. and Blake, W., Jr. 1975. Geological Survey of Canada Radiocarbon dates XV. Geological Survey of Canada, Ottawa, Paper 75‑7, 32 p.
- Lowdon, J.A. and Blake, W., Jr., 1979. Geological Survey of Canada radiocarbon dates XIX. Geological Survey of Canada, Ottawa, Paper 79‑7, 58 p.
- Lumbers, S.B., 1971. Geology of the North Bay area, districts of Nipissing and Parry Sound. Ontario Department of Mines and Northern Affairs. Geological Report 94, 104 p.
- McNeely, R. 1989. Geological Survey of Canada radiocarbon dates XXVIII. Geological Survey of Canada, Ottawa, Paper 88‑7, 93 p.
- McNeely, R. and Jorgensen, P.K. 1993. Geological Survey of Canada radiocarbon dates XXXI. Geological Survey of Canada, Ottawa, Paper 91‑7, 85 p.
- Spencer, J.W., 1888. Notes on the origin and history of the Great Lakes of North America. American Association for the Advancement of Science, 37 : 197‑199.
- Spencer, J.W., 1891. Deformation of the Algonquin beach, and birth of Lake Huron. American Journal of Science, 141 : 12‑21.
- Stanley, G.M., 1936. Lower Algonquin beaches of Penetanguishene Peninsula. Geological Society of America Bulletin, 47 : 1933‑1960.
- Stanley, G.M., 1937. Lower Algonquin beaches at Cape Rich, Georgian Bay. Geological Society of America Bulletin, 48 : 1665‑1686.
- Stanley, G.M., 1938. Impounded early Algonquin beaches at Sucker Creek, Grey County, Ontario. Michigan Academy of Science, Arts, and Letters, 23 : 477‑495.
- Taylor, F.B., 1893. The ancient strait at Nipissing. Geological Society of America Bulletin, 5 : 620‑626.
- Taylor, F.B., 1894. A reconnaissance of the abandoned shore lines of the south coast of Lake Superior. The American Geologist, 13 : 365‑383.
- Taylor, F.B., 1896. Notes on the Quaternary geology of the Mattawa and Ottawa valleys. The American Geologist, 18 : 108.
- Terasmae, J. and Hughes, O.L., 1960. Glacial retreat in the North Bay area, Ontario. Science, 131 : 1444‑1446.
- Yansa, C.H., 2005. The timing and nature of Late Quaternary vegetation changes in the northern Great Plains, USA and Canada: a re-assessment of the spruce phase. Quaternary Science Reviews, 25: 263‑281.
Liste des figures
Figure 1
North Bay area, showing locations of survey profiles.
La région de North Bay montrant la localisation des profils à l’étude.
Figure 2
Profile of North Bay shoreline elevational data and water planes projected to a line at north 21˚ east of true north. Distance to northeast is measured from the northeast shore of Wolfe Lake (46˚ 02’ N, 79˚ 32’ W) to beyond Balsam Creek.
Profil d’altitude des lignes de rivage de North Bay et la projection des plans d’eau sur une ligne à 21˚ nord-est du nord véritable. La distance est mesurée à partir de la rive nord-est du lac Wolfe (46˚ 02’ N, 79˚ 32’ W) jusqu’à Balsam Creek.
Liste des tableaux
Table I
Survey profiles and benchmark information, North Bay study
(G) ‑ Geodetic Survey of Canada, (M) ‑ Ministry of Transport of Ontario, (N) ‑ City of North Bay hydrant.
Table II
Radiocarbon dates from the North Bay area
I ‑ Lewis and Anderson (1989), II ‑ Anderson et al. (2001), VII ‑ Lowdon and Blake (1968), XI ‑ Lowdon et al. (1971), XV ‑ Lowdon and Blake (1975), XIX ‑ Lowdon and Blake (1979), XXVI ‑ Blake (1987), XXVII ‑ Blake (1988), XXVIII ‑ McNeely (1989), XXXI ‑ McNeely and Jorgensen (1993).