Résumés
Abstract
During the Würmian glaciation, the Jura ice sheet covered the Joux Valley (Vaud, Switzerland). A geomorphological study reveals many drumlins in this valley. Some are composed of gravels and sand, others of till. Outcrops show that the surface of the sandy-gravel drumlins is a major and sharp erosion surface. Given the lack of shearing structures in sediments below this erosion level, its origin cannot be linked to ice action of the glacier. Very high-energy subglacial meltwater floods (jökulhlaups), probably due to the drainage of subglacial or supra-glacial lakes, are the more likely cause of the erosion. Results of a ground penetrating radar (GPR) survey show the internal structure of one of these sandy-gravel drumlins to depth of 15 m. These GPR data, together with sedimentological observations, indicate that prior to erosion, subglacial sedimentation occurred in closed conduits (eskers) with strong and rapid flow variations. The sediments contain large chute-and-pool structures (high flow energy backset accretion) with dimensions comparable to the conduit width. Therefore, we interpret these sandy-gravel drumlins as portions of eskers, their present drumlin shape being the result of erosion by one or many jökulhlaups.The good preservation of the subglacial meltwater deposits is the result of the closed-basin geometry of the Joux Valley, which limited movement at the base of the glacier. This new contribution to the interpretation of the Joux Valley glacial features underlines the importance of meltwater in sedimentological processes under the Jura ice sheet.
Résumé
Durant la glaciation würmienne, la calotte glaciaire jurassienne recouvrait la vallée de Joux (Vaud, Suisse). Une étude géomorphologique du fond de cette vallée révèle la présence de nombreux drumlins composés de sables et de graviers stratifiés ou de till. Les affleurements montrent que la surface des drumlins gravelo-sableux correspond à une surface d’érosion importante. Étant donné l’absence de structures de cisaillement dans les sédiments sous-jacents, l’origine de cette érosion ne peut être liée au mouvement du glacier et serait due à un écoulement sous-glaciaire important (jökulhlaup) résultant du drainage rapide d’un ou plusieurs lacs supra-glaciaires ou sous-glaciaires. Une campagne géoradar sur un de ces drumlins gravelo-sableux montre sa structure interne jusqu’à 15 m de profondeur. Ces données géoradar, associées à des observations sédimentologiques, montrent qu’avant l’érosion, la sédimentation sous-glaciaire avait lieu dans des conduits fermés (eskers) avec de fortes et rapides variations de courant. Les sédiments présentent de grandes structures de chute-and-pool (accrétion en backsets liée à un fort courant) aux dimensions similaires à la largeur du conduit. Nous interprétons ces drumlins gravelo-sableux comme des portions d’eskers ayant acquis leur forme actuelle à la suite d’un ou plusieurs jökulhlaups. La bonne préservation des dépôts sous-glaciaires est attribuable à la géométrie de bassin fermé de la vallée de Joux, qui limitait le mouvement de la glace à la base du glacier. Cette nouvelle contribution à l’interprétation des dépôts glaciaires de la vallée de Joux met en évidence l’importance de l’eau de fonte dans les processus sédimentaires agissant à la base de la calotte jurassienne.
Resumen
Durante la glaciación de Würm, el manto glaciar del Jura cubría el valle de Joux (Vaud, Suiza). Un estudio geomorfológico revela muchos drumlins dispuestos en el valle, algunos compuestos de arena y grava otros de tillita. Los afloramiento rocosos muestran que la superficie en los drumlins de tipo grava-arena poseen una superficie marcadamente erosionada. Dada la ausencia de estructuras de cizallamiento en los sedimentos situados bajo el nivel de erosión, su origen no puede ser asociado a la acción del hielo proveniente del glaciar. Es probable que dicha erosión sea el resultado del flujo sublaciar (jökulhlaups), debido al drenaje sub o supraglaciar de los lagos. Los resultados del análisis con georadar muestran la estructura interna de uno de estos drumlins de arena y grava hasta una profundidad de 15 m. Los datos obtenidos con georadar junto con las observaciones sedimentológicas indican que anterior a la erosión una sedimentación subglaciar fue llevada a cabo en los conductos cerrados (eskers) con una fuerte y repentina variación de la corriente. Los sedimentos contienen estructuras grandes de acreción en backset de dimensiones comparables al grosor del conducto. Sin embargo, nuestra interpretación sitúa estos drumlins como parte de eskers, la forma actual de drumlin es el resultado de la erosión causada por uno o varios jökulhlaups. El buen estado de conservación en que se encuentran los depósitos subglaciares es el resultado de la geometría de la cuenca cerrada del valle de Joux, la cual limita el movimiento de la base del glaciar. Esta nueva contribución a la interpretación de las características del valle de Joux señala la importancia del agua de fusión en el proceso sedimentológico bajo el manto glaciar del Jura.
Corps de l’article
Introduction
Situated in a synclinorium of the Swiss Jura mountains, the Joux Valley is U-shaped with steep flanks and a flat bottom, gently sloping (1.95°) towards the NE (Fig. 1). The Orbe River occupies the valley and flows into Lake Joux. The Dent du Vaulion mountain, a thrusted block produced by the Pontarlier strike-slip fault (Fig. 1), closes the valley at its NE extremity and outflows of the Orbe occurs by sub-lacustrine karst (Aubert, 1959). The closed basin condition led to the accumulation of large volumes of ice during the Würmian glaciation (70 000 -20 000 years BP). At the Würmian maximum, the Jura ice sheet rose to 2 000 m above sea level (Campy, 1992) and approximately 800 m of slow-moving ice covered the Joux Valley.
Figure 1
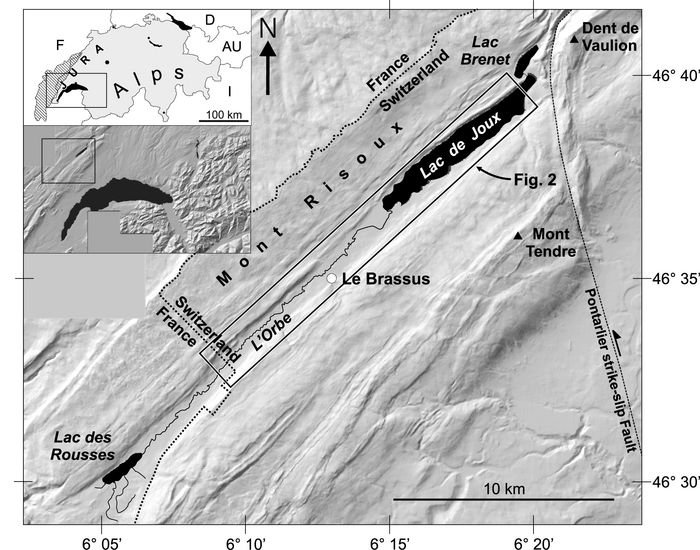
Location map of the Joux Valley (Vaud, Switzerland). In the upper inset, the hatched zone represents the maximum extent of the Jura ice sheet during the Würmian glaciation (after Campy, 1992). The NE portion of main map shows the N-S Pontarlier strike-slip fault, which displaced Dent de Vaulion Mountain towards the axis of the Joux synclinorium and closed the valley.
Situation géographique de la vallée de Joux (Vaud, Suisse). Sur la carte de la Suisse, la zone hachurée représente l’extension maximale de la calotte jurassienne durant la glaciation würmienne (d’après Campy, 1992). Sur la partie NE de la carte principale, noter le décrochement de Pontarlier, d’orientation N-S, qui a amené la Dent de Vaulion dans l’axe du synclinorium de la vallée de Joux. Cette cassure fait de la vallée de Joux un bassin fermé.
Aubert (1943) conducted extensive studies on the glacial history of the Joux Valley. His major findings included the presence of frontal and median moraine ridges, as well as the existence of an ancient proglacial lake with deltaic sand and gravel deposits at the end of the Würmian glaciation. Our study examines some of his findings, taking into account the importance of subglacial meltwater circulation below the glacier and the possibility of drumlin and esker formation. Subglacial processes are still poorly understood (e.g., Menzies, 1989) and their study at a small valley scale may be of particular interest. Furthermore, deposits such as eskers and gravel drumlins are potential aquifers, and mapping their extent and connectivity is useful for groundwater management and subsurface pollution propagation.
Our study comprises three parts: i) geomorphology of the valley hills; ii) sedimentology of sand and gravel deposits in outcrops; and iii) ground penetrating radar (GPR) mapping of these same sand and gravel deposits.
Hill Geomorphology
Many rounded and elongated hills cover the bottom of the Joux Valley. A geomophological map was constructed to highlight their shape and distribution, using aerial photographs, topographical data and field observations (including Aubert’s (1943) observations) (Fig. 2). In plan view, the hills are oval-shaped, with long axes subparallel to the valley axis; their dimensions range from 250 to 800 m long, from 100 to 200 m wide and from 5 to 20 m high. Some of the hills are amalgamated (Fig. 2). Outcrops show that some hills comprise diamicton and other gravel and sand.
Aubert (1943) interpreted these mounds as lateral or median moraines. However, this interpretation is not compatible with their shape, their limited longitudinal extent, the lack of extended, ridge-like alignment among them and the variability of their composition. Instead, the foregoing characteristics lead to the appellation of drumlins, i.e., subglacial elongated hills (Menzies, 1979). Their absence in some parts of the valley (Fig. 2) can be explained by the infilling of subglacial depressions with fluvio-lacustrine sediments after the retreat of the glacier.
Figure 2

Geomorphological map based on aerial photographs and topographical maps, showing drumlins covering the valley bottom. Note their sub-parallel orientation and variable composition. Some are amalgamated (a) and others are divided (d) by postglacial rivers. Q = Le Carré quarry, M = frontal moraine. See Fig. 1 for location. Swiss coordinates.
 = drumlin or drumlinoid (internal line indicates the crest)
Composition:
 diamict
 gravel and sand
 unknown
Carte géomorphologique montrant les drumlins du fond de la vallée de Joux, réalisée à partir de photographies aériennes et de la carte topographique à 1/25 000. Noter l’orientation sub-parallèle des drumlins et leur composition variable. Certains sont amalgamés (a), d’autres sont divisés par des cours d’eau postglaciaires (d). Q = carrière du Carré, M = moraine frontale. Voir figure 1 pour la localisation. Coordonnées suisses.
Sedimentology of Gravel and Sand Deposits
Study Sites
The Praz-Rodet – Le Carré (PRLC) deposits form a long hill, situated along the northwestern side of the valley, which extends 1 km parallel to the valley side. It is narrow and sharp in the SW, pinched in the centre, and wide and rounded in the NE (Figs. 3a, 3b). Aubert (1943) viewed these deposits as two different features: he interpreted the Praz-Rodet ridge, in the SW, as part of a frontal moraine rampart, and the Le Carré deposits, in the NE, as deltaic deposits related to a pro-glacial lake. This interpretation is not evident, so we will refer to these deposits as the Praz-Rodet – Le Carré (PRLC) gravel complex. At the NE end of the complex, an active limestone gravel and sand quarry exposes a transversal outcrop of the SE half of the hill and a longitudinal outcrop below the hill crest. Excavations 3 m below the bottom of the quarry reached a compact and clayey diamicton, apparently unaffected by shearing. Diamicton depth is confirmed by boreholes (CSD, 1996).
Sedimentary Facies
Sediments of the quarry range from silt to coarse gravel and are well rounded, indicating significant fluvial transport. We classify them into five sedimentary facies (Figs. 4, 5).
Figure 3
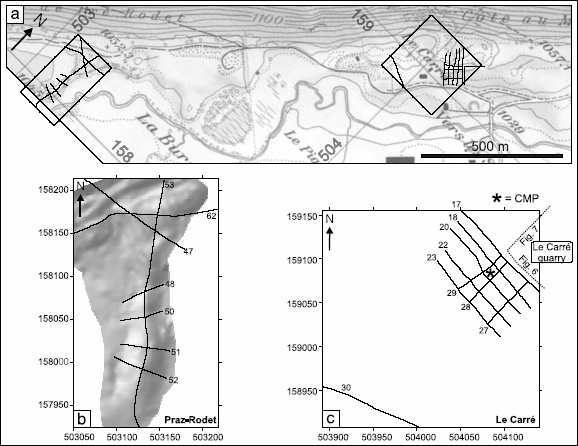
a) Location of the Le Carré quarry and the two GPR surveys on the PRLC complex. (Base map reprinted with the authorization of the Federal Office of Topography, Switzerland - BA013799.) b) Praz-Rodet GPR lines and a shaded gray representation of a local Digital Elevation Model (based on GPS data) showing the sharpness of this part of the PRLC complex (light source from the NW). c) Detail of Le Carré GPR lines and Le Carré quarry location. Swiss coordinates.
a) Localisation de la carrière du Carré et des deux campagnes géoradar sur le complexe de PRLC. (Carte de base reproduite avec l’autorisation de l’Office fédéral de la Topographie, en Suisse - BA013799.) b) Tracé des lignes géoradar de Praz-Rodet superposé à une représentation ombrée d’un Modèle Numérique d’Altitude (réalisé à partir de données GPS) montrant les flancs raides de cette partie du complexe de PRLC. c) Tracé des lignes géoradar du Carré et situation de la carrière. Coordonnées suisses.
Figure 4
a

Alternation of stratified sands (S) and polymodal gravels (P). The layers’ flexure is due to post-depositional compaction.
Alternance de sables stratifiés (S) et de graviers polymodaux (P). La flexure des couches est due à la compaction après dépôt.
b

Transition between different facies. Trowel is 30 cm long. P = polymodal; Bm / Bc = bimodal, matrix/clast supported; O = open framework.
Transition entre différents faciès. La truelle mesure 30 cm. P = polymodal ; Bm / Bc = bimodal non jointif/jointif ; O = sans matrice.
Massive sedimentary facies from the quarry transversal outcrop (Fig. 3c).
Faciès sédimentaires de l’affleurement transversal de la carrière (fig. 3c).
Figure 5
a

Stratified sands between polymodal gravels. Flow is out of the page. Below the sands, a thin indurated silt bed indicates a brief interruption of the flow. Swiss knife is 20 cm high.
Sables stratifiés entre des graviers polymodaux. Le courant sort de la page. Sous les sables, un fin niveau limoneux induré indique un bref arrêt du courant. Le couteau suisse mesure 20 cm.
b
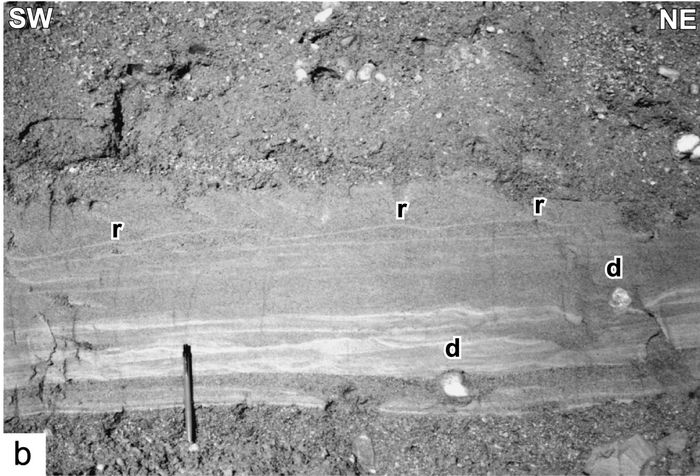
Flow-parallel section in stratified sands with current ripples (r) indicating a flow toward the NE. Note the dropstones (d). Pen is 20 cm high.
Section parallèle au courant dans des sables stratifiés avec des rides de courant (r) indiquant un courant vers le NE. Noter les galets relâchés (d). Le stylo mesure 20 cm.
Stratified facies from the quarry transversal outcrop (Fig. 3c).
Faciès stratifiés de l’affleurement transversal de la carrière (fig. 3c).
Polymodal facies (P) is very common and comprises medium sand to coarse gravel, with slight vertical variations of the granulometry in each unit. Elements do not have any preferential orientation and the base of each unit is, in places, slightly erosive. Grading may be absent, normal or reverse, with inversions of the grading within one layer. All these characteristics point towards a traction carpet deposit due to the traction of an overlying high-energy current (Sohn, 1997).
Bimodal matrix-supported facies (Bm) shows a strongly marked bimodality with typically coarse gravel elements in a sandy matrix. It can be normally or inversely graded and do not show any preferential orientation of the elements. Thus, it could also be related to a traction carpet, its bimodality resulting from reworking and mixing of two previously sorted upflow deposits.
Bimodal clast-supported facies (Bc) presents characteristics similar to the precedent facies and could result either from the same process (traction carpet) or from longitudinal sorting (Iseya and Ikeda, 1987), in which deposition of the coarse elements is followed by sand infiltration between them.
Open framework facies (O) is characterized by well-sorted unstratified sediments ranging from medium to coarse gravel. It is interpreted as the result of longitudinal sorting (Iseya and Ikeda, 1987).
Stratified Facies (S) granulometry ranges from fine sand to medium gravel. Stratification is clearer in sands where the centimetre-scale bedding thickness, together with small ripples, indicate a lower flow regime associated with deposition from suspension (Leeder, 1999). In sections parallel to the flow, current ripples denote a NE flow direction (Fig. 5b). Below one of the stratified units, a thin indurated silt bed signifies a brief interruption of the flow (Fig. 5a).
Sedimentary Structures
On the transversal outcrop (Fig. 6), the stratification appears slightly concave upward, with an apparent dip of 5° to 20° to the SE. It pinches out laterally forming long lenses 5 to 100 cm thick and 1 to 20 m long. Strata are grouped into six sedimentary sequences bounded by downlap surfaces. The top of the outcrop is a major erosion surface with clear truncation of each sequence.
The longitudinal outcrop (Fig. 7) displays many collapse structures, resulting from dead ice melting: large-wavelength folds, vertical faults (Fig. 8a) and fan-shaped sequences caused by synsedimentary subsidence. At the top of the longitudinal outcrop, high-frequency folds indicate a slight SW-NE compression from glacier shearing. Such ductile sediment deformation suggests water saturation. On the NE side of the outcrop, foresets mark the progression of a dune (Fig. 8b). On the SW side, stratification is stacked in backsets with a thickness of about 3 m and an average dip of 30° (Fig. 9). The backsets lie on an erosion surface and show an alternation of stratified gravel sigmoids and stratified sand layers. The unit is interpreted as a chute-and-pool structure, i.e., backset deposition during high-energy flows where the flow depth increases rapidly (hydraulic jump) and the flow velocity decreases accordingly (Jopling and Richardson, 1966). Such a large chute-and-pool structure is exceptional in the sedimentary record, and the only related example is found in pyroclastic flow deposits (Schmincke et al., 1973, Fig. 5).
Figure 6

a) Le Carré quarry transversal profile showing the SE half of the hill (Fig. 3c). Layers are slightly concave upward. Sedimentary sequences with rapid changes in facies are separated by downlap surfaces (bold lines 1 to 6). Note the major erosional surface at the top of the outcrop, and the absence of sediment deformation below, which is evidence for important hydraulical erosion. b) Portion of the P17 GPR profile located 4 m behind and parallel to the transversal outcrop, allowing comparison between GPR and outcrop data (see text for more details). See legend in Figure 11c.
a) Profil transversal de la carrière du Carré montrant la moitié SE de la colline (fig. 3c). Les couches sont légèrement concaves vers le haut. Les séquences sédimentaires présentent des changements rapides de faciès et sont séparées par des surfaces de discordance (lignes épaisses 1 à 6). Noter la surface d’érosion majeure au sommet de l’affleurement et l’absence de déformation dans les sédiments au-dessous qui indique une forte érosion hydraulique. b) Portion du profil GPR P17 situé parallèlement à l’affleurement transversal, 4 m derrière celui-ci, permettant une comparaison entre les données géoradar et l’affleurement (détails dans le texte). Voir la figure 11c pour la légende.
Figure 7

Le Carré quarry longitudinal profile (Fig. 3c) showing high-amplitude folds from the melting of buried dead ice. On the SW end of the outcrop, note the backset gravel and sand layers of a chute-and-pool structure (see Fig. 9 for details). Flow is from the SW.
 = scree
C&P = chute-and-pool
CF = compressive folds
E = erosion level
F = foresets
SS = synsedimentary subsidence
Profil longitudinal du Carré (fig. 3c) présentant des plis de grande amplitude dus à la fonte de glace morte sous-jacente. À l’extrémité SO de l’affleurement, noter l’empilement en backsets de couches de gravier et de sable dans une structure de chute-and-pool (voir détails dans fig. 9). Le courant vient du SO.
Sedimentological Discussion
Abrupt changes in granulometry and facies, as well as the presence of sedimentary structures ranging from silt beds (stagnant water) to chute-and-pool structures (supercritical flow) indicate strong and rapid variations in sediment supply and/or flow. Chute-and-pool structures, traction carpets and coarse gravel deposits require a very high-energy flow, which cannot result only from gravity. All these observations lead us to interpret the deposits as the infilling of a subglacial closed conduit with a high-energy water pressure gradient in a water-filled conduit (Shreve, 1972). The lack of sediment collapses on the transversal outcrop indicates that the conduit was not englacial but rather subglacial. After the erosional event (see section on erosive events) the ice was inactive and clean, so that the subglacial deposits were not sheared and no melt-out till was deposited.
Figure 8
a

Sub-vertical inverse fault (F) caused by melting of underlying dead ice and/or post-depositional compaction. Labels a to c indicate the same layers on each side of the fault. Flow is out of the page.
Faille inverse sub-verticale due à la fonte de glace morte sous-jacente ou à la compaction après dépôt. Les lettres a à c indiquent les mêmes couches de part et d’autre de la faille. Le courant sort de la page.
b

On the NE side of the longitudinal outcrop, dune foresets overlie a group of tilted layers eroded along boundary L. Flow is toward the NE.
Dans la partie NE de l’affleurement longitudinal, les foresets d’une dune recouvrent un groupe de couches basculées érodées le long de la limite L. Courant vers le NE.
GPR Prospection
Location
Two ground-penetrating radar (GPR) surveys were conducted on the PRLC gravel complex, the first one in the NE just above the Le Carré quarry and the second in the SW on the Praz-Rodet ridge (Fig. 3). GPR lines were oriented parallel or perpendicular to the complex crest in order to optimize the internal structure imaging.
Methods
We used a Mala Geoscience RAMAC system with 100 MHz antennae, which allow a depth of investigation in unsaturated gravel and sand of about 15 m (Davis and Annan, 1989). Walking at an even pace, a trace was acquired every 0.2 second, giving an average trace spacing of 12 cm. Topographic profiles were subsequently acquired with a differential GPS and the traces were distributed evenly along the topographic profiles. Extreme topographic variation of the study site, especially on the NW flank of the Le Carré hill, made walking at an even pace difficult and ultimately caused slight distortions in the GPR images. Common mid-point (CMP) data were recorded at Le Carré (Fig. 3) and gave an average wave velocity of 11.6 cm/ns, which was used in the time-depth conversion. Practical vertical resolution ranges from λ/3 to λ/2 (Trabant, 1984), which yields a value between 40 and 60 cm in our case.
Data processing was similar to that of seismic reflection (Sheriff, 1991), i.e., automatic gain control (window = 50 ns), frequency bandpass filter (10 - 20 - 230 - 280 MHz), traces mixing and phase-shift migration with constant velocity (11.6 cm/ns). The GPR lines were then interpreted with the PC-based software SeisVision using two approaches: structural radar facies analysis (Fig. 10) and identification of radar sequences bounded by downlap surfaces (Beres and Haeni, 1991, Figs. 11-14). Finally, a 3D model was produced with the Kingdom Suite PC-based software by interpolating the major sequence boundaries between lines and visualizing their spatial organization.
Figure 9
a
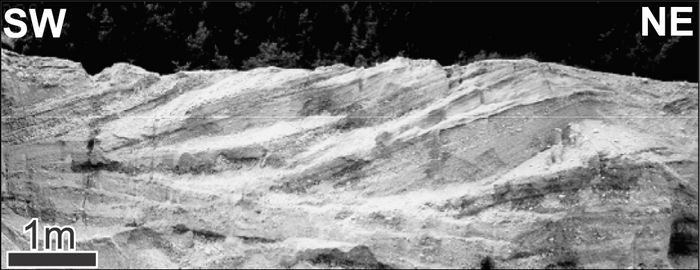
Chute-and-pool structure observed on the SW portion of the longitudinal profile of the quarry
Structure de chute-and-pool observée au SO du profil longitudinal du Carré.
b

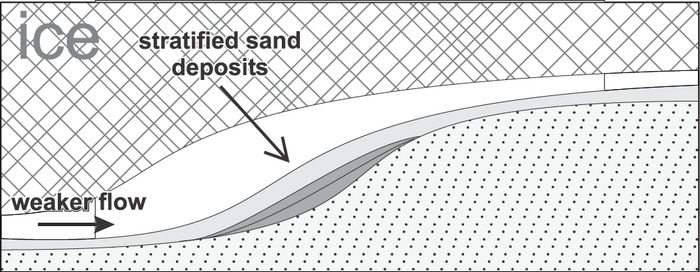
A hydraulic jump resulting from sudden conduit enlargement combined with high flow energy led to the formation of a chute-and-pool structure with deposition of gravel sigmoids in backsets (c).
Un ressaut hydraulique, dû à l’élargissement soudain du conduit combiné à un courant de haute énergie, a amené à la formation d’une structure de chute-and-pool avec dépôt en backsets de sigmoïdes de gravier (c).
c
d
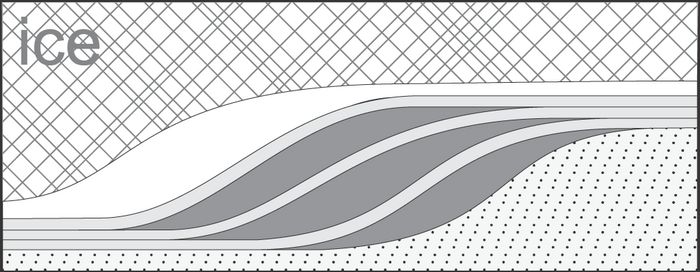
When flow diminished, the chute-and-pool structure was preserved, but stratified sands instead of gravel sigmoids were deposited. Melting of the conduit roof and back stepping of the hydraulic jump allowed the development of the chute-an-pool structure upstream.
Lorsque le courant diminuait, la structure de chute-and-pool était préservée, tandis que se déposaient des sables stratifiés au lieu des sigmoïdes de gravier. La fonte du toit du conduit et le recul du ressaut hydraulique ont permis le développement de la structure de chute-and-pool vers l’amont du courant.
Radar Facies and Artefacts
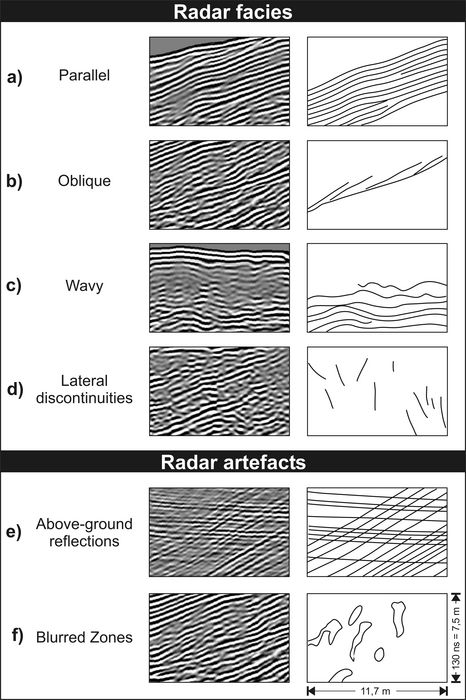
Four main structural radar facies reflection types were identified (Fig. 10).
Parallel: very continuous reflections correspond to the parallel layers of the transversal outcrop (Fig. 6). Their continuity decreases with depth because of the increasing of the signal attenuation.
Oblique: downlapping with a discordance angle between 10° and 30°, they define sedimentary sequences.
Wavy: short-wavelength folds (~1 m) from glacier shearing appear at the top of lines 27 and 28 (Fig. 11). The low signal amplitude results from oblique reflections of the GPR waves from the steep fold flanks. Larger folds and collapses from dead ice melting are also present.
Lateral Discontinuities: many short (~1 m) subvertical faults cause abrupt lateral discontinuities in the reflections. They result from dead ice melting and post-depositional compaction. Some may be artefacts of migration.
GPR-specific artefacts affected portions of the profiles. Because we used unshielded antennae, objects on the ground surface, such as trees, fences or electric lines, produced cross-cutting and hyperbolic reflections on the profiles (Annan, 1992, Fig. 10e). An artefact appearing as small subvertical, slightly curved blurred zones (Fig. 10f) could be due to heterogeneities smaller than the GPR resolution.
GPR Profiles Description and Interpretation
Le Carré (datum = 1 052 m)
Three longitudinal and six transversal profiles were recorded at Le Carré (Fig. 3). The signal penetration of 12 to 15 m allowed the main sequence boundaries (R1 to R8), the top of the diamicton (D) as well as the water table to be traced from one profile to another. The amplitude of the reflector D, corresponding to the contact between the glacio-fluvial deposits and the underlying diamicton, is weak because of signal weakening with depth. The water table appears as a continuous, middle to high amplitude, sub-horizontal reflection cutting through the other reflections. Its high amplitude results from the strong dielectric contrast between dry and wet material (Annan, 1992). On the GPR transversal profiles, the water table appears to outcrop at the bottom of the NW flank of the hill (Figs. 12 and 13). A saturated boggy zone in this area confirms our interpretation.
On the longitudinal profile P28 (Fig. 11a), located below the crest of the hill, reflections are stacked in backsets with downlapping terminations and dipping at 20° to 25°. This package is 10 m thick and interpreted as a huge chute-and-pool structure at the centre of the conduit. On the longitudinal profile P27 (Fig. 11b), located on the SE flank of the hill, backsets also appear on the SW part of the profile, but with a lower dip angle (10°) than that of P28. On the NE part of the profile, foresets (25° dip) indicate downflow accretion.
Figure 10
Radar structural facies and artefacts; see text for details.
Géoradar : faciès structuraux et artefacts. Voir détails dans le texte.
The transversal profiles are similar, so only two of them are presented here: P17 (Fig. 12) and P20 (Fig. 13). Both profiles cross the main hill in the SE, traverse a small boggy depression and terminate on a small mound in the NW. The top of the diamicton mimics the surface topography. Stratified gravel and sand span the whole length of the profiles but their thickness decreases toward the sides of the hill. On the SE part of the profiles, the reflection pattern correlates with structures observed in the transversal outcrop: a downlap accretion of sedimentary sequences toward the SE (Fig. 6). The NW part of the profiles shows less continuous reflections representing many faults, folds and small collapses, which are the result of dead ice melting. The sudden dip increase from the crest of the hill towards the NW suggests that the entire NW flank of the hill was affected by a large collapse. This collapse may be the result of the melting of a large volume of dead ice that was buried at the base of the deposit. Since each layer indicates collapse characteristics, melting must have been contemporaneous and/or subsequent to the deposition. The isolation of this ice volume was probably due to a high sedimentation rate during lateral migration of the subglacial conduit.
Profile P17 and the transversal outcrop are parallel and only 4 m apart (Figs. 3, 11b). Comparison of these (Fig. 6) shows the same sequences but with slight differences in depth and thickness. These differences are due to the dip of the layers toward the NE (Fig. 11b) and the abrupt longitudinal variations of the layers’ thickness. Since the vertical resolution of P17 is estimated to be between 40 and 60 cm and many layers observed in the outcrop are thinner than this, a single reflection may represent several thin lithologic layers.
Praz-Rodet (datum = 1 064 m)
Seven profiles were recorded at Praz-Rodet. Data quality is lower than that of the Le Carré profiles because of interference from the numerous trees and the poor reception of the GPS. Weak penetration (~ 5 m) is attributed to signal diffractions by boulders similar to those observed in the field. The multi-decimetrical boulder size and the decrease in conduit width in this area could indicate a stronger water flow than in Le Carré. On the transversal profiles (Fig. 14a), layers sub-parallel to the surface and their truncation at a low angle are consistent with our interpretation of deposition in a subglacial conduit followed by an erosional flood.
Discussion
Chute-and-Pool Macroform
The GPR data indicate backset accretion at the centre of the conduit, which we interpret as a large chute-and-pool structure (Figs. 11, 15a). As mentioned earlier, such structures originate from a rapid downflow increase of the water depth (Jopling and Richardson, 1966). In a subaerial fluvial environment, the water depth depends on discharge and topographical variations of the bed, but in a closed, full conduit, it depends on the total height of the conduit (McDonald and Vincent, 1972). In our case, the hydraulic jump is likely related to a sudden increase in the conduit roof elevation (Fig. 9b). With the size of the chute-and-pool similar to that of the conduit, it can be regarded as a macroform (Hoey, 1992; Brennand and Shaw, 1996). Backsets and foresets on the longitudinal profiles (Fig. 11) indicate simultaneous migration of the macroform upflow and downflow, probably with a large cavity at the front and another at the back.
McDonald and Vincent (1972) experimented with the formation of sedimentary structures by using a closed pipe full of water to simulate subglacial conduit conditions. No chute-and-pool structures were formed in their study because the pipe had no irregularities. In real subglacial conduits, however, variations in conduit width are frequent. Given the absence of large-scale chute-and-pool structures in subaerial fluvial sediments, we consider this macroform as a diagnostic feature of a subglacial conduit.
Figure 11
a
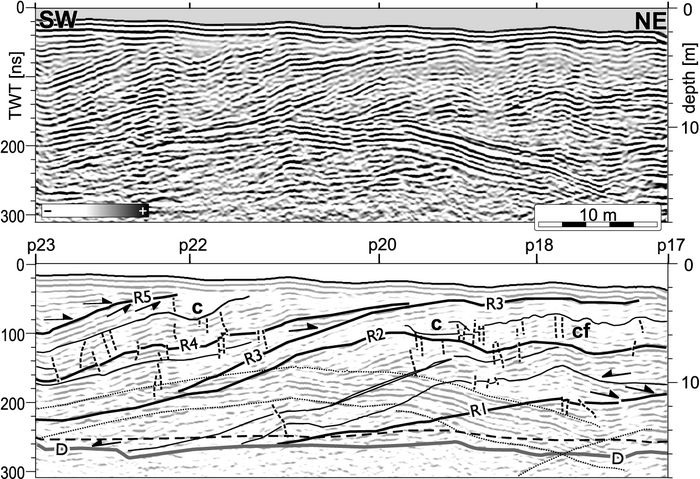
Le Carré GPR longitudinal profile P28 showing backset accretion in a chute-and-pool structure (flow from SW). The group of parallel, convex-upward reflections in the centre of the profile are artefacts from nearby trees. Note the erosion level at the top, the small faults due to dead ice melting and the compression folds (cf) due to small ice movements.
Profil géoradar longitudinal P28 du Carré, présentant une accrétion en backsets dans une structure de chute-and-pool. Le courant vient du SO. Les réflexions parallèles, convexes vers le haut, au centre du profil, sont des artefacts provenant des arbres alentours. Noter le niveau érosif au sommet, les petites failles dues à la fonte de glace morte et les plis compressifs (cf) dus à de légers mouvements de la glace.
b

Le Carré P27 longitudinal profile showing backset accretion on the SW part and foreset accretion on the NE part. On the NE side of the profile, major reflections were extrapolated to the quarry transverse section.
Profil longitudinal P27 du Carré présentant une accrétion en backsets dans sa partie SO et une accrétion en foresets dans sa partie NE. Sur le côté NE du profil, les réflexions principales ont été prolongées jusqu’à la section transversale de la carrière.
Legend for GPR profile interpretation.
![]() sequence boundaries
sequence boundaries
![]() secondary reflection
secondary reflection
![]() diamict top
diamict top
![]() water table
water table
![]() fault
fault
![]() reflection termination
reflection termination
m multiple
c collapse
cf compression folds
Légende pour l’interprétation des profils GPR.
Sedimentary Sequences
Each sedimentary sequence marks a widening of the conduit, which results from melting ice walls faster than closure by plastic flow. In subglacial conduits, this melting is caused by frictional heat that increases with flow power. Sedimentary sequences, therefore, mark periodical increase in flow. Though it is hard to establish the origin of these major flow variations, we suggest two possible processes: i) the periodical closing of a portion of the conduit upflow with meltwater accumulating in a subglacial chamber until it is rapidly drained by a local pressure-related uplifting of the ice, ii) a complex interaction among flow power, conduit geometry and macroform geometry evidenced by the direct relationship between the macroform and the conduit size (Hoey, 1992).
Within each sequence, the stratification indicates rapid flow variations. These variations are not cyclic and, hence, not related to daily melting cycles. As with the sedimentary sequences, these variations may be due to the interaction among flow power, conduit geometry, macroform geometry and sediment deposition. In addition, high-velocity flow generates significant turbulence and flow separations, and sediment reworking can contribute to the creation of numerous different facies.
Figure 12

Le Carré GPR transversal profile P17. The SE flank of the hill shows GPR sequences well bounded by downlap surfaces, while the NW flank of the hill displays numerous faults, folds and collapse structures resulting from dead ice melting. Artefacts are due to nearby fences. See text for more details and Figure 11c for legend.
Profil géoradar transversal P17 du Carré. Le flanc SE de la colline présente des séquences radar clairement délimitées par des surfaces de downlap, tandis que le flanc NO de la colline présente de nombreux plis, failles et effondrements dus à la fonte de glace morte. Les artefacts proviennent des clôtures alentours. Voir détails dans le texte et la figure 11c pour la légende.
Figure 13

Le Carré GPR transversal profile P20 showing the water table as an horizontal reflection cutting across the other reflections. The outcropping of the water table in the topographically low area in the NW part of the profile corresponds to a saturated boggy zone encountered in the field. The clay accumulation in this boggy zone prevented deep penetration of the GPR waves. See Figure 11c for legend.
Profil géoradar transversal P20 du Carré où l’on voit le réflecteur horizontal de la nappe phréatique couper à travers les autres réflecteurs. L’intersection de la nappe phréatique avec la surface dans la dépression topographique au NO du profil correspond à une zone marécageuse saturée sur le terrain. L’accumulation d’argile dans cette zone marécageuse a fait écran aux ondes radar. Voir la figure 11c pour la légende.
Without signs of any extended flow interruptions (e.g., no internal erosion boundary or till deposition), the PRLC deposits are probably the result of one annual melting cycle, i.e., only one summer. The high sedimentation rate of chute-and-pool structures (Jopling and Richardson, 1966) is consistent with this interpretation.
Erosive Events
As the infilling of the conduit was contemporaneous with its formation and as the ice was close to the sediments, we can consider the picked GPR horizons as early boundaries of the conduit before erosion. In the 3D model (Fig. 15), reflection R2 represents one of these early boundaries that was slightly deformed by melting dead ice. It can be seen that the original conduit morphology resembled an esker morphology: flanks were steep and the crest in plan view was slightly bowed. In the field, the Praz-Rodet part of the PRLC complex, which was less eroded maybe due to its coarser composition, still displays this pre-erosional morphology. The present morphology is the result of a major erosive event that could be attributed to ice shearing, if it were not for the lack of sediment deformation below the erosion surface. In a subglacial environment, the only feasible erosive agent other than ice is water. It is probable, therefore, that erosion was the result of a jökulhlaup, i.e., a major glacial meltwater flood resulting from the rapid draining of a subglacial or supra-glacial lake (e.g., Maizels, 1989). Such an event is thought to be responsible for the drumlin-like shape or the PRLC complex at its NE part. Similar erosive action also may be responsible for the formation of the sand and gravel drumlins in the Joux Valley. A small outcrop on one of these drumlins shows a similar erosion surface cutting sand and gravel layers. Like the PRLC complex, these sand and gravel drumlins could be the result of sediment deposition in a subglacial conduit followed by a major jökulhlaup. The spatial and temporal organization of these subglacial conduits prior to erosion is difficult to reconstruct from the remnants: were they all deposited at the same time? If so, were they connected? We are unable to answer these questions but extrapolating our observations on the PRLC complex would indicate a network of eskers with variable widths and heights (Fig. 16c). It is not likely that the jökulhlaup was followed by ice shearing because, at the end of the Würmian glaciation, the closed-basin geometry of the Joux Valley prevented ice from flowing away (Aubert, 1943), and only dead ice remained in the valley.
Figure 14
a

Praz-Rodet transversal profile P50, showing above-ground reflections from nearby trees (dotted hyperbolae) and sub-surface reflections, which are sub-parallel to the ground surface, and deformed by melting dead ice.
Profil transversal P50 de Praz-Rodet, présentant des artefacts provenant des arbres alentours (hyperboles en pointillés) et des réflexions souterraines sub-parallèles à la surface du sol et déformées par la fonte de glace morte sous-jacente.
b
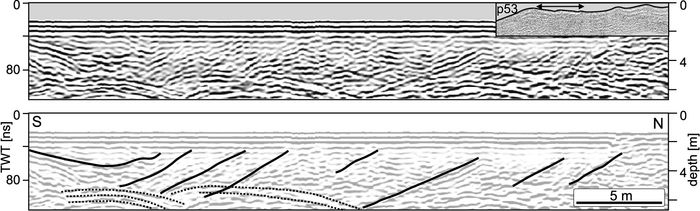
Portion of Praz-Rodet longitudinal profile P53 before topographic correction. Sub-surface reflections represent a backset disposition and could be part of a chute-and-pool structure, as in Le Carré. Note the clear erosional boundary at the ground surface. Flow is from S to N. See Figure 11c for legend.
Portion du profil longitudinal P53 de Praz-Rodet avant la correction topographique. Les réflexions souterraines représentent une accrétion en backsets faisant peut-être partie d’une structure de chute-and-pool, comme au Carré. Noter la limite d’érosion très nette à la surface. Courant du S vers le N. Voir figure 11c pour la légende.
Figure 15
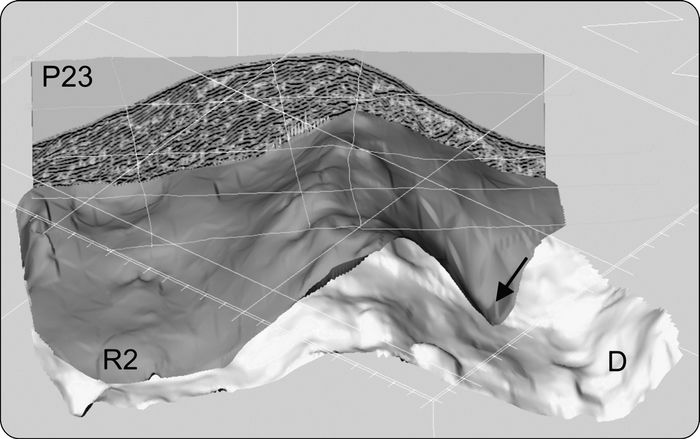
3D representation of two well-defined Le Carré GPR horizons and transversal profile P23. Note the difference in morphology between the radar sequence boundary R2, which represents the conduit at one stage of its development and the present topography, which is an erosional surface similar to the till erosional surface (D). Arrow indicates a collapse from melting dead ice.
Représentation 3D de deux horizons géoradar du Carré et du profil P23. Noter la différence de morphologie entre la limite de séquences R2, qui représente une étape du développement du conduit, et la topographie actuelle, qui est une surface d’érosion similaire à la surface d’érosion du till (D). La flèche indique un effondrement dû à la fonte de glace morte.
The GPR data reveal that the PRLC deposits rest on an elongated till hill (Figs. 12, 13, 15) that is similar to the till-drumlins in the valley. The origin of drumlins is still a subject of dispute. The classical view that drumlins result from substratum deformation and/or erosion by flowing ice (e.g., Boulton, 1987) conflicts with the more recent hypothesis that they form by subglacial sheet floods (e.g., Shaw, 1983; Shaw and Gilbert, 1990) from the draining of large subglacial lakes (Shoemaker, 1992). In addition to the abundant hydraulic-erosion features observed in North America (e.g., Shaw, 2002), our interpretation of drumlin formation by a large jökulhlaup supports the latter theory. The Joux Valley geometry forced canalisation of flow, which led to jökulhlaups with high erosional power. It is possible that the Joux Valley till-drumlins are the result of such hydraulical erosion, but more observations are necessary to confirm their origin.
Conclusions
The closed basin geometry of the Joux Valley led to the accumulation of a large volume of dead ice, which allowed significant preservation of the subglacial features formed after the glacier had become inactive. On the basis of the sedimentological, geomorphological and GPR investigations of these deposits, we propose the following subglacial sequence of events (Fig. 16):
Till deposition by flowing ice.
Formation of the till-drumlins (maybe by one or several jökulhlaups?).
End of ice movement and formation of eskers filled with sand and gravel under inactive ice.
Erosion of the sand and gravel deposits by a jökulhlaup or a number of jökulhlaups, leading to the formation of gravel-drumlins.
Final melting of ice and alluvial deposition from the present river.
Figure 16
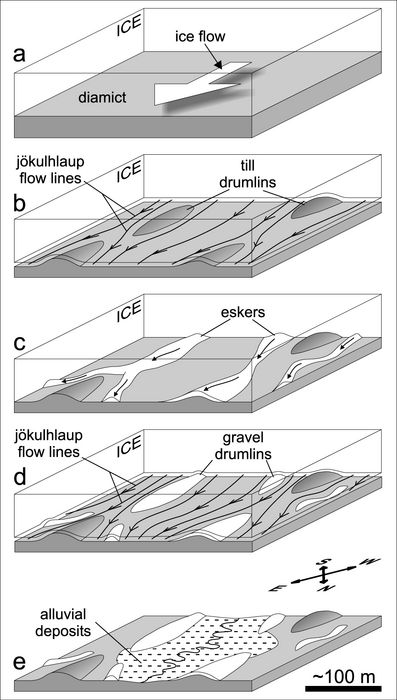
Proposed subglacial history for the Joux Valley during late Würmian time. See text for explanation.
Proposition d’évolution sous-glaciaire pour la vallée de Joux durant la fin de l’ère würmienne. Se référer au texte pour les explications.
This new contribution to the interpretation of the Joux Valley glacial features demonstrates the importance of meltwater in sedimentological processes under the Jura ice-sheet during the Würmian glaciation.
GPR proved to be an excellent tool for the study of subglacial sand and gravel. Its deep penetration and high resolution allowed us to map their internal structure as well as their substratum geometry.
Chute-and-pool structures observed in deposits from subglacial conduits can reach heights of several meters and appear to be typical features of subglacial water circulation. Their formation is the result of very high velocity flows and sudden conduit enlargement.
Parties annexes
Aknowledgments
We thank Pierre-Michel Bruder for his help during GPR acquisition, Michael Jenkins for the editing of the paper prior to submission and John Shaw, an anonymous reviewer and Michel Allard for their helpful review of the manuscript. We also thank the Institute of Geophysics at the University of Lausanne for lending us their RAMAC GPR system from Mala Geoscience. Interpretation and 3D representation were performed respectively with the Seisvision software from Landmark GeoGraphix and the Kingdom Suite software from Seismic Micro Technologies Inc. This study was partly supported by the Swiss National Science Foundation (grant number 20-68091.02).
References
- Annan, A.P., 1992. Ground Penetrating Radar Workshop Notes. Sensors and Software Inc., Mississauga, 128 p.
- Aubert, D., 1943. Monographie géologique de la Vallée de Joux (Jura vaudois). Matériaux pour la Carte géologique de la Suisse, 78 (nouvelle série), Commission géologique de la Société helvétique des Sciences naturelles, Berne, 134 p.
- ____ 1959. Le décrochement de Pontarlier et l’orogenèse du Jura. Mémoire de la Société vaudoise des Sciences naturelles, 12 : 93-152.
- Beres, M. and Haeni, F.P., 1991. Application of ground-penetrating-radar methods in hydrogeologic studies. Ground Water, 29: 375-386.
- Boulton, G.S., 1987. A theory of drumlin formation by subglacial sediment deformation, p. 25-80. In J. Menzies and J. Rose, eds, Drumlin Symposium. Balkema, Rotterdam, 360 p.
- Brennand, T.A. and Shaw, J., 1996. The Harricana glaciofluvial complex, Abitibi region, Quebec: its genesis and implications for meltwater regime and ice-sheet dynamics. Sedimentary Geology, 102: 221-262.
- Campy, M., 1992. Paleogeographical relationships between Alpine and Jura glaciers during the two last Pleistocene glaciations. Palaeogeography, Palaeoclimatology, Palaeoecology, 93: 1-12.
- CSD, 1996. Rapport géotechnique: Commune du Chenit, gravière des “Champs sous la Côte”, Analyse géologique et hydrogéologique, CSD, Lausanne, 39 p.
- Davis, J.L. and A.P. Annan, 1989. Ground-penetrating radar for high-resolution mapping of soil and rock stratigraphy. Geophysical Prospecting, 37: 531-551.
- Hoey, T., 1992. Temporal variations in bedload transport rates and sediment storage in gravel-bed rivers. Progress in Physical Geography, 16: 319-338.
- Iseya, F. and Ikeda, H., 1987. Pulsations in bedload transport rates induced by a longitudinal sediment sorting: A flume study using sand and gravel mixtures. Geografiska Annaler, 69A: 15-27.
- Jopling, A.V. and Richardson, E.V., 1966. Backset bedding developed in shooting flow in laboratory experiments. Journal of Sedimentary Petrology, 36: 821-825.
- Leeder, M., 1999. Sedimentology and Sedimentary Basins: From Turbulence to Tectonics. Blackwell Science, Oxford, 592 p.
- Maizels, J., 1989. Sedimentology, paleoflow dynamics and flood history of jokulhlaup deposits; paleohydrology of Holocene sediment sequences in southern Iceland sandur deposits. Journal of Sedimentary Petrology, 59: 204-223.
- McDonald, B.C. and Vincent, J.C., 1972. Fluvial sedimentary structures formed experimentally in a pipe, and their implications for interpretation of subglacial sedimentary environments. Geological Survey of Canada, Paper 72-27, 30 p.
- Menzies, J.R., 1979. A review of the literature on the formation and location of drumlins. Earth Science Reviews, 14: 315-359.
- ____ 1989. Subglacial bedforms – an introduction. Sedimentary Geology, 62: 117-122.
- Schminke, H.-U., Fisher R.V. and Waters, A.C., 1973. Antidune and chute and pool structures in the base surge deposits of the Laacher See area, Germany. Sedimentology, 20: 553-574.
- Shaw, J., 1983. Drumlins formation related to inverted meltwater erosional marks. Journal of Glaciology, 29: 461-479.
- ____ 2002. The meltwater hypothesis for subglacial bedforms. Quaternary International, 90: 5-22.
- Shaw, J. and Gilbert, G., 1990. Evidence for large-scale subglacial meltwater flood events in southern Ontario and northern New York State. Geology, 18: 1169-1172.
- Sheriff, R.E., 1991. Encyclopedic Dictionary of Exploration Geophysics. 3rd edition, SEG Geophysical References Series 1, Tulsa, 384 p.
- Shoemaker, E.M., 1992. Water sheets outburst floods from the Laurentide Ice Sheet. Canadian Journal of Earth Sciences, 29: 1250-1264.
- Shreve, R.L., 1972. Movement of water in glaciers. Journal of Glaciology, 11: 205-214.
- Sohn, Y.K., 1997. On traction-carpet sedimentation. Journal of Sedimentary Research, 67: 502-509.
- Trabant, P.K., 1984. Applied High-Resolution geophysical methods. International Human Resources Development Corporation, Boston, 103 p.
Liste des figures
Figure 1
Location map of the Joux Valley (Vaud, Switzerland). In the upper inset, the hatched zone represents the maximum extent of the Jura ice sheet during the Würmian glaciation (after Campy, 1992). The NE portion of main map shows the N-S Pontarlier strike-slip fault, which displaced Dent de Vaulion Mountain towards the axis of the Joux synclinorium and closed the valley.
Situation géographique de la vallée de Joux (Vaud, Suisse). Sur la carte de la Suisse, la zone hachurée représente l’extension maximale de la calotte jurassienne durant la glaciation würmienne (d’après Campy, 1992). Sur la partie NE de la carte principale, noter le décrochement de Pontarlier, d’orientation N-S, qui a amené la Dent de Vaulion dans l’axe du synclinorium de la vallée de Joux. Cette cassure fait de la vallée de Joux un bassin fermé.
Figure 2
Geomorphological map based on aerial photographs and topographical maps, showing drumlins covering the valley bottom. Note their sub-parallel orientation and variable composition. Some are amalgamated (a) and others are divided (d) by postglacial rivers. Q = Le Carré quarry, M = frontal moraine. See Fig. 1 for location. Swiss coordinates.
= drumlin or drumlinoid (internal line indicates the crest)
Composition:
diamict
gravel and sand
unknown
Carte géomorphologique montrant les drumlins du fond de la vallée de Joux, réalisée à partir de photographies aériennes et de la carte topographique à 1/25 000. Noter l’orientation sub-parallèle des drumlins et leur composition variable. Certains sont amalgamés (a), d’autres sont divisés par des cours d’eau postglaciaires (d). Q = carrière du Carré, M = moraine frontale. Voir figure 1 pour la localisation. Coordonnées suisses.
Figure 3
a) Location of the Le Carré quarry and the two GPR surveys on the PRLC complex. (Base map reprinted with the authorization of the Federal Office of Topography, Switzerland - BA013799.) b) Praz-Rodet GPR lines and a shaded gray representation of a local Digital Elevation Model (based on GPS data) showing the sharpness of this part of the PRLC complex (light source from the NW). c) Detail of Le Carré GPR lines and Le Carré quarry location. Swiss coordinates.
a) Localisation de la carrière du Carré et des deux campagnes géoradar sur le complexe de PRLC. (Carte de base reproduite avec l’autorisation de l’Office fédéral de la Topographie, en Suisse - BA013799.) b) Tracé des lignes géoradar de Praz-Rodet superposé à une représentation ombrée d’un Modèle Numérique d’Altitude (réalisé à partir de données GPS) montrant les flancs raides de cette partie du complexe de PRLC. c) Tracé des lignes géoradar du Carré et situation de la carrière. Coordonnées suisses.
a
Alternation of stratified sands (S) and polymodal gravels (P). The layers’ flexure is due to post-depositional compaction.
Alternance de sables stratifiés (S) et de graviers polymodaux (P). La flexure des couches est due à la compaction après dépôt.
b
Transition between different facies. Trowel is 30 cm long. P = polymodal; Bm / Bc = bimodal, matrix/clast supported; O = open framework.
Transition entre différents faciès. La truelle mesure 30 cm. P = polymodal ; Bm / Bc = bimodal non jointif/jointif ; O = sans matrice.
Massive sedimentary facies from the quarry transversal outcrop (Fig. 3c).
Faciès sédimentaires de l’affleurement transversal de la carrière (fig. 3c).
a
Stratified sands between polymodal gravels. Flow is out of the page. Below the sands, a thin indurated silt bed indicates a brief interruption of the flow. Swiss knife is 20 cm high.
Sables stratifiés entre des graviers polymodaux. Le courant sort de la page. Sous les sables, un fin niveau limoneux induré indique un bref arrêt du courant. Le couteau suisse mesure 20 cm.
b
Flow-parallel section in stratified sands with current ripples (r) indicating a flow toward the NE. Note the dropstones (d). Pen is 20 cm high.
Section parallèle au courant dans des sables stratifiés avec des rides de courant (r) indiquant un courant vers le NE. Noter les galets relâchés (d). Le stylo mesure 20 cm.
Stratified facies from the quarry transversal outcrop (Fig. 3c).
Faciès stratifiés de l’affleurement transversal de la carrière (fig. 3c).
Figure 6
a) Le Carré quarry transversal profile showing the SE half of the hill (Fig. 3c). Layers are slightly concave upward. Sedimentary sequences with rapid changes in facies are separated by downlap surfaces (bold lines 1 to 6). Note the major erosional surface at the top of the outcrop, and the absence of sediment deformation below, which is evidence for important hydraulical erosion. b) Portion of the P17 GPR profile located 4 m behind and parallel to the transversal outcrop, allowing comparison between GPR and outcrop data (see text for more details). See legend in Figure 11c.
a) Profil transversal de la carrière du Carré montrant la moitié SE de la colline (fig. 3c). Les couches sont légèrement concaves vers le haut. Les séquences sédimentaires présentent des changements rapides de faciès et sont séparées par des surfaces de discordance (lignes épaisses 1 à 6). Noter la surface d’érosion majeure au sommet de l’affleurement et l’absence de déformation dans les sédiments au-dessous qui indique une forte érosion hydraulique. b) Portion du profil GPR P17 situé parallèlement à l’affleurement transversal, 4 m derrière celui-ci, permettant une comparaison entre les données géoradar et l’affleurement (détails dans le texte). Voir la figure 11c pour la légende.
Figure 7
Le Carré quarry longitudinal profile (Fig. 3c) showing high-amplitude folds from the melting of buried dead ice. On the SW end of the outcrop, note the backset gravel and sand layers of a chute-and-pool structure (see Fig. 9 for details). Flow is from the SW.
= scree
C&P = chute-and-pool
CF = compressive folds
E = erosion level
F = foresets
SS = synsedimentary subsidence
Profil longitudinal du Carré (fig. 3c) présentant des plis de grande amplitude dus à la fonte de glace morte sous-jacente. À l’extrémité SO de l’affleurement, noter l’empilement en backsets de couches de gravier et de sable dans une structure de chute-and-pool (voir détails dans fig. 9). Le courant vient du SO.
a
Sub-vertical inverse fault (F) caused by melting of underlying dead ice and/or post-depositional compaction. Labels a to c indicate the same layers on each side of the fault. Flow is out of the page.
Faille inverse sub-verticale due à la fonte de glace morte sous-jacente ou à la compaction après dépôt. Les lettres a à c indiquent les mêmes couches de part et d’autre de la faille. Le courant sort de la page.
b
On the NE side of the longitudinal outcrop, dune foresets overlie a group of tilted layers eroded along boundary L. Flow is toward the NE.
Dans la partie NE de l’affleurement longitudinal, les foresets d’une dune recouvrent un groupe de couches basculées érodées le long de la limite L. Courant vers le NE.
a
Chute-and-pool structure observed on the SW portion of the longitudinal profile of the quarry
Structure de chute-and-pool observée au SO du profil longitudinal du Carré.
b
A hydraulic jump resulting from sudden conduit enlargement combined with high flow energy led to the formation of a chute-and-pool structure with deposition of gravel sigmoids in backsets (c).
Un ressaut hydraulique, dû à l’élargissement soudain du conduit combiné à un courant de haute énergie, a amené à la formation d’une structure de chute-and-pool avec dépôt en backsets de sigmoïdes de gravier (c).
c
d
When flow diminished, the chute-and-pool structure was preserved, but stratified sands instead of gravel sigmoids were deposited. Melting of the conduit roof and back stepping of the hydraulic jump allowed the development of the chute-an-pool structure upstream.
Lorsque le courant diminuait, la structure de chute-and-pool était préservée, tandis que se déposaient des sables stratifiés au lieu des sigmoïdes de gravier. La fonte du toit du conduit et le recul du ressaut hydraulique ont permis le développement de la structure de chute-and-pool vers l’amont du courant.
Figure 10
Radar structural facies and artefacts; see text for details.
Géoradar : faciès structuraux et artefacts. Voir détails dans le texte.
a
Le Carré GPR longitudinal profile P28 showing backset accretion in a chute-and-pool structure (flow from SW). The group of parallel, convex-upward reflections in the centre of the profile are artefacts from nearby trees. Note the erosion level at the top, the small faults due to dead ice melting and the compression folds (cf) due to small ice movements.
Profil géoradar longitudinal P28 du Carré, présentant une accrétion en backsets dans une structure de chute-and-pool. Le courant vient du SO. Les réflexions parallèles, convexes vers le haut, au centre du profil, sont des artefacts provenant des arbres alentours. Noter le niveau érosif au sommet, les petites failles dues à la fonte de glace morte et les plis compressifs (cf) dus à de légers mouvements de la glace.
b
Le Carré P27 longitudinal profile showing backset accretion on the SW part and foreset accretion on the NE part. On the NE side of the profile, major reflections were extrapolated to the quarry transverse section.
Profil longitudinal P27 du Carré présentant une accrétion en backsets dans sa partie SO et une accrétion en foresets dans sa partie NE. Sur le côté NE du profil, les réflexions principales ont été prolongées jusqu’à la section transversale de la carrière.
Legend for GPR profile interpretation.
![]() sequence boundaries
sequence boundaries
![]() secondary reflection
secondary reflection
![]() diamict top
diamict top
![]() water table
water table
![]() fault
fault
![]() reflection termination
reflection termination
m multiple
c collapse
cf compression folds
Légende pour l’interprétation des profils GPR.
Figure 12
Le Carré GPR transversal profile P17. The SE flank of the hill shows GPR sequences well bounded by downlap surfaces, while the NW flank of the hill displays numerous faults, folds and collapse structures resulting from dead ice melting. Artefacts are due to nearby fences. See text for more details and Figure 11c for legend.
Profil géoradar transversal P17 du Carré. Le flanc SE de la colline présente des séquences radar clairement délimitées par des surfaces de downlap, tandis que le flanc NO de la colline présente de nombreux plis, failles et effondrements dus à la fonte de glace morte. Les artefacts proviennent des clôtures alentours. Voir détails dans le texte et la figure 11c pour la légende.
Figure 13
Le Carré GPR transversal profile P20 showing the water table as an horizontal reflection cutting across the other reflections. The outcropping of the water table in the topographically low area in the NW part of the profile corresponds to a saturated boggy zone encountered in the field. The clay accumulation in this boggy zone prevented deep penetration of the GPR waves. See Figure 11c for legend.
Profil géoradar transversal P20 du Carré où l’on voit le réflecteur horizontal de la nappe phréatique couper à travers les autres réflecteurs. L’intersection de la nappe phréatique avec la surface dans la dépression topographique au NO du profil correspond à une zone marécageuse saturée sur le terrain. L’accumulation d’argile dans cette zone marécageuse a fait écran aux ondes radar. Voir la figure 11c pour la légende.
a
Praz-Rodet transversal profile P50, showing above-ground reflections from nearby trees (dotted hyperbolae) and sub-surface reflections, which are sub-parallel to the ground surface, and deformed by melting dead ice.
Profil transversal P50 de Praz-Rodet, présentant des artefacts provenant des arbres alentours (hyperboles en pointillés) et des réflexions souterraines sub-parallèles à la surface du sol et déformées par la fonte de glace morte sous-jacente.
b
Portion of Praz-Rodet longitudinal profile P53 before topographic correction. Sub-surface reflections represent a backset disposition and could be part of a chute-and-pool structure, as in Le Carré. Note the clear erosional boundary at the ground surface. Flow is from S to N. See Figure 11c for legend.
Portion du profil longitudinal P53 de Praz-Rodet avant la correction topographique. Les réflexions souterraines représentent une accrétion en backsets faisant peut-être partie d’une structure de chute-and-pool, comme au Carré. Noter la limite d’érosion très nette à la surface. Courant du S vers le N. Voir figure 11c pour la légende.
Figure 15
3D representation of two well-defined Le Carré GPR horizons and transversal profile P23. Note the difference in morphology between the radar sequence boundary R2, which represents the conduit at one stage of its development and the present topography, which is an erosional surface similar to the till erosional surface (D). Arrow indicates a collapse from melting dead ice.
Représentation 3D de deux horizons géoradar du Carré et du profil P23. Noter la différence de morphologie entre la limite de séquences R2, qui représente une étape du développement du conduit, et la topographie actuelle, qui est une surface d’érosion similaire à la surface d’érosion du till (D). La flèche indique un effondrement dû à la fonte de glace morte.
Figure 16
Proposed subglacial history for the Joux Valley during late Würmian time. See text for explanation.
Proposition d’évolution sous-glaciaire pour la vallée de Joux durant la fin de l’ère würmienne. Se référer au texte pour les explications.