
Résumés
Abstract
This study focuses on the effectiveness of the federal Employment Equity Act (EEA). We assess the EEA with regard to visible minority (VM) employees using quantitative data from employer reports published under the provisions of the EEA and the Canadian Census. Data in this study cover the period 1987 to 1999. We find that large companies, and larger employment groups within companies, have higher levels of employment equity attainment. There are also considerable variations in employment equity attainment across industrial sectors, across provinces and across occupations. Overall, there has been general improvement in employment equity (EE) attainment over time. However, visible minorities continue to be disadvantaged in management, sales and service and technical positions. Several policy implications are drawn from these findings.
Résumé
Cette étude s’intéresse à l’efficacité de la législation sur l’équité en emploi. Nous évaluons cette loi visant les travailleurs de la minorité visible en faisant appel à des données quantitatives qu’on retrouve dans les rapports des employeurs publiés en application des dispositions de la législation et à celles tirées du recensement canadien. Ces données couvrent la période 1987-1999.
Notre étude porte sur la relation entre le degré d’atteinte de l’équité en emploi eu égard aux minorités visibles sous la législation et une gamme de facteurs contextuels. On y présente des conclusions importantes et nombreuses.
En premier lieu, tel que prévu, les plus grandes entreprises et les groupes occupationnels les plus importants présentent des niveaux plus élevés d’atteinte de l’équité en emploi. On peut attribuer ce fait à la taille en relation avec la visibilité des organisations et à la disponibilité de ressources plus abondantes pour rencontrer des objectifs d’équité.
En deuxième lieu, il y a beaucoup de variation entre les secteurs industriels en termes d’atteinte de l’équité; le secteur bancaire présentant des niveaux les plus élevés, ce que nous avions anticipé. Encore là, on peut attribuer cela à la visibilité des banques et au fait que le secteur bancaire ne présente pas les mêmes pressions concurrentielles qu’on observe dans les secteurs des communications et des transports. Alors les banques ont plutôt des ressources en surplus qu’elles peuvent allouer au support des efforts exigés par la loi et peut-être qu’elles sont, à cause de leur taille, plus sensibles à la surveillance des organismes de régulation.
En troisième lieu, on observe également une variation importante d’une province à une autre en termes de degré d’atteinte de l’équité, avec des niveaux, à notre grande surprise, remarquablement faibles dans les provinces où on retrouve les plus fortes concentrations de minorités visibles (par exemple, l’Ontario et la Colombie-Britannique). Il s’agit là d’un résultat que nous n’avions pas anticipé. Peut-être cela est-il dû au grand nombre d’immigrants résidant dans ces provinces au cours des dernières années, de sorte qu’on a pu constater la présence d’un nombre disproportionné de personnes ayant des aptitudes limitées au plan du langage et au plan de la création de liens avec la communauté plus large. Des groupes de minorités visibles dans les autres provinces ont pu s’intégrer à des communautés mieux établies et ainsi obtenir un accès plus grand aux entreprises en vertu d’une assimilation plus prononcée. De plus, le nombre de minorités visibles de ces provinces est tout à fait minime, de sorte que les entreprises n’ont eu qu’à faire des efforts limités pour atteindre des niveaux respectables d’équité.
En quatrième lieu, nos données indiquent une amélioration générale avec le temps au plan de l’atteinte des objectifs de la législation, qui serait concordante avec l’efficacité de cette même législation.
En cinquième lieu, il n’y a pas d’indication claire à l’effet que les minorités visibles sont surreprésentées dans le marché du travail secondaire. Enfin, nous avons constaté que le degré de réalisation des objectifs de la loi varie considérablement d’une occupation à une autre. Les minorités visibles sont particulièrement désavantagées dans les positions de gérance, de professionnels et de représentants commerciaux, tout comme dans les emplois manuels spécialisés.
Plusieurs implications tant d’ordre politique que pratique découlent de ces observations, ce qui inclut une intervention accrue de la part de la Commission canadienne des droits de la personne, une plus grande préoccupation à l’égard des iniquités occupationnelles et des disparités sectorielles, de la taille des entreprises et du groupe d’emploi :
Les employés appartenant à des minorités visibles dans les entreprises assujetties à la Loi sur l’équité en emploi sont toujours sous représentés de façon significative. Il existe un nombre relativement imposant de cas où la représentation des minorités visibles est extrêmement faible, voire même inexistante. C’est pourquoi il apparaît évident qu’une application intensifiée et sévère de la loi en faveur du groupe des minorités visibles est nécessaire de la part de la Commission canadienne des droits de la personne.
Il existe également des disparités flagrantes au plan des occasions d’emploi pour les employés appartenant à des minorités visibles au sein de nombreuses occupations. Plus précisément, il semble qu’une sorte de « plafond de verre » existe et se traduit pour les employés des minorités visibles en termes d’accès aux positions de gérance intermédiaire aussi bien qu’une sous représentation dans les occupations de service et de vente. Les emplois dans ces secteurs, particulièrement celui des services, sont en croissance et, par conséquent, ils deviennent importants pour le bien-être des minorités visibles (plus précisément, dans les occupations reliées à la vente et aux services).
Dans les secteurs des transports et des communications, les employés des minorités visibles demeurent remarquablement sous représentés. Il devient important pour les entreprises d’adopter des politiques proactives en matière de recrutement et de promotion, de fixer des objectifs significatifs et des agendas de réalisation en vue d’améliorer la représentation des minorités.
Les employés des minorités visibles apparaissent aussi sous représentés dans les plus petites entreprises. La Commission des droits de la personne doit accorder plus d’attention à la mise en oeuvre et au contrôle de l’équité en emploi dans ces entreprises. C’est d’autant plus critique lorsqu’on constate que ces petites et moyennes entreprises font appel à une proportion croissante et importante de la main-d’oeuvre.
Resumen
Este estudio se concentra sobre la eficacia del Acta de Equidad en el Empleo (AEE) de nivel federal. Nosotros evaluamos el AEE respecto a los empleados del grupo de minorías visibles (MV) utilizando los datos cuantitativos de los informes de empleados publicados según las disposiciones del AEE y el Censo Canadiense. Los datos de este estudio cubren el periodo 1987-1999. Nuestros resultados indican que las grandes compañías, y los grupos mas grandes de empleo al interior de las compañías, han alcanzado altos niveles de equidad. Hay también variaciones considerables en la realización de la equidad de empleo a través los sectores industriales, a través las provincias y a través las ocupaciones. En el conjunto, ha habido una mejora general en la realización de la equidad del empleo en este periodo. Sin embargo, las minorías visibles siguen siendo desfavorecidos en los puestos de gestion, de ventas y servicos y en las ocupaciones tecnicas. Varias implicaciones políticas son diseñadas a partir de estos resultados.
Corps de l’article
The Canadian federal Employment Equity Act (EEA), first passed in 1986 and then significantly amended in 1995, requires efforts by employers in covered sectors (i.e. communications, transportation, and banking) to reduce disparities in employment and workforce representation between designated groups (i.e., women, visible minorities, aboriginal peoples, and the disabled) and the general workforce, regardless of whether or not this is the consequence of deliberate discrimination. In this study, we focus on EEA effectiveness with regard to visible minority (VM) employees using quantitative data from employer reports published under the provisions of the EEA. Data in our study cover the period 1987 to 1999.
Visible minorities constitute a moving target in terms of representation. Unlike the disabled or aboriginal population, the VM population is growing and varies a great deal across provinces. Thus, matching a target now does not necessarily mean that the target will remain at the same level five years hence. Our work explores employment equity for VM employees over an extended period, to discern whether there is movement toward reasonable equity levels. This is the first study that examines the longitudinal effect (1987-1999) of the federal EE legislation on VMs. This is also the first time that VM data are being analyzed by each province and for detailed occupational categories.
There are a variety of reasons as to why attainment of employment equity may be elusive for visible minorities in Canada. VMs can encounter accreditation challenges that the other designated groups do not. Several studies (Cumming 1989; Jain 1982a, 1982b; Dodge 1972) indicate that overseas degrees are often not recognized by Canadian employers. Since most recent immigrants are VMs, they face a particular hardship in finding jobs consistent with their qualifications. This is because immigration is a federal responsibility and employment, education, and health come under provincial jurisdiction. Most professional organizations are licensed by provincial governments and are often alleged to keep recent immigrants, especially VMs, out of these professions. Some newspaper reports suggest that recent immigrants with doctorates and other professional degrees are often doing low-level jobs (Harding 2003; Jain 2003; Rajpal 2002).
Prior Research
Research by the Canadian Council on Social Development (2000) used both 1996 Census data and panel data on post-secondary graduates from the National Graduate Survey that studied the same individuals two and five years after graduation. Among its key findings:
VMs generally have higher education levels than non-VMs, yet VMs with university education are less likely to hold managerial/professional jobs than non-VMs with similar levels of education
Foreign-born VMs experience greater education-occupation discrepancies compared to other groups; less than half such individuals with a university education have high skill level jobs.
Most VMs with managerial jobs are self-employed.
Foreign-born VMs are over-represented in the lowest income quintile and under-represented in the highest income quintile.
Even Canadian-born VMs are still less likely than foreign-born and Canadian-born non-VMs to be in the top 20% of the income distribution (also see Zuriek (1983) on this point).
There is then a clear pattern of apparent disadvantage in the labour market for VM workers that is reflected both in patterns of employment and in earnings. These findings concern VMs generally, not just those covered under the EEA, so it offers little insight into the impact of the law specifically. However, it establishes that there are pervasive, continuing differences in employment conditions between VMs and non-VMs throughout the Canadian economy, and indicates a need to examine whether or not the EEA has had any impact within the sectors that it covers. One cannot conclude merely from such descriptive data that differences in labour market outcomes for VMs and non-VMs derive from racial discrimination by employers. There may be cultural and related social factors which cause VMs to pursue different career paths than non-VMs, thus resulting in the observed differences between the two groups. Other research, however, indicates that bias and discriminatory intent can be very much at work here.
An early study on the general topic of discrimination (Henry 1978) found that, in a sample of white individuals in Toronto, over 50% of those studied expressed attitudes that could be described to some degree as racist. The report of the Commission of Equality in Employment (Abella 1984) found that non-whites all across Canada complained of facing both overt and indirect discrimination. The report concluded that racial discrimination in employment is a real concern and strong legislative measures were necessary to reverse or inhibit the degree to which members of visible minority groups are unjustifiably excluded from the opportunity to compete as equals. Henry and Ginzberg (1985) used a sample of classified ads in the major newspapers in Toronto to assess employer responses to white versus VM applicants. The authors used direct in-person applications with matched pairs (based on similarity in work experience, skills, and physical characteristics) of black and white applicants. Offers to whites outweighed offers to blacks by a ratio of three to one. In another sample of jobs that were tested by phone inquiries, the percentages of times that white Canadian, white immigrant, West Indian black, and Indo-Pakistani callers were told jobs were open for them were, respectively, 85.2%, 65%, 51.9%, and 47.3%. Furthermore, when employers discriminated among callers by differentially screening them, white Canadians were never screened for their experience or qualifications, while applicants from the other three racial minority groups were frequently screened on these criteria (also see Holzer and Newmark 2000a, 2000b for audit studies; Heckman 1998).
More recent studies demonstrate continuing patterns of employment discrimination against racial minorities. Work on the status of racial minorities in the public services has shown a persistence of discriminatory practices against visible minorities (Samuel 1997; Perinbam 2000). Among other studies in the Canadian context that provide empirical evidence on the representation gap between whites and racial minorities, without directly relating this gap to racial discrimination, are Jain, Singh and Agcos (2000), and Ornstein (2000). Jain, Singh and Agcos (2000) found significant under-representation of racial minorities in selected police services across Canada and indicated that selection and promotion policies that disadvantage minorities may be responsible for this under-representation. Ornstein (2000) found a generally pervasive disparity between members of racial minorities and whites in the City of Toronto in pay, employment rates, and other socio-economic indicators. A longitudinal study by Jain and Al-Waqfi (2001) found widespread employment discrimination against VMs. Reitz and Verma (1999) found that VMs are also substantially underrepresented in unionized jobs. Other things equal, we might expect that jobs covered by collective bargaining agreements would provide generally better working conditions and wages than equivalent non-union jobs. That VMs have less opportunity to obtain these jobs suggests yet another reason as to why they are disadvantaged in the labour market.
In addition to research dealing with employment opportunities for VMs, there are also several studies that deal with earnings outcomes. In light of what is known about employment discrimination, it is not surprising that these studies generally show VM employees have lower wages and earnings than non-minorities, even after controlling the standard human capital variables (Howland and Sakellariou 1993; Baker and Benjamin 1997; Pendakur and Pendakur 1995; Gorrie 2002).
The overall evidence from previous studies thus indicates that racial discrimination is responsible for at least part of the disparity in achievements between various racial minorities and whites in the Canadian labour market. The more important and compelling issue now is not whether racial discrimination exists, but rather how can the situation be rectified. Employment equity laws and regulations, such as the EEA, are intended to provide an institutional tool to lessen the adverse impact of discrimination on designated groups. Given that the EEA has been on the books since 1986, sufficient data are now available to assess its effectiveness in enhancing employment opportunities for visible minorities.
Although provincial and some municipal governments have implemented employment equity programs (Antecol 1998), and at the federal level there is, in addition to the EEA, the federal Contract Compliance Program (Equity Program, July 15, 2001), the EEA is generally seen to be stronger and more comprehensive than these other government-mandated programs (Jain, Sloane and Horwitz 2003; Jain 2001, 1993; Gunderson, Hyatt and Slinn 2002; Taggar, Jain and Gunderson 1997). Gunderson, Meng and Smith (1996) found that the average wage premiums of designated group members was 7.2% higher in companies covered by the EEA relative to companies not covered by the EEA. Earlier studies indicated that women have been the main beneficiaries of the EEA (Blackley and Harvey 1988; Sloane and Jain 1990). Jain and Hacket (1992) also confirmed that the EEA has had a significant effect on increasing the representation of women in organizations covered by the EEA relative to organizations not covered by the law. Several studies have concluded that effects of the EEA differ for white women and women that are also visible minorities, aboriginals or have a disability (Leck and Saunders 1992) and that the wage gap had actually increased for the female members of these designated groups (Leck, Onge and Lalancette 1995).
Conceptual Framework
Our objective is to assess the effectiveness of the EEA in improving quantitative measures of employment equity outcomes. To do this, we use data drawn from a sample of annual reports filed by companies covered under the EEA for the period 1987-1999. Our unit of analysis consists of provincial-wide occupational groups from each of these companies in each year for which data were reported. For example, one observation might consist of data on professionals employed by Air Canada in British Columbia in 1997, while another might be based on administrative and senior clerical personnel employed by the Royal Bank of Canada in Ontario in 1998 or skilled, sales and service personnel employed in Nova Scotia in 1999 by Bell Canada. For simplicity we will refer to a particular unit of observation as an employment group.
Our dependent variable represents the degree to which VM workers within a particular employment group have secured parity in relation to the relevant external labour market. Internal employment equity is defined as the ratio of VM employment in a given employment group to total employment within the same employment group. VM labour market representation is based on census data for the province and is defined as the ratio of VM employment in the corresponding occupational category and province relative to total employment for that occupational category and province. We had census data for two years (1991 and 1996). In order to establish the provincial measure of VM labour force representation for each occupational group in each of the years between 1987 and 1999, we utilized extrapolation and interpolation as described below.
The composite employment equity measure is defined as the difference of the internal equity measure and labour market representation; this is termed VM employment equity (Equation (1)). The value of this measure can be interpreted as the percentage adjustment that would have to be made in the employment group’s relative headcount in order to achieve equity in comparison to the relevant external labour market for the year in question. A value of zero indicates that the firm has achieved, at least in a technical sense, employment equity for VM employees for that particular group. Positive values indicate the firm exceeds objectives defined by the Census data for the employment group in question and negative values indicate VM employees are underrepresented in the firm for the occupation and province in question.
(1) VM_EEc,p,i,t = (VMc,p,i,t /Nc,i,p,t) – (VMc,p,t /Nc,p,t)
VM_EEc,p,i,t = measure of VM employment equity in occupational category c in province p for company i at time t;
VM = number of VM employees in category defined by subscripts;
N = number of all employees in category defined by subscripts.
As mentioned, values for VMc,p,t and Nc,p,t had to be estimated for census off-years. We used the following formula to interpolate values for the period 1991-1996 for year t (Nc,p,t is used in these equations, though the same procedures were used for VMc,p,t):
(2) Nc,p,t = Nc,p,91 + (t-1991) × (Nc,p,96 – Nc,p,91)/5
Nc,p,91 = 1991 Census report of employment occupational category c in province p;
Nc,p,96 = 1996 Census report of employment occupational category c in province p;
We extrapolated the employment values for 1997 to 1999 as:
(3) Nc,p,t = Nc,p,91 + (t – 1996) × (Nc,p,96 – Nc,p,91)/5
The values for the years prior to 1991 were likewise extrapolated:
(4) Nc,p,t = Nc,p,91 - (1991 - t) x (Nc,p,96 - Nc,p,91)/5
One major limitation in this work is that we only have data on organizations covered by the EEA and thus are required to have active employment equity programs in place. Similar research conducted in the U.S. on affirmative action (i.e., employment equity) programs (Leonard 1983, 1984; Holzer and Newmark 2000b) benefited from the fact that not all companies studied were required to have affirmative action (i.e., employment equity) programs in place, so it was possible to contrast companies with affirmative action programs to those without such programs within the same economic sectors. Therefore, in this study we are not able to observe directly the impact of the presence of a legally mandated program on the achievement of employment equity objectives. However, we can observe the impact of several context variables on employment equity outcomes to discern, within the set of covered firms, those conditions under which the EEA has been more versus less effective.
Our explanatory variables include time, occupational categories, geographical location (i.e., province), employment type (full-time, part-time, or temporary), organizational size, employment group size, and industrial sector. Time is measured by the difference of the year of the observation from the year of EEA implementation (1986). EEA reports are filed annually, so there are separate observations for a given employment group for each year in which the firm has had to provide data relevant to the group. The temporal measure is very important as it assesses changes in employment equity over time. An upward trend in employment equity suggests that the EEA may have the desired consequences. It certainly is a necessary condition to establish the effectiveness of the law, but since we are not able to make direct comparisons to similar companies without employment equity provisions, we cannot rule out such changes as to be rooted in broader social change in Canada. However, if the trend is negative, or only weakly positive, then we could conclude that the EEA is having no substantive effect on employment equity. In other words, progress over time with regard to employment equity is a necessary condition to establish EEA effectiveness, though is not sufficient alone to warrant such a conclusion.
The total size of the employer within Canada and the size of the employment group are also included in our analysis as explanatory variables. Prior research on the effectiveness of affirmative action in the U.S. (Leonard 1983, 1984) has shown associations between organizational size and various indicators of affirmative action effectiveness. Overall organizational size might be expected to impact employment equity in a couple of ways. Large companies are more visible to both the public and government regulators. Thus they may be inclined to pursue more aggressive employment equity efforts to avoid adverse publicity and excessive attention from the government. Also, larger organizations typically have more slack resources and thus may be better able to absorb the costs of making employment adjustments. We would anticipate that firm size is positively related to employment equity attainment. We also see the size of the employment group as highly relevant. Larger units will attract more attention and changes in larger units will also have a larger effect on overall firm employment equity. Larger units will normally have more turnover, allowing the firm to make employment adjustments more easily by responding to attrition. Finally, there may be social constraints imposed on change by close-knit groups in smaller units. We would anticipate that employment group size is positively related to employment equity attainment.
Available evidence, as discussed above, suggests something of a “glass ceiling” for VMs in certain occupations. In particular, VMs seem to have quite limited opportunities in managerial occupations. However, in contrast, relatively educated VMs do seem to have considerable access to professional positions. Thus, we would anticipate relatively low employment equity attainment for managerial occupations, but relatively high attainment in professional occupations (Perinbam 2000; National Capital Alliance 1997; Samuel 1997).
The EEA covers three industrial sectors: banking, transportation, and communications. We would anticipate substantial differences in EE attainment across these industries. Banks are generally highly visible organizations as there is a limited number nationally. Moreover, these organizations are typically quite profitable, so have the necessary resources to implement effective EE programs. In contrast, the transportation sector consists of generally less visible organizations and there are far larger numbers of companies in this sector. Thus, the chances of being a target for governmental action are more limited. This sector is also highly competitive and profit margins are more limited than in the banking sector. The same would apply in the case of the communications industry. Thus, we anticipate that banking will have higher levels of employment equity attainment than either communications or transportation. However, we have no strong prior expectations regarding differences between communications and transportation.
Although there would not seem to be previous research on this issue, we include measures of the type of employment, differentiating among full-time, part-time, and temporary employment. Part-time and temporary jobs are generally viewed as part of the secondary labour market (especially temporary jobs). Discrimination would be expected to shunt VM’s into secondary jobs. In addition, recent immigrants might have much greater luck with secondary labour market jobs. If so, we would expect to see higher levels of VMs, even significant over-representation of this group, inpart-time or temporary jobs.
A final variable in our analysis is the province in which the employment group is situated. There is reason to believe that the province will impact employment equity attainment based on the variations across provinces in terms of culture, social relationships, and concentrations of visible minorities. For example, both British Columbia and Ontario have relatively large VM populations and we might assume that translates into social pressure supportive of EE. Thus employment equity attainment might be expected to be relatively high in those provinces. Despite lower concentrations of VMs, Saskatchewan has a liberal political tradition that might be anticipated to promote higher employment equity attainment. In contrast, conservative provinces, such as Alberta, and those with quite low VM concentrations, such as Quebec and the Maritime Provinces, would be anticipated to have lower social pressure supporting equality, thus generating lower levels of employment equity attainment. But the converse could also hold. Provinces with very high VM concentrations (especially Ontario and British Columbia) might have much greater difficulty in employment equity attainment because of the size of the task and there might be more substantial resistance from non-VM employees to EE initiatives as these workers could feel more threatened.
Data and Research Methods
Sample
Our sample consists of the 116 companies that filed EEA reports in each year from 1987 either through 1999, or the last year the company was an independent entity (for companies that went out of business, were acquired, or otherwise changed organizational identity). The unit of observation is the employment group (defined above), not the company as a whole. So, although there are 116 companies in this sample, each company consists of a large number of employment groups. Thus the actual sample size depends on the number of employment groups in each company and on the number of years the company is represented in the sample.
Variables
The dependent variable (VM employment equity) has been defined above. All of the predictor variables (also discussed above) were obtained from the HRDC database. The predictor variables include:
A set of dummy variables representing the major occupational categories contained in the dataset. As the occupational categories have changed somewhat over the period 1987-1999, we have had to reconcile these changes to assure comparability (see below).
A set of dummy variables representing all provinces. Only provincial data are analyzed here, as the number of cases and units sizes for territorial data are quite small.
A set of dummy variables used to indicate the year of the EEA report. This variable allows us to assess variations in VM employment equity.
Organizational size. This is measured both by the total size of the company’s Canadian operations and by the size of the specific employment group. As both measures have quite skewed distributions, we use the logarithm of the total number of Canadian employees in the company in the year of observation (overall company size) and the logarithm of the total number of employees in the employment group (e.g., sales workers in British Columbia) for the year in question (group size).
Dummy variables indicating industrial sector. The EEA applies to three industrial sectors: communications, banking, and transportation. Dummy variables are included to discern sectoral variations in EEA goal attainment.
Dummy variables indicating employment type. We also investigated differences between full-time employees and those who are either employed on a temporary or part-time basis. Dummy variables differentiate among these three categories of employment.
The regression analysis used sets of dummy variables to parameterize the categorical independent variables, including occupation, industrial sector, province, year of observation, and company. A deviational scoring method was used in all cases. As is normally the case with dummy variables in regression analysis, there is one less dummy variable than the number of categories for a given variable. As an example, in the case of provincial categories, there are nine dummy variables corresponding to the ten provinces. The tenth province (in this case Prince Edward Island) serves as a reference group. Prince Edward Island was chosen as it is small, thus allowing the deviations of the larger and more significant provinces to be discerned from the parameter estimates more readily, as explained below. The dummy variables are coded in the following manner. Each of the nine non-reference group provinces has a corresponding dummy variable. This is coded as a one if the observation occurred in that province and zero if it occurred in any of the other eight non-reference group provinces. If the observation occurred in the reference group province (i.e., Prince Edward Island), then all of the provincial dummy variables are coded as negative one. Deviational scoring with dummy variables is somewhat different from the standard approach, in which dummy variables represent the difference in a given category relative to a reference category (i.e., Ontario vs. Prince Edward Island). However, in this study, where there are multiple categories for most of the independent variables, the deviational approach greatly simplifies the presentation and interpretation of the results. If we had used standard dummy variable coding, then we would have needed to do multiple pairwise comparisons among the various provinces (or relevant categories for the other categorical independent variables), as the significance levels and differences for each category dummy would only be relative to the reference (omitted) category. In contrast, the deviational approach provides comparisons of the average value of the dependent variable within each province to the overall average of the dependent variable, holding constant the other independent variables. So the coefficient for the Ontario dummy variable represents the deviation of Ontario cases relative to the overall average after adjusting for occupation, industry, unit size, etc. The deviation from this average for Prince Edward Island, the reference group province, is equivalent to minus the sum of the coefficients for all of the other provincial dummy variables and can thus also be calculated. The same approach is used to code the other categorical variables. Reference groups for occupation, year, industrial sector and employment type are, respectively, semi-skilled manual workers 1987, transportation, and full-time employment.
Occupational Categories
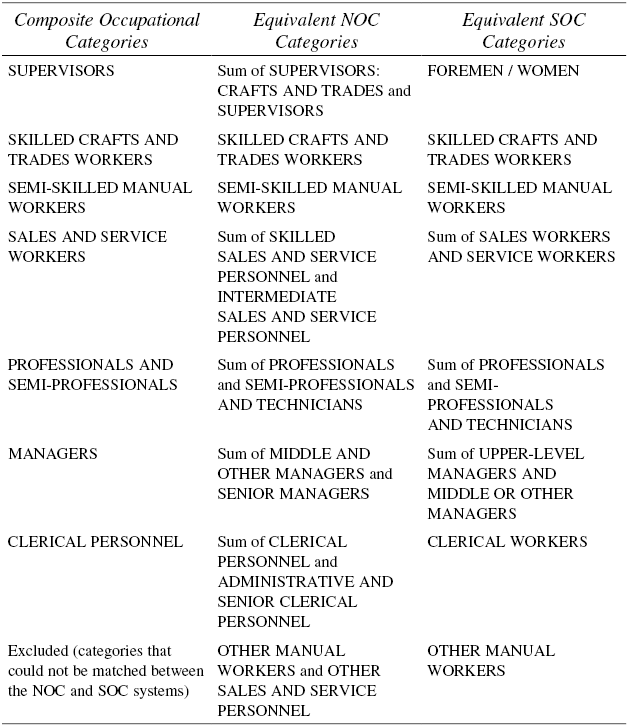
For the period 1987 through 1996, employers were required to use the Standard Occupational Classification (SOC) system in reporting employment. This system was changed in 1997 to the National Occupational Classification (NOC) system. Unfortunately, the occupational categories are not the same in these two systems, although it is possible to compare the two systems and find occupational categories that are roughly equivalent. This is important, as otherwise we would not be able to examine employment equity outcomes across the entire time period for which data were available. We would have had the problem of comparing “apples and oranges” in considering the results for the earlier time period and the latter time period. However, occupational categories are very important in this study and cannot be ignored. So we had to develop an alternative set of occupational categories that would be roughly equivalent across the entire 1987-1999 time period.
Fortunately, supplementary information supplied by Canadian governmental agencies allowed us to develop a set of composite occupational categories that, while not completely eliminating the problem of inconsistency in occupational categories over time, did at least provide reasonably comparable categories for the 1987-99 period. There were some instances in which broad occupational titles were identical in the NOC and SOC systems. However, that did not always mean the classifications were identical, as there were situations in which there had to be some shifting of the components of these categories. For example, the “skilled crafts and trades workers” category has the same meaning in the NOC and SOC systems, so no adjustment was needed in this case. “Semi-skilled manual workers” was a category likewise common to the NOC and SOC systems and comparable in meaning in both cases. On the other hand, although the categories “professionals” and “semi-professionals and technicians” are both NOC and SOC categories, there are variations in meaning (e.g., some SOC “semi-professional” occupations were shifted to the “professional” category in the NOC). Thus, it is only possible to compare the sums of professional and semi-professional employment across the two systems. In yet other cases, titles and category meanings are quite dissimilar between the NOC and SOC (e.g., “clerical workers” vs. “clerical personnel” and “administrative and senior clerical personnel”).
To resolve this problem, we created composite occupational codes to cover the entire period of this study. For cases in which NOC and SOC categories were identical in meaning, we maintain those groupings. In other instances, it was necessary to combine certain SOC categories related NOC categories into a new, more general category which would be equivalent in sum across this period. Some categories lacked ready means of comparison, even in aggregate, between the NOC and SOC systems. Consequently, those categories had to be dropped completely from the analysis. Table 1 shows the relationship of the seven composite occupational categories we were able to generate by matching SOC and NOC categories. For example, we created a category of “supervisor” that, for the period in which NOC system was in effect (after 1996), is defined as the sum of the number of individuals in the NOC categories of “Supervisors: crafts and trades” and “Supervisors”. For the SOC period (1996 and earlier), it is set equivalent to the number of individuals in the single SOC category of “Foremen/women”). The other composite categories are similarly defined in Table 1. Finally, some categories could not be matched between the NOC and SOC systems and, as noted, are excluded from our analysis.
Findings
Before examining the results of regression analysis, it is useful to consider the overall VM employment equity measure for our sample. Table 2 reports the averages for VM employment equity for the 1987-1999 period, broken down by provincial and occupational categories. The first column under each occupation contains the internal equity measure (proportion of VMs in EEA covered employment groups (italicized)) and the second contains the VM employment equity measure that is used as the dependent variable in this study (difference between internal and external equity (underlined)). Group averages are also presented.
Table 1
Relationship of Composite Occupational Categories Used in 1987-1999 Data Analysis to NOC and SOC Categories
When considered in total, average internal equity was 2.9 (lower right-hand corner of Table 2). However, over time, this has been substantially less than VM representation in the labour market, as the composite VM employment equity measure on average was –2.2%, indicating that relative VM employment within EEA-covered employment groups was more than two percentage points below VM representation in the broader labour market. Some provinces have relatively average internal equity levels, with Ontario and British Columbia far higher than any other province. Of course, this reflects the much larger VM concentrations in these provinces, fueled in particular by large numbers of Asian immigrants. However, in both instances, VM employment equity is strongly negative (–5.3% in British Columbia and –4.7% in Ontario), indicating that VMs are substantially underrepresented in EEA-covered companies in these provinces. Some other provinces had relatively high VM equity levels (e.g., New Brunswick, Newfoundland), yet have very small numbers of VM workers overall. So, ironically, provinces with the highest concentration of VM employees and the greatest also have had the greatest level of workplace inequity. These averages are , of course for the entire period of the study. In fact, if we only look at the most recent year in our sample (1999), VM equity has improved in both Ontario and British Columbia, but is still rather high (–4% in Ontario and -5.3% in British Columbia). Occupation data also suggest differences in employment equity across groups. Positions such as managers and professional and semiprofessionals, clearly highly desirable jobs, have relatively low employment equity levels, though the lowest average levels were for sales and service workers and also semi-skilled manual workers. VMs achieved highest levels of employment equity generally in first-line supervisory positions and clerical positions.
VM employment equity for the period 1987-1999 was regressed against (a) occupational categories, (b) year of observation, (c) province, (d) industrial sector, (e) employment type, (f) overall company size and (g) unit size. We did preliminary analysis to check outliers and found a small but meaningful number of cases several standard deviations above the mean. We restricted the sample to ±3 standard deviations of the mean (and found this substantially improved model fit). Given the positive values of the outliers, these would have been cases where VMs had done exceptionally well. However, their inclusion would have greatly distorted the results. Residual plots indicated normality. Finally, residual plots also suggested the possibility of heteroskedastic residuals. Assuming residual variance to be related to unit size, we considered different weighted least squares estimates based on unit size as the weighting factor. This analysis suggested weighting did not significantly improve fit, so here we report ordinary least squares (OLS) estimates.
All of the independent variables, except for company and unit sizes, were parameterized as sets of dummy variables using deviational coding (as described in above). Thus, we have a fixed effects model controlling for all of the dimensions across which the sample varies (i.e., time, location, company, and occupation). Descriptive statistics for the independent variables used in this analysis are presented in Table 3. The sample used here consisted of a total of 28571 observations. Overall, the model explains about 18% of the variance in VM employment equity (i.e., adjusted R2), with an F-ratio that is significant at the .001 level; regression results appear in Table 4.
Table 2
Average Internal Equity and VM Employment Equity by Occupational Category and Province, 1987-1999 a (N = 28572)
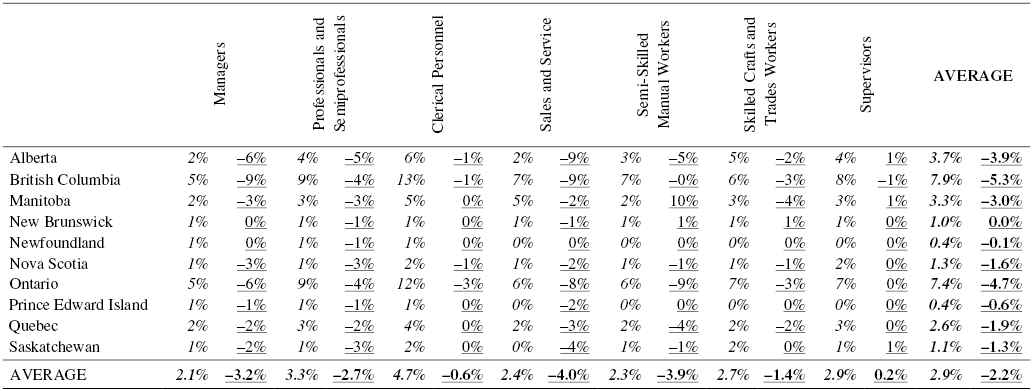
a Values for internal employment equity are displayed in italics; values for VM employment equity are underlined.
Table 3
Descriptive Statistics for Independent Variables Used in Regression Analysis of the VM Employment Equity Measure, 1987-1999
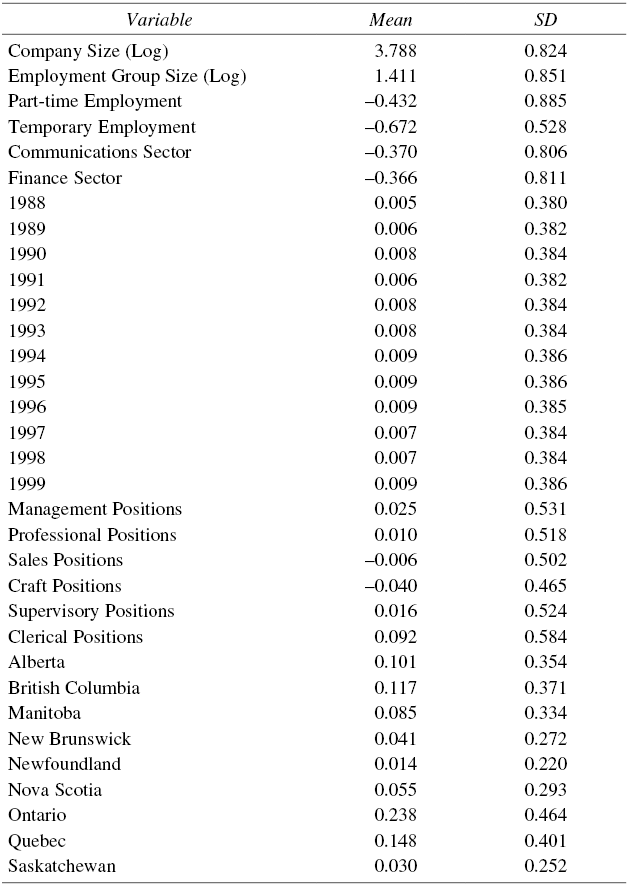
Table 4
Results of Regression Analysis of the VM Employment Equity Measure, 1987-1999 (N = 28572)
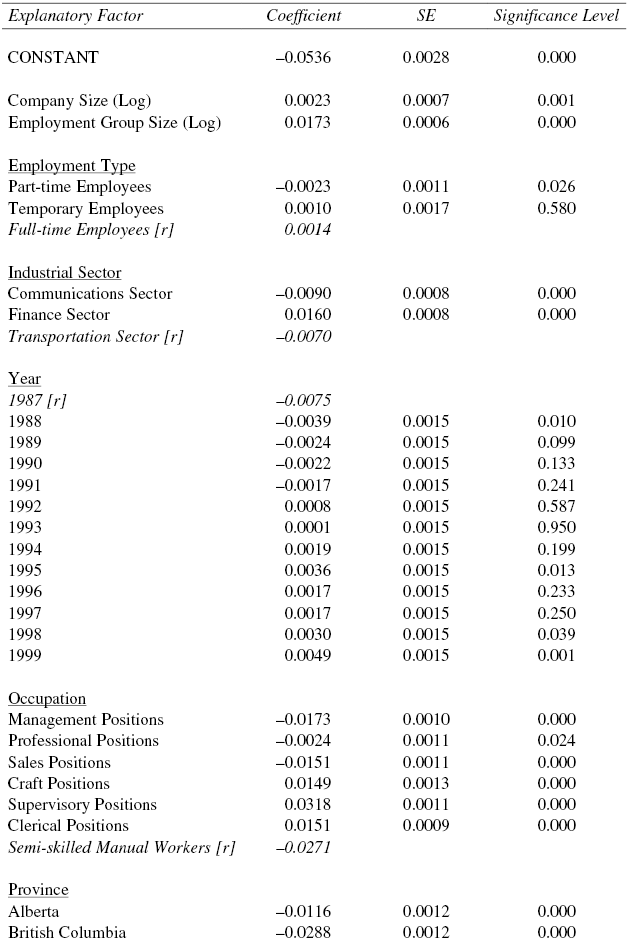
Table 4 (suite)

Adjusted R-Square = .18 F33,28538 191.65 (p < .001)
(r) indicates reference group; the coefficient for this category has been imputed, as discussed in the text. In most instances, the standard error is not readily computable and is not reported.
The appropriate approach to assessing the impact of the different sets of categorical variables is a partial F-ratio. That is, we estimate a constrained model, where all of the parameters for a given set of categorical dummy variables are set to zero, while all other parameters are free to vary. We use the difference in R2 between the constrained and the full model (i.e., unconstrained model) to compute an F-ratio that can be used to test the significance of this set of variables.
Geographical Location
There are statistically significant variations in VM employment equity across provinces (F9, 28538 = 139.34, p < .001). The parameters represent the average deviation in VM employment equity from the Canadian-wide average after controlling for all of the other explanatory variables. The most negative value is in the case of British Columbia. We could interpret this as indicating that, other things equal, the VM employment equity measure for British Columbia was nearly three percentage points lower than we would have expected it to be, given the other characteristics of these employment units. Another way of thinking about this is that covered employment units in British Columbia would have, on average, had to have made around a three percent adjustment in total employment in order to achieve employment equity equivalent to similar types of units in other parts of Canada. So it is the case here that the more negative this number, the more out of alignment a province is with the overall expected level of VM employment equity.
In terms of the statistically significant effects for individual provinces, employment units in Ontario, Alberta, and Manitoba, as well as British Columbia, had generally under-performed relative to expectation. In contrast, employment units in the Maritimes (especially Newfoundland, Prince Edward Island, and New Brunswick) did generally better than would be expected. We need to recall, however, that these numbers are all relative to local labour market standards. This does not mean that, for example, employment units in Ontario have lower levels of VM employment than units in Newfoundland; rather, they are lower relative to the local labour market standard than firms in Newfoundland. Some of these results are contrary to expectation; possible explanations are discussed below.
Occupational Category
Since this analysis is for the 1987-1999 period in its entirety, we have had to use the more limited set of occupational categories described above that are a composite of NOC and SOC categories. These results suggest considerable variation across the composite occupational categories regarding then achievement of VM employment equity (F6, 28571 = 350.88, p < .001). VM employees did best in supervisor, clerical, and craft and trades positions, where VM employment equity exceeded its expected level after controlling for the other explanatory variables. However, these are generally lower wage positions compared to certain occupational categories where VM workers are substantially under represented (manual workers, sales workers, professionals, and managers).
Organizational Size
The coefficient in the regression equation associated with overall company size (i.e., log of Canadian-wide employment) is positive and statistically significant at the .001 level. Thus, larger organizations do a better job of providing equity in employment for VMs than do smaller firms. Given the manner in which the size variable is measured, the statistical estimate indicates that a ten-fold increase in total employment in a firm resulted in roughly a 0.23 percent increase in the VM employment equity measure. Perhaps larger organizations have more in the way of spare resources to focus on achievement of employment equity or perhaps they are more visible than smaller firms, thus more sensitive to the need to comply to EEA requirements. The size of the employment unit had strong and positive impact (significant at .01 level). Where there are larger concentrations of employees of a particular occupational category, VM employment equity is higher. A ten-fold increase in unit size resulted in about a 1.6 percentage point shift in VM employment equity.
Industrial Sector
The EEA covers three industrial sectors: communications, transportation, and finance. Our analysis indicates a significant impact of industrial sector on VM employment equity levels (F2, 28571 = 185.02, p < .001), with equity levels much higher in the finance sector than either the communications or transportation sectors. In the finance sector, this measure is 1.6 percentage points above the average after controlling for the other explanatory variables. In contrast, the transportation and communications sectors are each below average, with transportation having by far the lowest VM employment equity level.
Employment Type
The overall effect of employment type was statistically significant (F2, 28571 = 5.9, p < .01). However, the VM equity measure was not significantly different from the mean in the case of temporary workers, though was significantly less for part-time employees. These findings suggest that it is not the case, as we speculated it could be, that VMs were over-represented in the secondary labour market (as would have been the case had the coefficients for temporary or part-time workers been strongly positive).
Time
The time indicators (year of observation) had, in net, a statistically significant impact on VM employment equity after controlling for the other explanatory variables (F12, 28571 = 4.82, p < .001). There is a generally upward sloping relationship (i.e., the coefficients for the year dummy variables range form strongly negative in the 1980s and early 1990s, to strongly positive in the late 1990s), suggesting continual improvement in VM employment equity from the implementation of the EEA through 1999.
Discussion
Our study analyzed the relationship between employment equity attainment for visible minorities under the provisions of the EEA and a variety of contextual factors. There are several major findings. First, as anticipated, larger companies, and also larger employment groups within companies, had higher levels of employment equity attainment. This could have resulted from size being related both to organizational visibility and the availability of greater resources to address EE objectives. Second, there was considerable variation across industrial sectors in terms of EE attainment, with the banking sector having the highest levels, which we also expected to be the case. This may be related to the visibility of banks and the fact the banking sector does not have the strong competitive pressures experienced in the communications and transportation sectors. Thus banks are more apt to have slack resources available to support EE efforts and perhaps are more sensitive, due to size, to the attention of regulators. Third, there was considerable variation across provinces in terms of EE attainment, with the levels of attainment surprisingly low in the two provinces with the highest concentrations of VMs (i.e., Ontario and British Columbia), a finding that was not expected. Perhaps this is because of large numbers of immigrants situating in these provinces in recent years, there may also be a disproportionate number of individuals whose foreign credentials and experience are not recognized by employers in Canada. These individuals may have limited language skills and connections to the broader community. VM groups in other provinces may have been part of better established communities and thus had greater entrée to companies by virtue of greater assimilation. Moreover, the numbers of VMs in some of these provinces was quite small, so companies perhaps needed to engage limited efforts to achieve reasonable EE levels. Fourth, our data indicated a general improvement in EE attainment over time, which would be consistent with EEA effectiveness. Fifth, there was no evidence to suggest that VMs were over-represented in secondary labour market settings. Finally, we observed that EE attainment varied substantially across occupations. VMs are particularly disadvantaged in management, professional, and sales positions, as well as skilled manual jobs.
Clearly this study looks at only selected issues by focusing on contextual data provided in the EEA annual reports. To be sure, these are important dimensions that are presumed to be related to an organization’s propensity to meet employment equity goals. However, future research might focus on more specific organizational characteristics, such as measures of organizational performance, the broader social context, and whether or not the firm is Canadian-owned or foreign. More detailed work of this sort will, however, likely come at the expense of such a large and varied a sample we had for this study.
We believe that these findings have important practical implications, especially with regard to EEA enforcement:
Increased Enforcement: It is clear from our analysis that VM employees in the companies covered by the EEA continue to be substantially under-represented. VM staffing levels as a proportion of total employment in the cases we studied are only about three-quarters of what would be necessary to achieve parity with VM representation in the Census. It is also true that there are a relatively large number of cases in which VM representation is extremely low or non-existent. It is therefore clear that increased and vigorous enforcement of the EEA for the VM group is necessary by the Canadian Human Rights Commission.
More Focus on Occupational Inequities: There are significant disparities in employment opportunities for VM employees across several occupations. In particular, there seems to be a kind of “glass ceiling” operating for VM employees in terms of access to middle and senior management positions. Therefore, companies need to create a climate of acceptance and tolerance for VM employees at these levels by sensitizing top management to the need to eliminate these job barriers. This is also true for sales and service employees, where VM employees are also substantially under-represented. This is relevant as jobs in these occupations may be an important avenue for advancement to higher-level jobs. Economic transition means that jobs in these areas, particularly the service sector, are growing and thus important to the welfare of visible minorities.
More Focus on Sectoral Differences: In the communication and transportation sectors, VM employees remain substantially under-represented. It is important that organizations undertake pro-active recruitment and promotion policies and establish significant goals and timetables to improve VM representation.
More Focus on Company and Employment Group Size: VM employees tend to be under-represented in smaller firms. The Canadian Human Rights Commission (CHRC) needs to pay more attention to monitoring and enforcing employment equity in these types of firms. This is especially critical as smaller and medium enterprises employ a significant and growing proportion of the labour force. Regardless of firm size, visible minorities are even more significantly under-represented in smaller employment units (i.e., a given occupation for a particular company in a particular province). Thus the CHRC cannot afford to minimize monitoring and enforcement in the smaller and perhaps less divisible units of even larger companies. In aggregate, VM under-representation in these units has a substantial adverse impact on achievement of parity with VM representation in the Census.
Parties annexes
Remerciements
This study was partially supported by the Social Sciences and Humanities Research Council (SSHRC). We also wish to acknowledge the assistance of Heritage Canada and Human Resources Development Canada (HRDC).
References
- Abella, R. Silberman. 1984. Equality in Employment: The Report of the Commission on Equality in Employment. Ottawa: Supply and Services Canada.
- Antecol, Heather. 1998. “Gender Differences in Labour Market Outcomes.” Ph. D. Thesis. Hamilton: McMaster University.
- Baker, Michael and Dwayne Benjamin. 1997. “Ethnicity, Foreign Birth and Earnings: A Canada/U.S. Comparison.” Transition and Structural Change in the North American Labour Market. M. G. Abott, C. M. Beach and R. P. Chaykowski, eds. Kingston, Ont.: IRC Press, Queens University at Kingston.
- Blakley, J. H. and E. B. Harvey. 1988. “Socio-economic Change and Lack of Change: Employment Equity Policies in the Canadian Context.” Journal of Business Ethics, Vol. 7, 133–150.
- Canadian Council on Social Development. 2000. Unequal Access: A Canadian Profile of Racial Differences in Education, Employment and Income. Toronto: Canadian Race Relations Foundation.
- Cumming, Peter A., Chair. 1989. Access! Task Force on Access to Professions and Trades in Ontario. Toronto: Ministry of Citizenship.
- Dodge, D. A. 1972. “Occupational Wage Differentials, Occupational Licensing and Return to Investment in Education: An Exploratory Analysis.” Canadian Higher Education in the Seventies. S. Ostry, ed. Ottawa: Economic Council of Canada.
- Gorrie, Peter 2002. “Discrimination Costly: Loss to Economy of Underpaying Estimated at $15 Billion a Year.” Toronto Star, March 20.
- Gunderson, Morley, R. A. Meng and D. A. Smith. 1996. “The Impact of Employment Equity Programs on Wages.” Unpublished Paper.
- Gunderson, Morley, Douglas Hyatt and Sara Slinn. 2002. “ Employment Equity in Canada and the United States.” Proceedings of the 54 th Annual Meeting of the Industrial Relations Research Association. Champaign, Ill.: IRRA, 146–153.
- Harding, Katherine. 2003. “A Leap of Faith: Foreign-Trained Professionals, Desperately Needed in Canada, Expect to Land on Their Feet Here. Instead, They Face Miles of Red Tape.” Globe & Mail, January 8, C1, C6.
- Heckman, James J. 1998. “Detecting Discrimination.” Journal of Economic Perspectives, Vol. 12, No. 2, 101–116.
- Henry, Frances. 1978. The Dynamics of Racism in Toronto. Toronto: Department of Anthropology, York University.
- Henry, Frances and Effie Ginsberg. 1985. Who Gets the Work? A Test of Racial Discrimination in Employment. Toronto: The Urban Alliance on Race Relations and the Social Planning Council of Metropolitan Toronto.
- Henry, Frances, Carol Tator, Winston Mattis and Tim Rees. 1994. The Colour of Democracy: Racism in Canadian Society. Toronto: Harcourt Brace.
- Holzer, Harry J. and David Neumark. 2000a. “What Does Affirmative Action Do?” Industrial and Labor Relations Review, Vol. 53, January, 240–271.
- Holzer, Harry J. and David Neumark. 2000b. “Assessing Affirmative Action.” Journal of Economic Literature, Vol. 38, September, 483-568.
- Howland, Juliet and Christos Sakellariou. 1993. “Wage Discrimination, Occupational Segregation and Visible Minorities in Canada.” Applied Economics, Vol. 25, 1413–1422.
- Jain, Ajit. 2003. “‘So I am a Carpenter Now’: Qualified Immigrants Find the Canadian Job Market Disheartening.” India Abroad, January 3, 1–3.
- Jain, Harish C. 1982a. “Employment and Pay Discrimination in Canada: Theories, Evidence and Policies.” Union-Management Relations in Canada. J. Anderson and M. Gunderson, eds. Don Mills, Ont.: Addison-Wesley.
- Jain, Harish C. 1982b. “Race and Sex Discrimination in Employment in Canada: Theories, Evidence, and Policies.” Relations Industrielles/Industrial Relations, Vol. 37, No. 2, 342-366.
- Jain, Harish C. 1993. “Employment Equity and Visible Minorities: Have the Federal Policies Worked?” Canadian Labor Law Journal, Vol. 1, 389–408.
- Jain, Harish C. 2001. “Equality and Diversity in Employment in Canada.” Equality, Diversity and Disadvantage in Employment. M. Noon and E. Ogbonna, eds. London: Palgrave, 80–102.
- Jain, Harish C. and Peter Sloane. 1981. Equal Employment Issues: Race and Sex Discrimination in the United States, Canada, and Britain. N.Y.: Praeger Publishers.
- Jain, Harish C. and Rick Hackett. 1992. “A Comparison of Employment-Equity and Non-Employment Equity Organizations on Designated Group Representation and Views Towards Staffing.” Canadian Public Administration, Vol. 35, Spring, 103–108.
- Jain, Harish C. and Mohammed Al-Waqfi. 2001. “Racial Discrimination in Employment in Canada.” Industrial Relations in a New Millenium. Selected papers from the XXXVIIth Annual CIRA Conference. Y. Reshef, C. Bernier, D. Harrisson and T. Wagar, eds. Quebec: CIRA, 47–63.
- Jain, Harish C., Parbudyal Singh and Carol Agcos. 2000. “Recruitment, Selection and Promotion of Visible Minority and Aboriginal Police Officers in Selected Canadian Police Services.” Canadian Public Administration, Vol. 42, No. 3, 46–74.
- Jain, Harish C., Peter J. Sloane and Frank Horwitz. 2003. Employment Equity and Affirmative Action: An International Comparison. Armonk, N.Y.: M.E. Sharpe.
- Jones, Reginald. 1997. Task Force Report on “Best” Equal Employment Opportunity Polices, Programs and Practices in the Private Sector. Washington, D.C.: Equal Employment Opportunity Commission.
- Leck, J. D. and D. M. Saunders. 1992. “Canada’s EEA: Effects on Employee Selection.” Population Research and Policy Review, Vol. 11, 21–49.
- Leck, J. D., S. Onge and I. Lalancette. 1995. “Wage Gap Changes amongst Organizations Subject to the Employment Equity Act.” Canadian Public Policy, Vol. 21, 387–400.
- Leonard, J. S. 1983. The Impact of Affirmative Action. U.S. Department of Labor Report.
- Leonard, J. S. 1984. “Employment and Occupational Advance under Affirmative Action.” The Review of Economic Statistics, Vol. 66, 377–385.
- Meng, R. 1987. “The Earnings of Canadian Immigrant and Native Born Males.” Applied Economics, Vol. 19, 1107–1119.
- Muszynski, Leon and Jeffrey Reitz. 1982. Racial and Ethnic Discrimination in Employment. Toronto: Social Planning Council of Metropolitan Toronto, Working Paper #5.
- National Capital Alliance on Race Relations v. Health and Welfare Canada. 1997. Canadian Human Rights Reporter. 28. D/179.
- Ornstein, Michael. 2000. Ethno-Racial Inequality in the City of Toronto: An Analysis of the 1996 Census. Toronto: Institute for Social Research, York University.
- Pendakur, K. and R. Pendakur. 1995. Earnings Differentials among Ethnic Groups in Canada. Ottawa: Strategic Research and Analysis, Department of Canadian Heritage.
- Perinbam, Lewis, Chair. 2000. Embracing Change in the Federal Public Service. A Report by the Task Force on the Participation of Visible Minorities in the Federal Public Service. Ottawa: The Treasury Board of Canada.
- Rajpal, Geeta. 2003. “It’s Tough to Get Canadian Work Experience Abroad.” Toronto Star, March 1.
- Reitz, Jeffery G. and Anil Verma. 1999. Immigration, Ethnicity and Unionization: Recent Evidence from Canada. Toronto: University of Toronto.
- Reitz, Jeffrey G., Liviana Calzavara and Donna Dasko. 1981. Ethnic Inequality and Segregation in Jobs. Toronto: Center for Urban and Community Studies, University of Toronto.
- Samuel, John. 1997. Visible Minorities and the Public Service of Canada. A Report Submitted to the Canadian Human Rights Commission, Ottawa.
- Sloane, Peter, J. and Harish C. Jain. 1990. “Use of Equal Opportunities Legislation in Earnings Differentials.” Industrial Relations Journal, Vol. 21, 221–229.
- Taggar, Simon, Harish C. Jain and Morley Gunderson. 1997. “The Status of Employment Equity Programs in Canada.” Proceedings of the 49th Annual Conference of the Industrial Relations Research Association. Madison, Wisc.: IRRA, 310–320.
- Zureik, E. 1983. The Experience of Visible Minorities in the Work World: The Case of MBA Graduates. Toronto: Ontario Human Rights Commission.
Liste des tableaux
Table 1
Relationship of Composite Occupational Categories Used in 1987-1999 Data Analysis to NOC and SOC Categories
Table 2
Average Internal Equity and VM Employment Equity by Occupational Category and Province, 1987-1999 a (N = 28572)
a Values for internal employment equity are displayed in italics; values for VM employment equity are underlined.
Table 3
Descriptive Statistics for Independent Variables Used in Regression Analysis of the VM Employment Equity Measure, 1987-1999
Table 4
Results of Regression Analysis of the VM Employment Equity Measure, 1987-1999 (N = 28572)
Table 4 (suite)
Adjusted R-Square = .18 F33,28538 191.65 (p < .001)
(r) indicates reference group; the coefficient for this category has been imputed, as discussed in the text. In most instances, the standard error is not readily computable and is not reported.