
Abstracts
Abstract
Globally, over the past few decades, there has been a considerable increase in research on the host country experiences of international students. This is not the case for examinations of university outcomes. As a result, in this article, as a first step, comparisons are made between the academic achievement (GPA), satisfaction, and intent of international students to return to their university as compared to Canadian domestic students at three points in time. First, I show that over several decades there has been little difference in the outcomes of international and domestic students. Second, based on cluster analysis and analyses of covariance, outcomes of contemporary students, as embodied in an “‘adjustment index,”’ are compared and dissected. This procedure shows that while international students suffer from an overall disadvantage in adjustment, there is considerable within group difference. Overall, while there is much room for improvement, the outcomes of international students are hopeful.
Keywords:
- international students,
- university outcomes,
- Canada,
- university adjustment
Résumé
Les dernières décennies ont vu une augmentation considérable dans la recherche sur les expériences des étudiants étrangers dans leur pays d’accueil, et ce à l’échelle mondiale. Ce n’est pas le cas des études sur les résultats universitaires. Par conséquent, dans cet article, comme première étape dans cette démarche, des comparaisons sont faites entre les résultats académiques (MPC), le niveau de satisfaction et l’intention des étudiants internationaux de retourner dans leur université par rapport aux étudiants canadiens à trois moments donnés. Tout d’abord, je démontre qu’au cours de plusieurs décennies, il y a eu peu de différence entre les résultats des étudiants étrangers et ceux des étudiants canadiens. Ensuite, sur la base d’une analyse en grappes et d’analyses de covariance, les résultats des étudiants contemporains, tels qu’ils sont exprimés dans un « indice d’adaptation », sont comparés et décortiqués. Cette procédure démontre que si les étudiants étrangers souffrent d’un désavantage global en matière d’adaptation, il existe des différences considérables au sein du groupe. Dans l’ensemble, bien qu’il y ait encore beaucoup de progrès à faire, les résultats des étudiants étrangers sont encourageants.
Mots-clés :
- étudiants étrangers,
- résultats universitaires,
- Canada,
- adaptation universitaire
Article body
Introduction
International students in Canada are viewed as noncitizens who are given leave to enter the country for the sole purpose of obtaining an education. Depending upon the context, these individuals may also be referred to as “foreign” or “overseas” students. In recent years, research into the campus and community experiences of such individuals has increased. It is otherwise for studies of outcomes in which appropriate controls are imposed for students’ pre-entry characteristics. In view of this lacuna, the current study examines several individual university outcomes measured at different points over the past three decades. In addition, it assesses multiple outcomes embodied in an “adjustment index” for identifiable groups of students. Such groups are defined in terms of domestic/international and generational statuses, sex, and first language.
Overall, I will argue that there is no consistent individual outcome advantage to either domestic or international students over the past three decades. This said, once contemporary students are defined in terms of their domestic/international and generational statuses, sex, and first language, a disadvantage on an adjustment index accrues to international students. However, further analyses point to considerable within group differences. Despite relatively low student adjustment means, most international students demonstrate “acceptable” levels of adjustment.
Background
There have been considerable changes in the regulatory environment of international students in Canada. In the immediate post-WWII period, they were expected to repatriate at the end of their studies (El Masri, 2020; McCartney, 2016). By the turn of the current century, however, conditions had changed. Modifications to Canadian laws made qualification for immigrant status possible (McCartney, 2020, p. 45). Indeed, naturalized international students were increasingly viewed as a means whereby Canada could offset its labour shortages. Also, prohibition against part-time employment was lifted (Choi et al., 2021).
Initially, the tuition fees of international students were the same as their domestic counterparts. By the mid-70s, however, fees in the provinces of Ontario and Alberta became greater for overseas than for domestic students. In the former, in 1996, fees for international students were deregulated (El Masri, 2020, p. 2). Other provinces followed suit. Over the same period, the efforts of cash-strapped Canadian universities to attract international students increased substantially (Buckner et al., 2020). In this endeavour they received support from EduCanada—a joint venture of the federal and provincial governments.
Changes to immigration laws and enhanced recruitment efforts of Canadian universities paid-off. Between 2008 and 2018, the number of international students studying in Canadian colleges and universities tripled. Their proportion of all students increased from 6% to 16%. By contrast, domestic students decreased by 0.5%. In 2018/19, 40% of all university fees ($4 billion) were paid by the 16% of students with international origins (Statistics Canada, 2020b). Reflecting changes in immigration requisites, Statistics Canada figures show that, within 10 years, approximately 30% of international students who entered Canada in 2000 or later became landed immigrants. The number rose to more than half among those with master’s or doctoral credentials.
While the origins of international students are varied, considerable numbers come from just two countries. In 2017/18, China accounted for 28%. A further 23% originated in India. Forty-six percent (46%) of all foreign students study in the province of Ontario (Choi et al., 2021).
Not all disciplines attracted foreign students equally. By way of example, in 2016/17, a plurality of males, 28%, enrolled in business related programs. The figure for females was a slightly higher 30%. The main demand for courses in the humanities and social sciences was by women. However, only 13% and 14% respectively enrolled in these areas (Statistics Canada, 2020a).
Experiences and Outcomes
As a result of deregulation, costs of tuition for international students have soared. Nonetheless, there have been some changes to Canadian laws that are favourable to them. However, research into their campus and community experiences is less encouraging. Suffice it to say that prior to the turn of the 21st century, international students encountered several difficulties. Included were problems of adjustment to a new culture, discrimination, financial concerns, ill-health, accommodation, food selection, social isolation; and lack academic success (Berry & Kostovcik, 1983; Church, 1982; Klineberg & Hull, 1979; Mickle, 1985). While there are exceptions (De Moissac et al., 2020), more recent research confirms the continued presence of these issues (Calder et al., 2016; Chavoshi et al., 2018; Fletcher & Stren, 1989; Ge et al., 2019; Travares, 2021; Wang, 2016; Westwood & Barker, 1990; Zhang & Noels, 2021; Zhou & Zhang, 2014).
Although inquiry into the experiences of international students is growing, research on university outcomes is stagnant (da Silva et al., 2017). In methodologically sound studies of outcomes it is imperative to control for students’ pre-entry characteristics (Rockenbach et al., 2016). Former levels of achievement, first language, and domestic or international status are among these requisites.
Consistent with cultural reproduction theory, each of the foregoing may indicate the acquisition of cultural capital consistent with the mores of university life (Bourdieu & Passeron, 1990; De Graff et al., 2000; Dumais, 2002; Lareau & Weininger, 2003). As a result, if controls for variables such as these are not imposed, we cannot distinguish outcomes resulting from students’ pre-entry characteristics from those attributable to the university experience per se. In North American studies of university outcomes measures of class and/or socioeconomic status are frequently seen as pre-entry characteristics. The underlying assumption is that those of high class or socioeconomic status will have access to financial resources and cultural capital appropriate to university success.
Unfortunately, these measures are culturally bound. They assume students share common ways of defining social position and calculating family income. This is not the case. To use China as an example, research has shown that individuals may view their position in the social structure in different ways than in Europe and North America (Garrison et al., 2023; Wu & Wallace, 2021; Zhou, 2021).
As a result of these possibilities, asking international students to locate themselves and/or their families in a class or socioeconomic framework appropriate to domestic students may result in misleading data. This is particularly true for the recently arrived. In view of this possibility, the OECD (2019) and others (Evans et al., 2022) have developed complex measures of socioeconomic status based on a number of variables. Internationally, the OECD shows that in general those with high status as measured by this construct perform better than others along some academic dimensions. There are, however, several countries that are an exception to this rule. To my knowledge, complex measures of this nature have not been employed in studies of the outcomes of international students in Canada.
Until inclusive measures such as the foregoing are adapted to the circumstances of domestic and international students in Canada, I prefer to play it safe. Instead of relying on class or socioeconomic status per se, I use easily understood possible cultural capital concomitants of class and/or socioeconomic—prior achievement and highest parental education level.
In North America the “college impact” model is the dominant (but not necessarily the most useful) paradigm in analyses of university outcomes. To oversimplify, all else being equal, university outcomes are viewed as a function of students’ formal and informal engagement while pursuing their education (Astin, 1993; Pascarella & Terenzini, 1991, 2005; Rockenbach et al., 2016). For current purposes “engagement” can be viewed as, “the amount of time and effort students put into their studies and other educationally purposeful activities” (NSSE, 2019). Such activities are not restricted to the formal curriculum. They include all interactions with faculty and students in the classroom, on the playing field, or in other university sites.
Overall, we are increasingly aware of many negative campus and community experiences of international students in Canada; however, we know relatively little of many important outcomes like academic achievement (GPA), satisfaction with the university experience, and intention to return to the institution, after controlling for pre-entry characteristics and student engagement. As a result, we are somewhat unaware of the “value added” by the university per se.
There are at least three studies that are exceptions to the foregoing generalization. All focused on students in four Canadian universities—York, the University of British Columbia (UBC), McGill, and Dalhousie.
The first examination was based on a 3-year panel study; however, in this analysis, having controlled for pre-entry characteristics, attention focused on the first year (Grayson, 2008a). The study discovered that:
-
The university engagement of international students was like that of their domestic peers. This finding is inconsistent with some of the Canadian studies of international students’ experiences referenced earlier.
-
Contrary to the college impact model, university engagement was of little consequence for objectively measured university grades.
-
Consistent with the college impact model, the satisfaction levels (a subjective measure) of international and domestic students were positively related to their degree of engagement.
The second study took the analysis further (Grayson, 2011a). Although it involved the same students, they were followed over 3 years of study. In addition, the focus was on the effects of student status (international/domestic) and first-generation position on grades and student satisfaction. This study revealed that:
-
Over 3 years of study, by far, the least positive university experiences were reported not by international students, but by first-generation domestic students.
-
With some qualification, the level of achievement of first-generation domestic students was lower than that of second-generation domestic, and both groups of international students.
-
The college impact model was of some use in the explanation of grades for first- and second-generation domestic students.
-
The college impact model was of little utility in explaining the grades of international students. After controlling for entry grades, academic success or failure derived from other than their level of engagement.
If student engagement does not help explain the GPAs of second-generation international students, what does? A possible answer is provided by a study focusing on students’ “sense of coherence” (SOC) (Grayson, 2008c, 2007).
SOC is defined as:
[A] global orientation that expresses the extent to which one has a pervasive, enduring though dynamic feeling of confidence that (1) the stimuli deriving from one’s internal and external environments in the course of living are structured, predicable, and explicable; (2) the resources are available to one to meet the demands posed by these stimuli; and (3) these demands are challenges, worthy of investment and engagement
Antonovsky, 1987, p. 19
The results of the study revealed that the overall effects of SOC on GPA were greater than the combined effects of institutional and engagement variables.
The third study of relevance in current context examined the experiences of specific racial-cultural groups as identified in students’ first year (Grayson, 2014). After controlling university experiences and first language, the study showed that:
-
There was no uniform distribution among different ethno-racial groups of negative experiences outside of the university. For example, 82% of Canadian-born students of Chinese origin reported being ignored in stores. The lowest percentage, 49%, was for students of South Asian origin.
-
All else being equal, international ESL students achieved slightly lower GPAs than domestic students who were raised speaking English; however, the effect was very small (beta = -0.07).
-
All else being equal, with non-ESL domestic students as the reference group, greatest satisfaction was voiced by domestic ESL students. Once again, the effect was small (beta = 0.07).
-
All else being equal, there was a positive, but small (beta = 0.06), relationship between negative experiences outside of the university and GPA. Negative internal experiences were of no consequence for GPA.
-
All else being equal, there was no relationship between negative external experiences and satisfaction. However, negative internal experiences detracted somewhat from satisfaction (beta = -0.13).
The overall conclusion to the study is as follows. Negative experiences, inside and outside of the university, do not correspond to students’ international or domestic status. They are distributed across different ethno-racial groups. Moreover, the effects of internal and external negative experiences on objectively measured grades and satisfaction are nonexistent or insignificant, both absolutely and statistically. This finding runs contrary to some of the results of some formerly cited studies.
Taken collectively, the three studies above lead to several important conclusions:
-
Differences in the university engagement of domestic and international students are, at best, slight.
-
While there are statistically significant differences in the grades and satisfaction levels of international and domestic students, absolute differences are relatively small.
-
In the best of research worlds, international students should not be viewed as a homogeneous group. There are considerable differences in external and university experiences of different ethno-racial groups. This is true for both domestic and international students.
-
The college impact model is not always useful. It contributes somewhat to the understanding of the grades of domestic, but not of international, students.
-
The college impact model is useful in the explanation of the satisfaction of first- and second-generation domestic students; however, it is of less utility in explanations for international students.
The above studies shed some light on the ways in which, particularly first-generation and domestic/international statuses, affect GPA and satisfaction. Less attention focused on the interactions among GPA, satisfaction, sex, and first language. None of the studies addressed an international student’s commitment to return to studies in a following year as an important university outcome. When addressing these lacunae in the context of university outcomes, it is important to consider the following.
Under certain circumstances (Grayson, 2018), first-generation domestic students have a relative deficit of the kind of cultural capital consistent with university success (Auclair et al., 2008; Grayson, 1997; Speigler & Antje, 2013). A study conducted in Administrative Studies at York University confirmed this was the case for international Chinese students (Grayson, 2011b).
One group of Chinese international students was admitted with very high grades. In their first year they maintained this high level of accomplishment. A second group comprised Chinese international students with similarly high entry grades; however, by the end of first year, their grades had plummeted. The study revealed that the difference between the two groups was the level of cultural capital acquired primarily in the family. More importantly, a re-examination of the data indicated that 100% of the successful students were from families in which at least one parent had completed postsecondary education. The figure for the unsuccessful group was 0%.
Additional Canadian evidence points to an academic disadvantage accruing to students with English as a second language (ESL). This effect was observed for international students per se, those who immigrated to Canada prior to university, and to many ESL students born in Canada (Grayson, 2009). The disadvantage is reflected in relatively low GPAs. Unfortunately, in general, there is little improvement in the language skills of students over the course of their studies (Côté et al., 2020; Grayson, 2008b).
Research Objectives
In view of the foregoing considerations, the current article has two objectives. First, as prelude, adjusting for students’ pre-entry characteristics, one objective is to compare individual outcomes of international and domestic students in a number of Canadian universities over a nearly 30-year time span. (Recall that in the past few decades there has been a change in the regulatory environment of international students.) As a result of this analysis, I will be able to determine if outcomes are static or fluid for each group. The second objective is to examine outcomes combined into in an adjustment to university index. In this endeavour, the connections among contemporary students’ domestic/international and generational statuses, sex, and first language will be considered.
In analysis I will focus on three university outcomes: academic achievement (grade point average or GPA), student satisfaction, and a commitment to return to university to complete studies. The importance of the first outcome is self-evident. It is a raison d'être for the university (Fallis, 2007). Satisfaction with a university experience is a desideratum for both faculty and students. This said, a meta-analysis indicates no connection between satisfaction and student learning (Than & Khaing, 2020).[1] Just the same, Canadian university administrators are very conscious of the satisfaction of their students as reported by Mclean’s Magazine (Grayson, 2020). Many feel that high standings on this dimension will contribute to future enrollment.
A commitment of students to return to their university is another important outcome. If students abandon their studies, they may fail to develop their human potential, and suffer financial loss. The latter is particularly true for international students. In addition, given the costs of recruitment and effective program planning, student defections may contribute to budgetary problems for a university. Although it may seem tautological, all else being equal, research shows that a student’s expression of an intent to return to a university in a following year is the best predictor of them doing so (Grayson & Grayson, 2003).
Information Sources
The information used in the study comes from three sources. The first is surveys of students at York University conducted in 1995, 1996, 1997, and 1998. In the analysis, attention focuses on the 1,848 students who entered in 1994, who were first surveyed in early 1995. Attention was restricted to this first-year group to facilitate comparisons with students in later surveys (more later). In 1995, international students comprised only 3.7% of students studying in Canadian postsecondary institutions (Statistics Canada, 2021). Of this group, 52% identified as Asian (Chui, 1996).
The second source of information is surveys, that over-sampled international students, carried out at York University, UBC, McGill, and Dalhousie in 2005, 2006, and 2007. This study will be restricted to the 1,543 students entering first year in 2005. In that year, 7.8% of all Canadian postsecondary students were international (Statistics Canada, 2021). Fifty-five percent (55%) of those in the sample were from Asia (Statistics Canada, 2016).
The final source of data is surveys conducted at York University, Western University, the University of Toronto, and the University of Waterloo in 2018–19. In this period, international students comprised 17.5% of registrants of colleges and universities (Statistics Canada, 2021). Asia was once again the most common origin. More specifically, 32% originated in China. The same number (32%) were of Indian origin (Statistics Canada, 2022).
As these surveys were cross-sectional, all 1,995 respondents were included in analysis. However, adjustments were made for year of study and university to facilitate comparisons with students in earlier surveys.
Outcomes
One study objective was to examine differences in the individual outcomes of international and domestic students at three points in time. Outcomes of concern were GPA, satisfaction, and intent to return for another year of study. To realize this objective, it was necessary to make several survey-specific adjustments to the data. These adjustments were driven by the fact that the surveys of 2018–19 focused on students in all years of study in the humanities and social sciences. As a result, I was required to work backwards to ensure that effects related to year of study and faculty —arts, science, fine arts, etc.—were minimized in the earlier surveys. I achieved this goal by doing the following.
-
In the survey of 1995, students included in the sample were drawn from every undergraduate faculty at York. As a result, it was necessary to adjust the means of GPA, satisfaction, and intent to return for another year of study. Via an analysis of covariance, GPA was adjusted for having English as a first language, being male, being the first in a family to attend a university (first generation), high school grades, and being in other than an arts or social science program. In analyses of satisfaction and intent to return, GPA was replaced with high school grades.
-
For the survey of 2005, also via an analysis of covariance, I adjusted GPA, satisfaction, and intent to return. For GPA adjustments were made for being male, being first generation, high school grades, having English as a first language, and not being in arts or social science programs. In analyses of satisfaction and intent to return, first year grades replaced high school grades. As surveys were carried out at four universities, I also adjusted for university. In this endeavour, York was the reference category.
-
In the survey of 2018–19, except for the adjustment for faculty (all respondents were in an arts or social science faculty), I made the same adjustments as for the survey of 2005. In addition, I adjusted for year of study. This step was taken because, unlike other surveys, the one for 2018–19 included students from all undergraduate years.
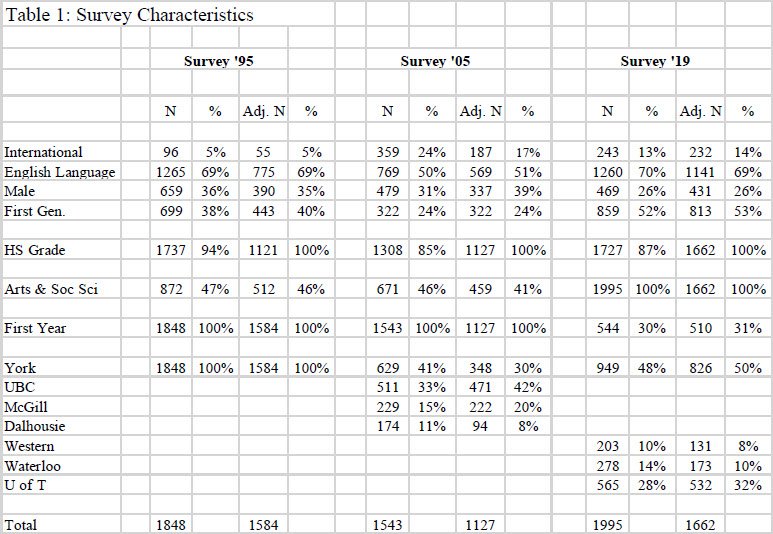
Information on all surveys can be found in Table 1. The “N” column for each survey lists the number of students available prior to adjustments. The “Adj. N” column identifies the number of students in each category after adjustments.
To illustrate, under Survey ’95, 96 (ninety-six) students identified as international. After adjustments, however, with listwise deletion, the number available for analysis reduced to 55. The percentage of total students represented by each number was 5%. For the same survey, prior to adjustments, high school grade information was available for 1,737 students. They represented 94% of the unadjusted total. In the adjusted Adj. N column, with listwise deletion, the number reduced to 1,121. Note that this figure represented 100% of the students available for analysis after adjustments.
In addition to adjusting for independent variables shown in the table, for all surveys, I standardized values of all three independent variables—GPA, satisfaction, and intent to return. I did this for two reasons. First, different universities had different metrics for GPA. By standardizing these measures, I was able to make comparisons between, and adjustments for, universities. Second, my main interest was not in the absolute values of each independent variable. It was in comparisons between international and domestic students at each point in time. Standardized measures were best suited for this task. Third, the wording of the question measuring intent to return was a little different in the final than in the other two surveys. Standardizing replies to this question facilitated comparisons across time. Finally, as will be seen, I developed an overall index of student adjustment based on the three outcomes. Standardization contributed to the understanding of this measure.
The adjusted means for GPA, satisfaction, and intent to return next year, are shown in Graph 1. Note that because outcomes have been standardized, for perspective, the y axis has been set from -1 to +1. These values represent the standard deviation for the variables.
Graph data show that there is little change in the outcomes of international compared to domestic students. In 1995 the adjusted grades of the former were higher than those of the latter. By 2005 they were somewhat lower. In 2018–19 they were the same. In short, there is no consistent pattern.
The pattern for satisfaction is even less variable. In all three surveys there were no differences in the adjusted satisfaction scores of international and domestic students. The only time there was a statistically significant difference in the intent to return next year was in 2018–19. The figure for international students was slightly lower than that of their domestic peers.
The overall conclusion that can be drawn from the data is simple. In three time periods, there was no consistent difference in the outcomes of domestic compared to international students. This stasis must be seen against the backdrop of changing conditions for international students in Canada. While tuition had increased, by 2018–19, they could work part-time to offset expenditures. Moreover, universities were increasingly trying to take better care of their international students. Once they had finished their studies, graduates could apply for Canadian citizenship. Overall, despite changes in the regulatory framework of international students, differences between the outcomes of domestic and international students were slight.
Adjustment to University
My second objective was to assess potential differences in the adjustment of contemporary international and domestic students to university life. In current context, adjustment was defined in terms of attainment of important outcomes. When proceeding in this fashion, I recognized that adjustment is a multidimensional concept. It can include measures of state of mind, interaction, and living up to personal expectations and those of others (Chavoshi et al., 2018).
Instead of focusing on all these possibilities, my intent was modest. My concern was with operationalizing adjustment in terms of the formerly discussed outcomes. In this instance the outcomes in question were: the degree to which a student could achieve grades consistent with prior performance; satisfaction with the university experience; and intent to return the following year. The first was measured by the difference between standardized GPA and the standardized high school grades requisite to acceptance. The second by a student’s expression of their overall satisfaction with the university experience. The third by a manifestation of commitment to return the following year.
Note that the first of these adjustment variables is different from the one utilized in the prior section. The remaining two are the same; however, they are used in different ways. In analyses, I was particularly interested in determining if international/domestic and generational statuses, sex, and first language played a role.
There were several ways in which this objective could be achieved. As my focus was on groups of students, not relationships among variables (as would be the case with, for example, regression), I chose the following route.
Demographic Groups
To pursue my objective, I created demographic groups. In this endeavour I restricted myself to the survey of 2018–19. One of the reasons was that it included a considerable number of international students. In addition, it was recent.
Using this sample, I conduced a two-step cluster analysis available in SPSS. The procedure included international/domestic status, sex, English as a first language, and generational status. This technique groups cases in terms of commonality. In this study, students placed in one group would have more in common with one another than with those in any other group. Statistically significant differences between clusters are determined by conducting discriminant analyses.
I chose the two-step technique rather than procedures such as “k-means” for three reasons. First, although the researcher can experiment with different numbers of clusters, the default setting for two-step automatically calculates the optimal number of groups for the given sample (IBM, n.d.). In k-means this option is unavailable—the number of groups must be specified in advance. Second, two-step provides useful and graphic output. Third, two-step can easily utilize both categorical and continuous data.
The characteristics of the clusters generated in this way, arranged in descending order by size, are described in Table 2. Columns 1, 2, and 3 indicate the allocated cluster number, the percentage of the sample contained therein, and the number of included cases. Columns 4, 5, 6, and 7 display the percentage of students by generation status, first language, sex, and student status (domestic/international).
Note that with the exceptions of clusters 8 and 11, all are homogeneous on each of the foregoing four variables. By comparison, cluster 8 comprises 76% first-generation and 58% female students. Cluster 11 includes 53% first-generation students. Despite this lack of homogeneity, it is standard practice to characterize clusters by their dominant characteristics.
The silhouette measure of cohesion and separation (SMSA) for the analysis was 1 (excellent). A discriminant analysis showed between cluster differences to be statistically significant.
Adjustment Index
For current purposes, positive values on each of difference between high school and anticipated grade for the current year of study; student satisfaction; and intention to return for the following year, can be viewed as an indication of adjustment to university. As a result, I combined each into an overall index of “student adjustment.” As part of this process, for consistency with prior analyses, via an analysis of covariance, I adjusted for university (York referent) and year of study.
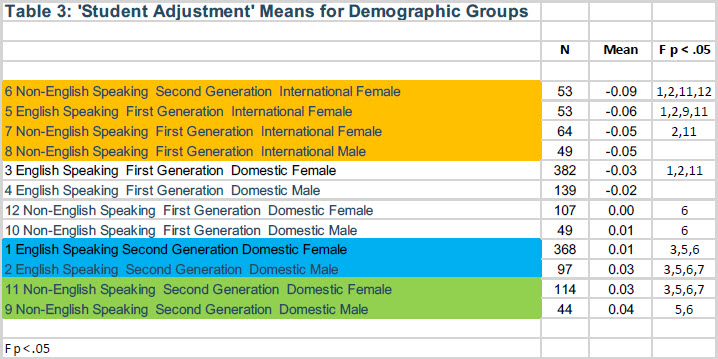
The resulting means are shown in Table 3. Note that they have been sorted from low to high. Also, to facilitate identification, all categories including international students are coloured brown. Groups with the highest scores are highlighted green. The groups with a potential cultural capital advantage (English speaking, second generation, domestic males and females) are coded blue.
Differences in the overall distribution are significant. Also, as shown in the final column, multiple range tests (Bonferroni) point to several statistically significant differences between groups. The figures in the final column identify the clusters significantly different from the referent. Thus, cluster 10 is statistically significant from 6.
In examining these differences, it is important to consider that statistical significance is a function of both effect and sample size. I say this because similar means do not always translate into statistically significant differences. For example, groups 7 and 8 have the same mean -0.05; however, while 7 is distinct from groups 2 and 11, group 8 is not. Part of the explanation can be found in the smaller sample size of 8–49 compared to 64.
It is not necessary to explore in detail differences between and among all groups in the table. Suffice it to say that, in addition to overall differences in the table being statistically significant:
-
The student adjustment means for international groups are low.
-
There are statistically significant differences between the low adjustment scores of international students (brown coloring) and many other individual domestic groups.
-
Groups with the highest adjustment scores include domestic males and females whose first language was other than English. Put differently, having English as a first language conferred no particular advantage.
-
As a corollary to 3, students with a presumed advantage in cultural capital (English speaking second generation domestic males and females) were not characterized by the highest adjustment scores.
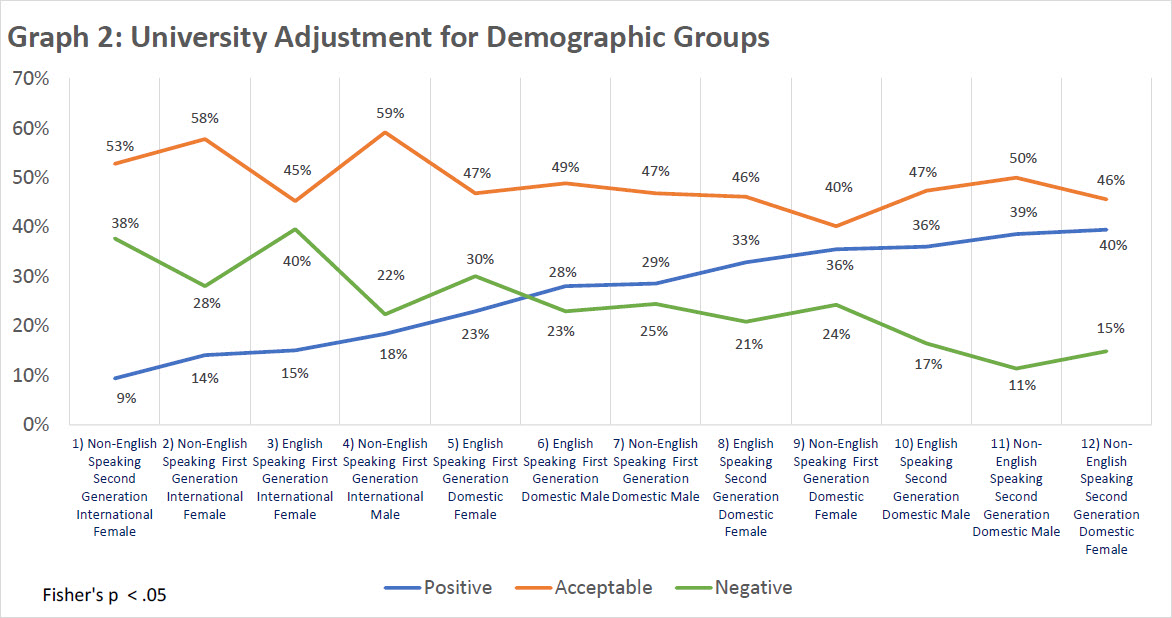
To pursue these differences further, I conducted a two-step univariate cluster analysis of the student adjustment variable. This procedure resulted in the identification of three groups. The mean values of each were -0.20 (24%), -0.02 (49%), and 0.16 (28%). The SMSA was 0.7, or good. A discriminant analysis showed differences to be statistically significant. In Graph 2, these values are labelled “low,” “acceptable,” and “high.” Figures presented in the graph are sorted in ascending order by percent positive.
The first pattern of importance is that despite the overall low adjustment scores of international students in Table 2, in three of the international groups in Graph 2 (1, 2, and 4), a majority of international students—53%, 58%, and 59% respectively—manifest acceptable adjustment levels. The figure for the fourth group is 45%. These figures are not completely out of line with those of domestic groups. Indeed, the single largest percentage of all demographic groups manifest acceptable adjustment.
Z-tests for the acceptable group support the foregoing. With the exceptions of groups 3 and 4, individual differences between none of the other groups are statistically significant. While groups 3 and 4 differ from all the rest, the difference between the two are not statistically significant.
Although there are degrees of similarity between international and domestic students in the percentages of students with acceptable adjustment, all four international groups show low levels of positive adjustment—9%, 14%, 15%, and 18% respectively. The rates are higher for all others, each of which is domestic.
Negative adjustment figures make up the difference between the acceptable and positive scores. Notably, after group 6, the percentages of students with negative adjustment are lower than those with positive and acceptable adjustment.
The foregoing figures clearly indicate that, overall, international students’ levels of adjustment are lower than those of domestic students. This said, a majority or plurality of all four groups of international students manifest acceptable levels of adjustment. In this regard, they are like their domestic peers. Overall, although international groups, as in Table 3, manifest low mean adjustment scores, Graph 2 points to considerable within group variation.
In sum, despite all groups having a large percentage of students showing acceptable adjustment, those with international status display the least positive adjustment. To this extent, international status trumps first language, generation, and sex.
To provide further perspective I examined the distribution of adjustment levels based only on international and domestic status. Among domestic students, 30%, 48%, and 23% were positive, acceptable, and negative respectively. The corresponding figures for international students were 15%, 55%, and 31%. Overall differences were statistically significant (Fisher’s p < .05). In total, there were 15% more domestic than international students in the positive category. In the acceptable and negative classifications international students outnumbered domestic ones by 7% and 8%. Overall, 24% of students were classified as negative.
In view of these findings, universities might set themselves two objectives. The first would be to take steps to close the 8% negative adjustment gap between domestic and international students. The provision of assistance to all 24% negative adjusters (that would include the 8%) could be a second objective. The measurement of progress towards these ends must be based on non-standardized variables. The nature of standardized variables is such that they would always produce some group means below zero.
Conclusion
Against the background of a changing regulatory environment, the current article had two objectives. The first was to see if, over approximately three decades, individual outcomes of international students were different from those of their domestic peers. Of concern in this context were GPA, satisfaction, and intent to return.
The second objective was to identify the outcomes, as embodied in an adjustment index, of specific groups of contemporary students defined by their sex, generational and international statuses, and first languages. In this endeavour the difference between high school grades, or their equivalent, and GPA, was of concern. As above, the other two outcomes were satisfaction and intent to return. In analyses, means for the foregoing comprised an adjustment index.
In reaching objectives of the research reliance was placed on the results of two longitudinal and one cross-sectional survey conducted in seven Canadian universities. In analyses, adjustments were made to facilitate comparisons across studies.
With reference to the first objective, there was no consistent pattern between, on the one hand, international/domestic status, and, on the other hand, GPA, satisfaction, and intent to return. Put differently, the collective results suggest more similarity than difference in the outcomes of international and domestic students over approximately three decades. In the same period, restrictions on employment for international students were removed; international students were provided a fast-track for immigration; and universities made available more services than formerly. Simultaneously, tuition fees increased substantially. Unfortunately, there was little change in the ways in which students experienced their communities and campuses.
Despite similarities in outcomes noted above, analyses for the second objective pointed to nuanced differences between outcomes for domestic and international students expressed in an adjustment index. When groups of contemporary students were defined in terms of domestic/international and generational statuses, sex, and first languages, clear differences emerged in adjustment indexes. Compared to their domestic counterparts, the mean adjustment indexes of different groups of international students were low. However, further analysis indicated that despite differences in means, there was considerable within group diversity.
More specifically, although all groups of international students had relatively low adjustment index means, a majority or plurality in each group manifested an acceptable degree of adjustment. Indeed, the numbers of international students with acceptable adjustment were comparable to those of their domestic counterparts. Where the two groups differed was in the number of positive and negative adjusters. For domestic groups, the number of the former was high. Correspondingly, the number of negative adjusters was relatively low. The opposite was the case for international students. Overall, for student adjustment, international/domestic status was more important than generational, sex, and first language statuses.
To return to the questions asked in the title of this article: How are international students in Canada doing? Are the outcomes of their university sojourns satisfactory? Clearly, responses are likely to differ. For example, an international student will probably answer this question in a different way than a tenured full professor. As the latter I can say that international students are not doing well as some groups of domestic students. Nonetheless, all things considered, they are doing reasonably well. Of course, there is room for improvement.
Limitations
This study has at least four imitations:
-
The current study was based on surveys conducted in seven universities; however, we cannot assume that its results can be generalized to all Canadian institutions. Generalizations must be based on national probability samples.
-
In some cases, numbers did not permit identification of the national origins of international students. As a result, it is difficult to say, for example, if international students showing negative adjustment came from specific parts of the world.
-
The numbers of international students included in the sample of 1995 were few.
-
Although data were available, the absolute numbers of international students involved in the surveys were too small to sustain examinations of disciplinary differences in outcomes and adjustment.
Adjustment to university is a complex concept. In this study it was operationalized in terms of university outcomes. It is quite possible that other approaches would lead to different findings and conclusions.
Appendices
Appendix
Table 1
Graph 1

Table 2
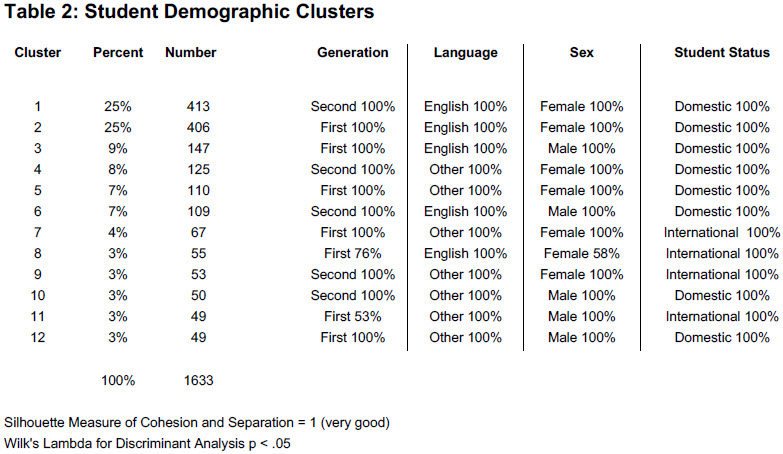
Table 3
Graph 2
Biographical note
J. Paul Grayson is a professor of sociology at York University in Toronto. He has conducted research on social movements in Canada, the sociology of Canadian literature, plant closures, work and health, postsecondary educational outcomes in Canada and the United States, and the ranking of universities in Canada and Britain.
Note
-
[1]
This well-done article was the only meta-analysis I could find on the subject. Unfortunately, although hard-copy is available in several university libraries, the article is difficult to locate on the web. It can, however, be obtained free of charge via Research Gate. Difficulty of access may reflect the hurdles encountered by social scientists in the Global South when attempting to disseminate their work.
Bibliography
- Antonovsky, A. (1987). Unraveling the mystery of health. Jossey Bass.
- Astin, A. (1993). What matters in college? Jossey Bass.
- Auclair, R., Belanger, P., Doray, P., Gallien, M., Groleau, A., Mason, L., & Mercier, P. (2008). Research paper 2— first-generation students: A promising concept? Canadian Millennium Scholarship Foundation.
- Berry, J. W., & Kostovcik, N. (1983). Psychological adaptation of Malaysian students in Canada. Third Asian
- Regional Conference of the International Association for Cross–Cultural Psychology, University of Malaysia, Bangi, Malaysia.
- Bourdieu, P., & Passeron, J. C. (1990). Reproduction in education, society and culture. Sage.
- Buckner, E., Scott, C., Marroquin, A., & Zhang, Y. (2020). Strategic benefits, symbolic commitments: How Canadian colleges and universities frame internationalization. Canadian Journal of Higher Education, 50(4), 20–36.
- Calder, M. J., Richter, S., Mao, Y., Kovacs Burns, K., Mogale, R. S., & Danko, M. (2016). International students attending Canadian universities: Their experiences with housing, finances, and other issues. Canadian Journal of Higher Education, 46(2), 92–110.
- Chavoshi, S., Wintre, M. G., Dentakos, S., & Wright, L. (2018). A developmental sequence model to university adjustment of international undergraduate students. Journal of International Students, 7(3), 703–727.
- Choi, Y., Crossman, E., & Hou, F. (2021). International students as a source of labour supply: Transition to permanent residency. Statistics Canada.
- Chui, T. (1996). International students in Canada. Educational Quarterly Review, 3(3), 42–48.
- Church, A. T. (1982). Sojourner adjustment. Psychological Bulletin, 91(May), 540–572.
- Côté, J. E., Grayson, J. P., Roberts, S., & Chen, L. H. (2020). Beyond HEQCO’s skills assessments: Validation of a measure of students’ academic capital and evidence of grade inflation in Ontario’s high schools and universities. Canadian Journal of Educational Administration and Policy, 194, 16–38.
- da Silva, T., Zakzanis, K., Henderson, J., & Ravindran, A. V. (2017). Predictors of post-secondary academic outcomes among local-born, immigrant, and international students in Canada: A retrospective analysis. Canadian Journal of Education, 40(4), 544–575.
- De Graff, N. D., De Graff, P. M., & Kraaykamp, G. (2000). Parental cultural capital and educational attainment in the Netherlands. Sociology of Education, 73(2), 92–111.
- De Moissac, D., Graham, J. M., Prade, K., Rokhays Gueye, N., & Rocque, R. (2020). Mental health status and help-seeking strategies of international students in Canada. Canadian Journal of Higher Education, 50(4), 52–71.
- Dumais, S. (2002). Cultural capital, gender, and school success: The role of habitus. Sociology of Education, 75(January), 44–68.
- El Masri, A. (2020). International education policymaking: A case study of Ontario’s Trillium Scholarship Program. Canadian Journal of Higher Education, 50(4), 1–19.
- Evans, O., McGuffog, R., Gendi, M., & Rubin, M. (2022). A first-class measure: Evidence for a comprehensive social class scale in higher education populations. Research in Higher Education, 63(8), 1427–1452.
- Fallis, G. (2007). Multiversities, ideas, and democracy. University of Toronto Press.
- Fletcher, J., F., & Stren, R. E. (1989). Language skills and adaptation: A study of foreign students in a Canadian university. Curriculum Inquiry, 19(3), 293–308.
- Garrison, Y. L., Park, S., Yeung, C. W., Li, Z., Ho, Y. C., & Chang-Tran, J. (2023). The social class worldviews of Chinese international students in the United States. Journal of International Students, 13(1), 40–58.
- Ge, L., Brown, D., & Durst, D. (2019). Chinese international students’ experiences in a Canadian university. Journal of International Students, 9(2), 582–612.
- Grayson, J. P. (1997). Academic achievement of first-generation students in a Canadian university. Research in Higher Education, 38(6), 659–676.
- Grayson, J. P. (2007). Sense of coherence, problem freedom and academic outcomes of Canadian domestic and international students. Quality in Higher Education, 13(3), 215–236.
- Grayson, J. P. (2008a). The experiences and outcomes of domestic and international students at four Canadian universities. Higher Education Research and Development, 27(3), 215–230.
- Grayson, J. P. (2008b). Linguistic capital and academic achievement of Canadian‐and foreign‐born university students. Canadian Review of Sociology, 45(2), 127–149.
- Grayson, J. P. (2008c). Sense of coherence and academic achievement of domestic and international students: A comparative analysis. Higher Education, 56(4), 473–492.
- Grayson, J. P. (2009). Language background, ethno‐racial origin, and academic achievement of students at a Canadian university. International Migration, 47(2), 33–67.
- Grayson, J. P. (2011a). Cultural capital and academic achievement of first generation domestic and international students in Canadian universities. British Educational Research Journal, 37(4), 605–630.
- Grayson, J. P. (2011b). Cultural capital and achievement of Chinese international and Canadian domestic students in a Canadian business programme. The International Journal of Management Education, 9(2), 13–24.
- Grayson, J. P. (2014). Negative racial encounters and academic outcomes of international and domestic students in four Canadian universities. Journal of International Students, 4(3), 262–278.
- Grayson, J. P. (2018). The ‘first generation’ in historical perspective: Canadian students in the 1960s. Journal of Historical Sociology, 31(4), 512–525.
- Grayson, J. P. (2020). The emperor’s new clothes: Maclean’s, NSSE, and the inappropriate ranking of Canadian universities. Canadian Journal of Higher Education, 14–35.
- Grayson, J. P., & Grayson, K. (2003). Research on retention and attrition. Canadian Millennium Scholarship Foundation.
- IBM. (n.d.). Two step cluster analysis. https://www.ibm.com/support/knowledgecenter/en/SSLVMB_24.0.0/spss/base/idh_twostep_main.html
- Klineberg, O., & Hull, W. F. (1979). At a foreign university: An international study of adaptation and coping. Praeger.
- Lareau, A., & Weininger, E. (2003). Cultural capital in educational research: A critical assessment. Theory and Society, 32, 567–606.
- McCartney, D. M. (2016). Inventing international students: Exploring discourses in international student policy talk, 1945–75. Historical Studies in Higher Education, 28(2).
- McCartney, D. M. (2020). Border imperialism and exclusion in Canadian parliamentary talk about international students. Canadian Journal of Higher Education, 50(4), 37–51.
- Mickle, K. (1985). The adaptation of Hong Kong students to Canada. University of Toronto—York University Joint Center on Modern Asia.
- NSSE. (2019). NSSE's conceptual framework (2013) http://nsse.indiana.edu/html/conceptual_framework_2013.cfm
- OECD. (2019). PISA 2018 results (Volume II). https://doi.org/doi:https://doi.org/10.1787/b5fd1b8f-en
- Pascarella, E., & Terenzini, P. (1991). How college affects students. Jossey-Bass.
- Pascarella, E., & Terenzini, P. (2005). How college affects students (Vol. 2). Jossey Bass.
- Rockenbach, A. N., Pascarella, E. T., Wolniak, G. C., Mayhew, M. J., Bowman, N. A., Terenzini, P. T., & Seifert, T. A. D. (2016). How college affects students: 21st century evidence that higher education works. Jossey-Bass.
- Speigler, T., & Antje, B. (2013). First-generation students: What we ask, what we know and what it means. International Studies in Sociology of Education, 23(4), 318–337.
- Statistics Canada. (2016). International students in Canadian universities, 2004–2005 to 2013–2014. https://www150.statcan.gc.ca/n1/daily-quotidien/161020/dq161020e-eng.htm
- Statistics Canada. (2020a). International student enrolments at Canadian public colleges and universities, 2017/2018. https://www150.statcan.gc.ca/n1/pub/11-627-m/11-627-m2020006-eng.pdf
- Statistics Canada. (2020b). International students accounted for all of the growth in postsecondary enrolments in 2018/2019. https://www150.statcan.gc.ca/n1/en/daily-quotidien/201125/dq201125e-eng.pdf?st=6rC02QMA
- Statistics Canada. (2021). Postsecondary enrolments, by registration status, institution type, status of student in Canada and gender. https://www150.statcan.gc.ca/t1/tbl1/en/tv.action?pid=3710001801&pickMembers%5B0%5D=2.1&pickMembers%5B1%5D=5.1&pickMembers%5B2%5D=7.1&pickMembers%5B3%5D=4.1&pickMembers%5B4%5D=6.1&cubeTimeFrame.startYear=2011+%2F+2012&cubeTimeFrame.endYear=2019+%2F+2020&referencePeriods=20110101%2C20190101
- Statistics Canada. (2022). Postsecondary enrolments, by International Standard Classification of Education, institution type, Classification of Instructional Programs, STEM and BHASE groupings, status of student in Canada, age group and gender. https://www150.statcan.gc.ca/t1/tbl1/en/tv.action?pid=3710016301
- Than, W. W., & Khaing, N. N. (2020). A meta-analysis of factors influencing student satisfaction in higher education. Journal of the Myanmar Academy of Arts and Science, 18(9B), 393–404.
- Travares, V. (Ed.). (2021). Multidisciplinary perspectives on international student experience in Canadian higher education. IGI Global.
- Wang, F. (2016). The lived experiences of Canadian-born and foreign-born Chinese Canadian post-secondary students in Northern Ontario. Journal of International Students, 6(2), 451–477.
- Westwood, M. J., & Barker, M. (1990). Academic achievement and social adaptation among international students: A comparison groups study of the peer-pairing program. International Journal of Intercultural Relations, 14, 251–263.
- Wu, Q., & Wallace, M. (2021). Hukou stratification, class structure, and earnings in transitional China. Chinese Sociological Review, 53(3), 223–253.
- Zhang, Y. S. D., & Noels, K. (2021). The frequency and importance of accurate heritage name pronunciation for post-secondary international students in Canada. Journal of International Students, 11(3), 608–627.
- Zhou, G., & Zhang, Z. (2014). A study of the first-year international students at a Canadian university: Challenges and experiences with social integration. Canadian and International Education, 43(2), Article 7.
- Zhou, Y. (2021). The trajectory of subjective social status and its multiple determinants in contemporary China. Chinese Journal of Sociology, 7(4), 557–574.
List of figures
Graph 1
Graph 2
List of tables
Table 1
Table 2
Table 3