
Abstracts
Abstract
A procedure for developing and testing measurement scales for use in cross-cultural comparative management research is described. The procedure emphasizes the combination of adequate instrument design if a new instrument is used or adequate adaptation procedures if working with an existing instrument and state-of-the-art statistical analyses (notably multigroup confirmatory factor analysis) to test the adequacy of the scales in all groups. The procedure is illustrated in a study of competitive orientation among French, Mexican, US and Italian employees of multinational corporations.
Keywords:
- comparative research,
- measurement equivalence,
- scale development procedure
Résumé
Nous décrivons une procédure qui permet de développer et tester des échelles de mesure dans le contexte de recherches comparatives inter-culturelles en management. Cette procédure englobe des principes de conception des items dans le cas de création d’échelles, ou d’adaptation, en cas d’utilisation d’instruments existants, ainsi que des analyses statistiques (et notamment l’analyse factorielle confirmatoire multigroupes) pour tester la pertinence des échelles dans tous les groupes. Cette procédure est illustrée dans une étude de l’esprit de compétition auprès de salariés français, mexicains, américains et italiens travaillant dans des entreprises multinationales.
Mots-clés :
- recherche comparative,
- équivalence de mesure,
- procédure de création d’échelles de mesure
Resumen
En este articulo, se describe un procedimiento para desarrollar y probar escalas de medida, en el contexto de la investigación comparativa transcultural en gestión. Este procedimiento incluye los principios de elaboración en el caso de creación de escalas, o los principios de adaptación, en caso de uso de instrumentos existentes, y análisis estadísticos (incluyendo el análisis factorial confirmatorio multigrupo) para poner a prueba la pertinencia de las escalas en todos los grupos. Este procedimiento se ilustra en un estudio sobre el espíritu competitivo aplicado a una muestra de empleados franceses, mexicanos, italianos y americanos de empresas multinacionales.
Palabras clave:
- investigación comparativa intercultural,
- la equivalencia de medición,
- elaboración de escalas de medición
Article body
Comparative organizational research consists of the systematic detection, identification, measurement and interpretation of similarities and differences of organizational behavior among employees of different cultural groups (Adler, 1983; Boddewyn, 1965). During the past decades, there has been a growing body of literature addressing the specific methodological problems of this type of research, such as the equivalence of constructs, samples, and measurement instruments. Meaningful cross-group comparisons presuppose that the measurement instruments used to assess attitudes, values or behaviors, operate in an equivalent way across groups (i.e., that they measure the same thing in the same way). This is usually called measurement equivalence. If measures are not equivalent, interpretations of differences in mean levels or in the pattern of correlation of the measures are potentially artifactual and may yield misleading or even incorrect results (Mullen, 1995). In case of severe lack of measurement invariance, substantive comparisons cannot be performed, possibly even requiring the collection of new data (Vandenberg, 2002).
Prior to a further description of the present article, a word on terminology is needed. The field of comparative studies uses a set of terms such as equivalence in multiple ways (e.g., Johnson, 1998). In order to avoid terminological confusion, we define two key terms here. “Measurement equivalence” refers here to scales and to the issues related to designing and examining whether instruments work the same way in different cultures, whereas “measurement invariance” is narrower and refers here to the statistical tests designed to verify the measurement equivalence of scales. Issues regarding measurement equivalence are getting more and more popular in organizational research after the publication of several state-of-the art articles on the topic (e.g., Cavusgil & Das, 1997; Hui & Triandis, 1985; A. W. Meade & Lautenschlager, 2004a; Peng, Peterson, & Shyi, 1991; Reise et al., 1993; Schaffer & Riordan, 2003; Singh, 1995; Steenkamp & Baumgartner, 1998; Vandenberg, 2002; Vandenberg & Lance, 2000). However, those articles focus principally on the statistical methods and procedures for assessing measurement invariance, rather than on how to develop multigroup equivalent measures. The approach described in the present article incorporates equivalence issues in the scale development process. Our aim is to describe a step-by-step procedure for developing measures that are more likely to provide comparable scores in cross-group comparisons. All the steps of scale development procedures are addressed from the perspective of ensuring the equivalence of the concept to be measured; recommendations on how to deal with invariance problems are discussed.
We extend extant work in three ways. First, we integrate measurement equivalence issues in each step of classical scale development procedures whereas previous work mainly described some of the steps implied in scale development and validation. Second, we suggest that invariance issues could be addressed on theoretical grounds, whereas existing research often proceeded in a data-driven fashion. Third, we explain how to deal with invariance problems, whereas the existing literature focuses more on the identification of these problems.
In the first section, we briefly present the conceptual background of cross-cultural measurement equivalence. In the second section, we describe a scale development procedure that can be useful both in the context of a derived-etic approach (the researcher needs to develop a measurement scale in the context of a comparative study) and in the context of an etic approach (the researcher decides to use an existing scale for a cross-group comparison and wants to assess whether the scale is suitable for all the groups under study).
Conceptual Background
Validity, Reliability, and Measurement Equivalence
Measurement is a vital concern for all researchers in social sciences. The quality of a measure is generally assessed by its validity and reliability. The validity of a measure has been defined as “the extent to which an operationalization measures the concept it is supposed to measure” (Bagozzi, Yi, & Phillips, 1991: 421), whereas reliability is the proportion of variance of the obtained score attributable to the true score of a latent variable (De Vellis, 2003). Hence, the goal of our procedure is to develop measures which are equally valid and reliable for all the populations under study. Two measures applied to different groups are fully equivalent if the relationships between the observed score and the true score are identical for all groups. This essentially implies that the concept involves the same domain in all groups (true scores), and that the items composing the scale are equally appropriate in measuring the construct (observed scores).
When is Measurement Equivalence an Issue?
In which cases are group comparisons most likely to be threatened by a lack of measurement equivalence? Existing articles on measurement equivalence do not clearly address this issue. Vandenberg and Lance (2000) suggest that equivalence tests should be performed when comparing different “populations” or “groups”, whereas other authors refer to “cultural groups”, “cultural samples” (e.g., Schaffer & Riordan, 2003; Vandenberg, 2002), “cross-national” groups (Steenkamp & Baumgartner, 1998) or “ethnic groups within countries” (Van de Vijver, 1998). As suggested by Meade and colleagues (Meade, Michels, & Lautenschlager, 2007), tests of measurement invariance (the generic term for such equivalence in the research tradition that uses structural equation modeling for these tests) have often proceeded in an atheoretical fashion in that between-group comparisons are made without a priori notions of whether equivalence would exist.
What we suggest here is that lack of measurement invariance can be particularly expected in cases when the two groups of individuals being compared are different in a characteristic which is related to the variables being compared between the groups. So, more equivalence threats can be expected in studies dealing with more dissimilar groups. Cultural groups have often been described in terms of their position (low vs. high) on a series of cultural dimensions (Hofstede, 2001; Lytle, Brett, Barsness, Tinsley, & Janssens, 1995; Morden, 1999). Such groups can be expected to vary on a certain construct (e.g., attitude towards participative management), when they are different in terms of a cultural dimension (e.g., power distance) that is likely to influence that construct (Lytle et al., 1995).
As an example, Wasti and colleagues (Wasti, Bergman, Glomb, & Drasgow, 2000) tested the generalizability of a model of the antecedents and consequences of sexual harassment developed in the US and applied to Turkish employees. The authors considered that tests of equivalence were necessary because Turkey is notably different in its “cultural, political, and economic orientation toward women, as compared with the US” which could have implications for the adequacy of the measures (Wasti et al., 2000: 767). In the case of a comparison between Swedish and Norwegian employees, measurement equivalence would be more likely to occur because of the strong similarity between these two countries concerning women issues. However, when possible (i.e. when sample size is large enough) measurement equivalence should always be assessed as a prerequisite to any group-based comparisons. When it is not possible, possible limitations in the validity of the substantive comparative results should be acknowledged.
Etics, Emics, and Derived-Etics
Three different research approaches have typically been used in cross-cultural organizational research to measure concepts and deal with equivalence. Most frequently (94% of the studies reviewed by Schaffer & Riordan, 2003), researchers start by using a concept and/or instrument developed within the frame of reference of one specific country (the US or another western country). Scales are subsequently translated and assumed to be a valid basis for comparison with other countries (Berry, 1989; Harkness, Van de Vijver, & Johnson, 2003). This etic (or imposed-etic) approach is the most widely used because it requires the fewest financial and time resources (Schaffer & Riordan, 2003) and because most researchers seek to produce generalizations across the cultural groups under study (Berry, 1989). The etic approach has been criticized on conceptual grounds in that a construct and its operationalization may not be valid for another group, which can lead to misleading comparisons.
The emic approach, on the other hand, attempts to define and operationalize a phenomenon occurring in a particular culture utilizing only insights from that culture. A researcher adopting an emic approach may obtain a very accurate within-culture description and insight but can easily run into equivalence problems when emically obtained data are compared across cultures (Davidson, Jaccard, Triandis, Morales, & Diaz-Guerrero, 1976). For example, a researcher can ask for culture-specific indicators of customer satisfaction in different countries. There is a fair chance that such emically developed instruments lack cross-cultural comparability because of cultural differences in what satisfies customers in different groups (e.g., Laroche, Ueltschy, Abe, Cleveland, & Yannopoulos, 2004).
Because of the drawbacks of both emic and etic approaches, researchers increasingly consider a derived-etic approach (or combined emic-etic approach; Cheung, Van de Vijver, & Leong, 2011) as a best practice that offers scope for both universal and culture-specific aspects of measures (Schaffer & Riordan, 2003). Such an approach amounts to first attaining emic knowledge about all the cultures in the study and then retaining the communality as the basis for comparisons (Berry, 1989). The main strength of this approach is the attention for both ecological validity (by designing the measures on the basis of locally obtained information) and cross-cultural comparability. In this recommended approach, the quest for equivalence starts from the beginning of the research process and not right after data are collected (Usunier, 1998).
Scale Development Procedure
Step 1. Specify the Domain of the Construct – Construct Equivalence
The first important step in a process of measurement development is to determine clearly what one wishes to measure: “The researcher must be exacting in delineating what is included in the definition and what is excluded” (Churchill, 1979: 67). In comparative research, it is important to establish whether the construct exists in all groups and if the core and boundaries of the phenomenon are the same (Cavusgil & Das, 1997). Unfortunately, many researchers tend to address this issue only in a post hoc fashion at the stage of measurement invariance analysis (Hambleton, 2001; Peng, Peterson, & Shyi, 1991; Singh, 1995). We suggest that construct equivalence should be addressed in the first stages of the research process. Construct equivalence (also referred to as conceptual/functional equivalence) concerns the similarity of the definition of the concept, but also the similarity of the determinants, consequences, and correlates (Hui & Triandis, 1985). Various procedures can be used to assess construct equivalence, such as an inspection of the literature, collaboration with colleagues from other countries, interviews and focus groups with individuals from the groups under study, to find out whether the concept exists in all the subgroups and which components are universal and culture-specific.
Step 2. Generate Items – Cultural Equivalence
The items of a scale should adequately cover the domain of the concept. In single-group research, construct coverage can be established by open-ended interviews with representative subjects from the target population so that items can be derived from the transcripts of the interviews, thereby ensuring the natural context and word choice (Churchill, 1979; Dawis, 1987). Reviews of existing literature on the concept under study and of existing measures are other often used methods. In the latter case, items may have to be modified or rewritten to ensure cultural adequacy and to establish consistency in tone and perspective across all items (Bolino & Turnley, 1999). Recommendations on item writing, such as the need to write simple items and to avoid double barreled items and items that refer to more than one concept hold a fortiori in cross-cultural research.
In cross-cultural research the same process should be conducted for each group separately and potential indicators be listed. In a second step, indicators will be selected in order to ensure that only items that are good indicators for all groups are retained. In order to maximize equivalence, it might be necessary to remove the cultural particulars. Imagine the case of a researcher who wants to develop a measure of the importance of prestige in several countries with large differences in economic development. In a poor country “Owning a watch” could be considered as an indicator of prestige which would not be the case in rich countries. Therefore, the use of more generic items such as “Success in my work is important for me” should be preferred because even if success can be conceived differently by different groups, it is more likely to be a good indicator of prestige than owning a watch.
Items of the initial pool may have to be reformulated to maximize their translatability. Brislin (1986) described guidelines aimed to ensure that the translators will clearly understand the meaning of the original language item, to have a high probability of finding a readily available target language equivalent, and to produce readily understandable target language items. Examples of such guidelines are to use simple, short sentences, to employ the active rather than the passive voice, and to repeat nouns instead of using pronouns. Even if existing tests are employed, items may require modifications so as to maximize their adequacy in the new cultural groups or new items may need to be added to tap into additional aspects of a phenomenon not covered by the original test (Brislin, 1986).
Another challenge facing scale developers concerns such response effects as social desirability or acquiescence. A possible way to reduce acquiescence involves the use of balanced scales with equal number of positively and negatively worded items (Billiet & McClendon, 2000; Smith, 2003). However, there is some evidence that negatively-worded items can reduce the validity of measures and introduce systematic error (Hinkin, 1995). In fact, reversals in item polarity may be confusing to some respondents, especially when completing long surveys (De Vellis, 2003) or when the degree of motivation in participating in the survey is low (Barnette, 2000). As a consequence, negatively worded items should be used with care or other techniques, such as using a bidirectional response set of alternatives (Barnette, 2000) can also be implemented.
Step 3. Translate and/or Adapt Items – Linguistic Equivalence
This step concerns mainly but not exclusively studies involving multiple languages. Even when a survey instrument is administered to different groups using the same language (e.g., English), it is important to ascertain that the vocabulary and the language style are familiar to all groups. For instance, De Vellis (2003) reports examples showing that the same word can have different meanings in different English-speaking countries and even within the same country.
Translation issues are one of the most frequently mentioned problems in the literature dealing with empirical comparative research (Harkness, 2003). Translation equivalence comprises different categories (Usunier, 1998). Evidence for lexical equivalence or similarity of denotation is provided by dictionaries. Grammatical-syntactical equivalence deals with original and translated text similarities and how word order and other grammatical features are used to convey meaning. Finally, experiential equivalence is about what words and sentences mean for people in their everyday experience. For example, “manger des pâtes” (eating pasta) has an opposite affective meaning in France and in Italy. Whereas in France this means having a cheap meal, in Italy, “mangiare la pasta” represents more the idea of a good meal.
Different procedures have been proposed to translate instruments. We discuss here the most common ones. The most widely used method is the back-translation technique (Harkness, 2003; Usunier, 1998). One bilingual translates from the source to the target language, and another blindly translates back to the source. The accuracy of the translation is evaluated by comparing the original and back-translated versions. Nontrivial differences between the versions are seen as evidence of translation problems. The procedure can be iteratively repeated for several rounds and a final target-language questionnaire is discussed and prepared by the researcher and the two translators (Brislin, 1986; Usunier, 1998; Van de Vijver & Leung, 1997). The back-translation technique has many advantages: it is less likely that the preliminary version is “contaminated” by one single person and no language is the dominant frame of reference (Brislin, 1986). However, some limitations of the back-translation technique have been observed. For instance, “good” back translators might automatically compensate for poorly translated texts and thus mask problems (Brislin, 1986; Harkness, 2003). Also, Van de Vijver and Leung (1997) point out that the procedure can produce a stilted language that does not approach the naturalness of the text in the original version. As a consequence, the use of back-translation seems to be less and less recommended by psychometric experts (Byrne & Campbell, 1999). A second technique, called blind parallel translation, consists of having several translators translate independently from the source language into the target language. The different target versions are then discussed and a final version is compiled (Harkness, 2003; Usunier, 1998). In cross-cultural research, we often need to develop surveys in more than two languages. We propose here a modified version of the blind parallel translation technique that may be better suited for such multilingual studies. Suppose that a study involves English, Italian, and Spanish participants and that the mother tongue of the principal investigator is English. A first step involves two bilingual English-Spanish translators and two English-Italian translators proposing a translation of the first English version separately. After this step, we have two Spanish and two Italian versions of the questionnaire. The two pairs of translators then compare and discuss their translations until they agree on a common version.
Particular attention should be paid in the translation process to equivalence of response formats, because inadequate translation will lead to systematic cross-cultural differences. Likert scales are the most widely used response scale in organizational research (Hinkin, 1995). Existing evidence shows that difficulties can occur in determining lexical equivalents in different languages of verbal descriptions for the scale and that it is difficult to ensure that the distances between scale points are equivalent in all the languages (Usunier, 1998). Several solutions have been proposed to increase the equivalence of response scales; these include the substitution of verbal anchors with numerical scales and the use of local wordings based on scales developed by local researchers (Smith, 2003; Usunier, 1998). The first option seems preferable because numbers are more likely to operate equivalently than words; yet, the distinction becomes very subtle or non-existent when the numbers have to be described in words in the introduction to the participant.
Step 4: Adjudication of Judgmental Aspects
The aim of this step is to assess the quality of the previous stages, and to improve the scale’s face and content validity. When the constructs to measure are based on a well-tested theory, the most widely used method consists of asking a group of experts to review the item pool (De Vellis, 2003; Hardesty & Bearden, 2004). Experts can be provided with the definition of the constructs and then be asked to rate each item with respect to different item performance indicators such as the clarity and the adequacy of the items in addressing the concept as it has been defined. The best rated items are finally retained. Furthermore, if a scale is translated, bilingual experts cannot only compare the semantic similarity of the original and translated versions, but can also evaluate other text features such as comprehensibility.
Step 5: Collect Pilot Data
After an initial set of items for each group has been established, a pilot test is necessary (Churchill, 1979). It is generally recommended to use development samples that are sufficiently large and drawn from the target populations (De Vellis, 2003). However, what “sufficiently large” means has been subject of controversy among researchers. The general belief for both EFA (exploratory factor analysis) and CFA (confirmatory factor analysis) is that more is always better, with recommended ratios such as 10 to 20 people per measured variable, with 100 respondents per group being a bare minimum sample size (Meade & Lautenschlager, 2004b; Thompson, 2004). However, more recent studies, mostly based on Monte Carlo simulations, have shown that the minimum sample size varies depending on the level of communalities, loadings, number of variables per factor, and the number of factors, and that EFA can be performed quite adequately with samples as low as 50 (see De Winter, Dodou, & Wieringa, 2009).
It is important to maximize the equivalence in data collection and avoid method bias which encompasses three aspects: sample bias relates to the comparability of samples; instrument bias derives from the responses to the format of the assessment instrument such as response sets and social desirability; finally, administration bias results from differential administration conditions such as interviewer effects (Byrne & Watkins, 2003).
Step 6: Assessment of Psychometric Properties in Each Sample
After data are collected, the validity and reliability of the scales should be evaluated for each group to ensure that appropriate items are retained to constitute the scales (Churchill, 1979; De Vellis, 2003). In single-group research concerning scale development, tests of validity and reliability typically start with an exploratory factor analysis to identify a smaller number of factors or latent constructs from a large number of items derived from qualitative techniques (Worthington & Whittaker, 2006). Retain all factors with eigenvalues greater than 1.0 and perform a scree test, are still fairly common in determining how many factors to extract, despite the growing evidence that the Velicer’s MAP criteria, and parallel analysis are more accurate (Osborne & Costello, 2009; O’Connor; 2000). Scales are formed by taking all items together that load at least moderately on the same factor (e.g., having a standardized loading with an absolute value of at least .4) and do not load as high on other factors (Gerbing & Anderson, 1996; Hair Jr., Black, Babin, Anderson, & Tatham, 2006). Items that do not show this convergent and discriminant validity are usually dropped (Campbell & Fiske, 1959).
The validation phase typically ends with a confirmatory factor analysis to establish the final version of the scales (Hinkin, 1995). It is generally recommended to collect new data so that the exploratory and confirmatory factor analyses are based on different data (Churchill, 1979; De Vellis, 2003). However, because of the difficulty of data collection in organizational settings, authors often randomly split their sample into two halves and perform exploratory analyses on the first half and confirmatory analyses on the second half. When validity is established, reliability is generally assessed by computing coefficient alpha. Again, when possible, authors usually delete some poorly performing items to increase coefficient alpha (Hinkin, 1995). Note that the use of coefficient alpha has been criticized on the grounds that it is not a measure of internal consistency (Sijtsma, 2009). Therefore, it is preferable to use other measures of reliability such as the Mc Donald’s omega (Mc Donald, 1970) which is computed from the standardized parameter estimates (Zinbarg, Revelle, Yovel, & Li, 2005).
By factor analyzing the items for each group separately, one can check whether the same factors appear and if the items load on the same factors for all groups. Items failing to show cross-group convergent and discriminant validities can be eliminated from the cross-cultural comparison; yet, these may contain interesting information about cross-cultural differences in that they show very different patterns of loadings.
Although CFA is far more flexible that EFA due to its integration to the overarching SEM framework, it is still limited by the inherent independent cluster model that arbitrarily constrains all cross loadings to 0, resulting in inflated factor correlations when cross-loadings – even minor ones – are present. For this reason, an Exploratory Structural Equation Model approach, combining EFA, CFA and SEM, has recently been developed and implemented in the Mplus statistical packages (Asparouhov & Muthén, 2009, Marsh et al. 2011). Further studies are needed to determine whether this approach can live up to its theoretical potential and what its pros and cons are.
Step 7: Assessment of the Equivalence of the Psychometric Properties – Measurement Equivalence
Cross-cultural research usually deals with either between-group comparisons of the latent or observed means of some concept (Type I or level-oriented studies; e.g., is work motivation higher in Japan than in China?) or with between-group comparisons of the relationships between constructs (Type II or structure-oriented studies; e.g., is the relationship between stock-options and motivation the same for top and middle managers?). The requirements in terms of measurement equivalence are different for these two types of comparisons. If differences in score levels are of interest, comparisons are only meaningful if the measurement scales have the same origin (zero point) and the same metric (scale units). If the issue of interest involves the relationships between two or more variables, the only requirement for meaningful comparisons is that the scale on which the scores are expressed have the same metric (Mavondo, Gabbott, & Tsarenko, 2003; Poortinga, 1989).
Various approaches exist for testing measurement invariance such as the ones based on item response theory and tests of differential item functioning, and more recently the ones based on exploratory structural equation modeling (Millsap, 2011; Raju, Byrne, & Laffitte, 2002; Reise, Widaman, & Pugh, 1993). However, multigroup CFA seems to be the most commonly used approach in management and organizational research. The procedure consists of testing the invariance of the parameters of the measurement model as defined within the confirmatory factor analysis framework (Vandenberg & Lance, 2000). More specifically, the procedure consists of testing the goodness of fit of increasingly restrictive models. Models are nested meaning that placing equality constraints on one of the models produces the other (nested) model.
The measurement model should fit the data within any of the groups under scrutiny and, in case of a good fit cross-group equivalence should be simultaneously assessed for all the groups. For a long period following Meredith’s (1993) seminal paper, authors have not completely agreed on (1) which tests of measurement equivalence had to be undertaken, (2) the sequence of the tests, (3) the substantive meaning of each level of invariance and (4) the extent to which partial equivalence could be accepted (see for example Vandenberg, 2002). In what follows, we present a synthesis of the main principles concerning measurement invariance that seem to have reached a certain consensus, and we propose a way of dealing with the four issues mentioned above. We also go beyond past research in terms of interpretation of substantive results in the light of the results of the measurement invariance tests.
Researchers used to first perform an “omnibus test” of the equality of the covariance matrices across groups. If covariance matrices did not differ across groups, full measurement equivalence was considered to be established (Vandenberg & Lance, 2000). However, some authors have questioned the usefulness of this particular test on the grounds that it can indicate that measurement invariance is supported when more specific tests of measurement invariance find otherwise (Meade & Lautenschlager, 2004a; Raju, Byrne, & Laffitte, 2002). Then, it seems more reasonable to directly inspect each level of invariance.
The first generally advocated test is the test of configural invariance, addressing whether respondents of different groups associate the same subsets of items with the same construct(s), meaning that the underlying cognitive domains are the same (Riordan & Vandenberg, 1994). The absence of nonnegligible differences in the pattern of fixed and free factor loadings between groups is usually taken as supportive and sufficient evidence of configural invariance (Vandenberg, 2002). Configural invariance is a precondition for higher levels of measurement invariance. Therefore, it is generally viewed as a baseline model against which further tests, based on more restrictive models, are evaluated.
If steps 1 to 6 of the presented procedure have been followed, configural invariance would be expected. The implications of not finding configural invariance vary depending on how many items lack invariance. If only a limited number of items do not load on the specified factor in one or some groups, and there are still enough invariant items left, removing the items from the cross-cultural comparison may be desirable. However, it is important to determine whether the remaining common items still adequately cover the construct as defined at the beginning of the study or the original construct has to be narrowed.
The presence of anomalous stimuli indicates that some type of cultural specificity has been observed; for example, certain stimuli may measure secondary constructs or the content of the stimuli could be inappropriate in some cultures (e.g., the attitude towards living with one’s parents may be an indicator of individualism in France but not in Italy or Spain where this refers more to a national norm). If, on the other hand, the lack of configural invariance is a consequence of many anomalous stimuli and the factor structures turn out to be essentially different across groups, the implications are more severe. Such an observation means that the concept or at least some of its indicators are culture specific and that quantitative comparisons between groups, involving these indicators, are not meaningful.
Most authors advocate testing metric invariance after configural invariance has been established. It involves the equality of scale units between groups and is required to compare relationships between variables in different groups. Metric invariance concerns the relationship between the latent variable and its indicators and is tested by constraining the items’ factor loadings to be invariant across groups (Steenkamp & Baumgartner, 1998).
The results of the analysis can point to full metric invariance, complete absence of metric invariance, and partial metric invariance (if at least one but not all items failed to be invariant). Since exact measurement invariance is unrealistic in many cases, an important question is what to do if metric invariance for all the items is not established (Byrne, Shavelson, & Muthen, 1989; Labouvie & Ruetsch, 1995; Raju et al., 2002).
Depending on the outcome, three aspects have to be considered: the number of items that have different loadings, the size of the loading differences and, more specifically, whether the differences are large enough to be consequential in terms of cross-cultural substantive comparisons, and the size of the observed relationships between the latent variables under study. Concerning the number of items, it is technically possible to compare relations between constructs as soon as at least one indicator has invariant loadings. Practically speaking, however, if only very few items have invariant loadings, such item-specific comparisons do not convey much information about the underlying construct. Authors do not agree on how many invariant items are needed to accept partial metric invariance (Cheung & Rensvold, 2002; Schaffer & Riordan, 2003; Vandenberg, 2002). In business and organizational research, short, unidimensional scales (< 10 items) are common (Hinkin, 1995). For such scales we propose to avoid comparisons of correlations between constructs if less than half of the items are metrically invariant.
The second relevant issue in analyzing partial invariance is the size of the differences of the noninvariant loadings. There is no widely accepted rule as to when loadings are sufficiently different to be psychologically consequential. For example, if an item loading for group A is .65 and for group B is .75, the difference can be statistically significant given a sufficiently large sample size but the difference is, psychologically speaking, very small.
According to Meade and Bauer (2007) when metric invariance is not found, researchers can calculate effect sizes and confidence intervals for the factor loading differences. If these intervals are small and close to (but exclude) zero, then the difference in loadings is so small that substantive comparisons are still justified.
A test of scalar invariance is the most currently used after metric invariance is established (Vandenberg & Lance, 2000). Scalar invariance concerns the consistency of the differences between latent means and observed means across groups. Even if an item measures the latent variable with the same metrics for different groups, scores on that item can still be systematically upward or downward biased (Steenkamp & Baumgartner, 1998). Scalar invariance is tested by imposing an equality constraint on the item intercepts. When testing for invariance of item intercepts, the parameters that have been found to be nonequivalent in previous analyses should be freely estimated. Only the item loadings found to be invariant and the item intercepts must be constrained to be equal between the groups.
The same three outcomes can be found (complete support, partial support, and complete lack of scalar invariance) as in the previous analysis. Again, quality and quantity have to be taken into account. If the measurement intercepts of different items consistently point to deviances in one or the same small sets of groups, it is important to check for consistencies of the bias across groups. If the bias is not consistently pointing to a single group, it is more likely that the bias is due to item specific issues like inadequate translations. If there is more consistency, then systematic sources of bias, such as social desirability or acquiescence, may play a role.
If the test of scalar invariance indicates that differences in item intercepts are not consistent across items, anomalies can be examined by removing the items from the cross-cultural comparison. Another approach is to evaluate the influence of the biased items on the cross-cultural differences; a simple way is to compare the difference in size of the means on the original instruments with the difference on the instruments from which all biased items are removed. Although the differences can be very large in theory, the removal of biased items may not have major implications for their size and the implications for the interpretation of the cross-cultural differences may be minimal (e.g., Meiring, Van de Vijver, & Rothmann, 2006). Finally, the size of the intercept differences and the cross-groups mean differences should be taken into account when interpreting lack of scalar invariance. Again, if the mean difference of two variables between two groups is small, a lack of full scalar invariance would have more serious implications than in the case of a large difference of means.
Other tests can concern factor variance equivalence and error variance equivalence (Vandenberg & Lance, 2000). However, we consider that metric and scalar invariance are sufficient for establishing that measurement equivalence conditions exist and that invariance of unique variances is not an issue when differences in measurement error are taken into account as it is the case in SEM (Byrne, 2004; Meade & Bauer, 2007; Steenkamp & Baumgartner, 1998). However, when other statistical analyses are used to inspect correlations and mean differences, such as regressions and ANOVAs, invariance of errors must be addressed because errors can inflate or deflate relations and means (Millsap, 2011).
A further issue concerns the selection of an item as the referent indicator for identification purposes (Little, Slegers, & Card, 2006). Typical practice is simply to select an item and fix its loading to the value of 1 and its intercept value to the value of zero. This way, all latent variances and means can be freely estimated. However, this practice can lead to biased results if the researcher inadvertently selects as the referent indicator an item that is not metrically invariant (Little et al., 2006; Vandenberg, 2002). In order to avoid such an issue, researchers can inspect the item loadings from the EFA and select, as the referent indicator, the one whose loadings are the most similar across groups. An alternative method relies on the standardization of the latent variables. More specifically, when testing for configural invariance, factor variances are constrained to 1 and means to 0. For tests of metric invariance, all loadings are constrained to equality, and all variances are estimated, except those from the first group that are fixed to one. Finally, for tests of scalar invariance, intercepts are constrained to be identical and all means are freely estimated except those from the referent group that are fixed to zero. This way, the latent means in the other groups are expressed as deviations from the first group. Finally, Little et al. (2006) also presented an “effects coding” identification method that allows estimating the latent parameters in a nonarbitrary metric, by using model constraints forcing the loadings to average 1 and the intercepts to sum up to 0.
Table 1
Scale of Competition (US English Version)

Example
The scale used in this example is a measure of competitive orientation, defined as the extent to which individuals perceive competition as something positive and desirable, which was used in a previous study performed by the first author. The sample comprises 368 French, 138 Mexican, 246 US, and 276 Italian employees of 3 French multinational corporations. The survey was developed in English and then translated into French, Spanish, and Italian using the blind parallel translation procedure described above. Table 1 presents the US English version of this 5-item scale.
Exploratory factor analysis and coefficient omega. Principal axis factoring was used to determine the selected items’ factor structure for each group separately (Hair Jr. et al., 2006). We used the Velicer’s Minimum Average Partial (MAP) Test and Parallel Analysis routines as presented in O’Connor (2000), to determine the number of components for each group. In the MAP test, factors are retained as long as the variance in the correlation matrix represents more systematic variance than unsystematic variance, while in the parallel test, factors are retained as long as the ith eigenvalue from the actual data is greater than the ith eigenvalue from the random data. The results showed that the number of factors to extract for all groups was 1. Also, as shown in Table 2, all items loaded in excess of .40 on the factor confirming convergent validity (Hair Jr. et al., 2006; Peter, 1981). Reliabilities, as assessed by coefficients alpha and omega, were respectively of .84 and .82 for France, .80 and .77 for Italy, .80 and .78 for the US, and .77 and .78 for Mexico, suggesting good reliabilities for all groups.
Table 2
Exploratory Factor Analysis, Coefficients Alpha and Omega

Multigroup confirmatory factor analysis. Because chi-square-based tests of measurement invariance are highly sensitive to sample size (Meade & Bauer, 2007), we extracted three random subsamples of 150 individuals for the French, Italian, and US groups, in order to compare groups of similar sample sizes. We assessed the multivariate normality of our data through Mardia’s coefficients of skewness and kurtosis. The results showed that normality did not hold for any group with Mardia coefficients of 3.63 (CR (Critical Ratio) = 2.66) for France, 5.07 (CR = 3.71) for Italy, 2.05 (CR = 1.50) for the United States and 5.43 (CR = 3.91) for Mexico. Moreover, the kurtosis index varied between -.85 and 1.22, and the skewness index varied between -.95 and .14. Thus, the univariate and multivariate distributions can be considered to depart from normality only slightly.
We used AMOS 18.0 to assess the validity of the hypothesized factor structure as well as measurement invariance between French, Italian, US and Mexican employees. Because χ2 statistic as a model’s indicator of goodness-of-fit is complicated by several factors (such as sample size), researchers have developed a number of alternative goodness-of-fit measures. In this study, we have used four of such indices which are widely recommended on the basis of research evidence (Cheung & Rensvold, 2002; A. Meade, Johnson, & Braddy, 2008): the Comparative Fit Index (CFI), the Tucker Lewis Index (TLI), the Root Square Error of Approximation (RMSEA), and the Standardized Room Mean Residual (SRMR).
Four levels of invariance were assessed: configural, metric,scalar, and unique variances invariance. As a prerequisite to testing for factorial invariance, it is customary to assess for each group the measurement model which best represents the observed data. Afterwards, when testing for measurement invariance, equality constraints are imposed on particular parameters, and thus, data for all groups are analyzed simultaneously to obtain efficient estimates (Byrne, 2004). Table 3 shows the fit indices when the model is tested for each group separately. All fit indices suggested that the model fitted poorly in the French, Italian, and US groups (Hair Jr. et al., 2006). An inspection of the modification indices suggested a strong correlation between the error variances of items 2 and 3 for all groups. This can be explained by the fact that items 2 and 3 refer to the respondents’ personal competitive spirit (items starting with “I enjoy” and “I believe”), while other items refer to collective competition. A conservative decision would be to drop one of the two items because of the high correlated error variances. However, in the present case, there does not seem to be a large redundancy between the items. The fit indices improved strongly after including error covariances, leading to well fitting models for the four groups (models 1 to 7). It is important to note that model respecifications must be limited and avoided when possible, because they may be driven by characteristics of the particular sample on which the model is tested (MacCallum, Roznowski, & Necowitz, 1992).
As shown in table 4, all standardized loadings were highly significant and ranged from .42 to .86. We then fitted the model for the four groups simultaneously to test for configural invariance and again we needed to estimate the error covariance between items 2 and 3 to yield good fit, with a CFI value of .974 and a RMSEA value of .052 (model 8). Thus, it could be concluded that the Competition scale showed configural invariance across the four groups.
The χ2 value of 41.89 with 16 degrees of freedom provides the baseline value against which the subsequent tests of invariance are compared. Having established configural invariance, the next logical test concerns metric invariance (i.e., a test of invariant factor loadings). Model 9 in Table 3 shows the fit indices of the model where the factor loadings are constrained to be equal across groups. However, of primary importance is the comparison of its χ2 value of 62.04 (df = 28) with that for the baseline model (χ2 = 41.89, df = 16). In fact, when models are nested, this difference in χ2 values (in large samples) follows a χ2 distribution, with degrees of freedom equal to the difference in degrees of freedom (Van de Vijver & Leung, 1997). Given that the chi square sensitivity to sample size, minor model misspecifications and minor deviations from multivariate normality, Cheung and Rensvold (2002) and Chen (2007) suggested complementing the emanations of chi-squares difference test by the examination of changes in CFI and RMSEA, with changes lower than respectively .01 and .015 suggesting that invariance assumptions are reasonably met. This comparison yielded a χ2 difference value of 20.15 with 12 df, which is not significant (p >.05), a drop of CFI of .008, and a drop of RMSEA of .007 which gave evidence of metric invariance.
We then tested for scalar invariance by constraining all item intercepts to be equal. This yielded a χ2 difference value of 34.33 with 12 degrees of freedom, which is statistically significant at the .001 level. From here on, several strategies could have been implemented to determine which item intercepts were noninvariant between which groups. As shown by Byrne (2001), when working with more than two groups, one approach is to determine, first, if the constrained model is possibly invariant across two of the groups. This is done by testing measurement invariance between groups taken two by two. However, if one wishes to know which parameters are non-invariant among all groups, modification indexes (MI) can be used to detect the noninvariant parameters. An inspection of MIs revealed that the item intercept of item 3 was the only parameter with a relevant MI (8,095, EPC = -.160). Relaxing the equality of intercepts for item 3 yielded a χ2 difference value of 15.89 with 8 degrees of freedom, which is statistically significant at the .05 probability level. However, drops in CFI (-.007) and RMSEA (-.002) were both low, showing that partial scalar invariance held.
We finally constrained uniquenesses to be invariant (in addition to maintaining metric and partial scalar invariance constraints) and found that error variance equivalence did not hold, with a statistically significant χ2 difference value of 51.12 with 15 degrees of freedom. Again, an inspection of MIs suggested that the uniqueness of item 3 for the group of Italians was different from the same parameter for other groups. Relaxing the constrained uniqueness improved the model’s fit significantly. However, when compared with the partial scalar equivalence model, the χ2 difference value of 23.71 with 12 degrees of freedom was still statistically significant at the .05 probability level, and the drop in CFI was larger than .01 even though there was no increase in the RMSEA. A new inspection of MIs suggested that the error variance invariance for item 2 and the group of Mexicans did not hold. We then relaxed this constraint, and found a nonsignificant χ2 difference between this new model and the model of partial scalar equivalence.
Table 3
Summary of Fit Statistics for Tests of Invariance
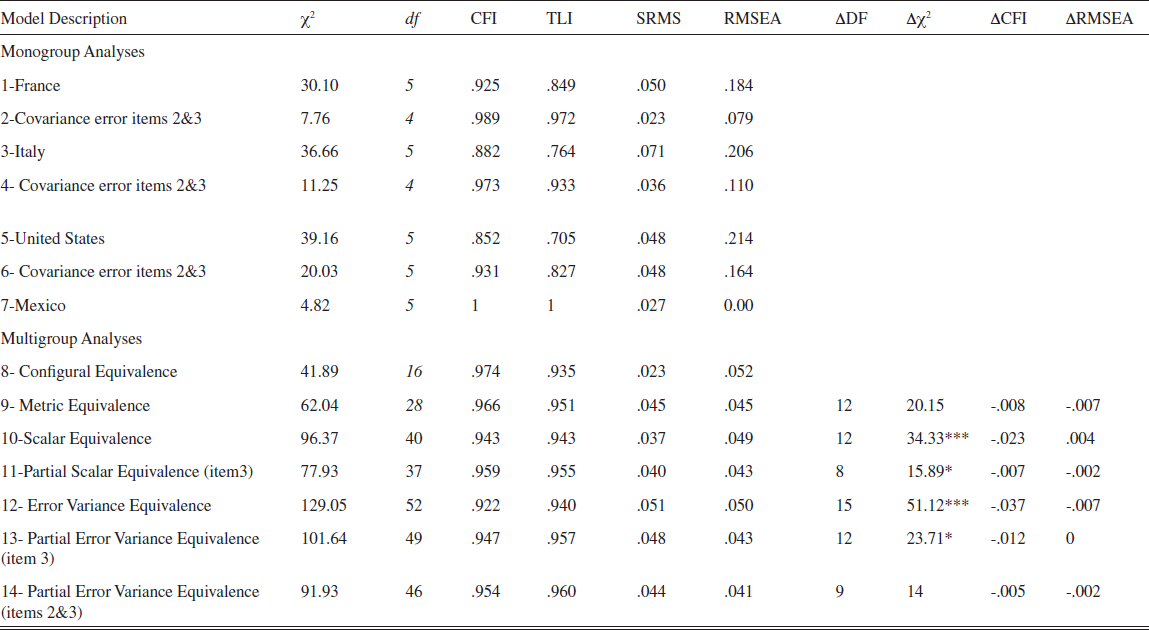
*p < .05. **p < .01. ***p < .001
Table 4
Unstandardized Factor Loadings (λ) and Intercepts (τ) for France, Italy, the United States and Mexico
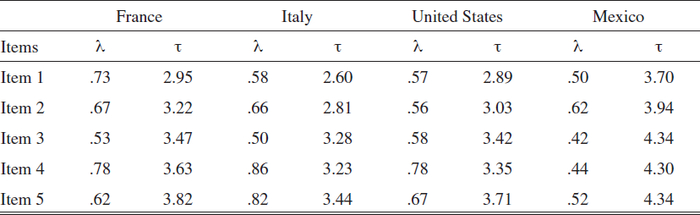
Overall, our analyses of measurement invariance showed that the Competition scale was fully metrically invariant among the four groups, that the intercept and uniqueness of item 3 were not invariant among the four groups, and that the uniqueness of item 2 was not equivalent among the four groups. At this point, one could have decided to drop item 3 from the scale. In fact, it seems that the use of the word “spirit” in the wording of the item may have been perceived differently by respondents from different countries. However, because only one item out of 5 failed to show scalar equivalence and only 2 items out of five did not show error variance equivalence, partial measurement equivalence held, and one could confidently use the Competition scale for all analyses comparing two or more of the four groups.
Conclusion
Comparing the attitudes and behaviors of different groups of employees or consumers is one of the most common aims of organizational research. However, meaningful cross-group comparisons presuppose that the measurement instruments used to assess attitudes, values or behaviors in organizations, operate in an equivalent way across groups. Otherwise, differences in mean levels or in the pattern of correlation of the variables are potentially artifactual and may be substantively misleading. In the organizational literature, the issue of measurement equivalence has become increasingly popular in particular when the groups being compared are composed of individuals from different countries. We have argued here that the issue of measurement equivalence should be addressed for any group comparison, in particular when there are some reasons to expect between-group differences in the existence and definition of the constructs themselves, and in the capacity of a set of items to cover the domain of the constructs in an equivalent way. Moreover, based on an extensive review of the literature on the topic, we argued that researchers tend to address measurement equivalence in a post hoc fashion (that is, after data were collected). In this article, we suggested that researchers should start incorporating equivalence issues from the scale development process to increase the likelihood of getting equivalent measures. We integrated measurement equivalence issues in each step of classical procedures of scale development to propose a step-by-step procedure of scale development for comparative research which would be useful for both researchers who need to develop a measurement scale and for researchers who want to use an existing scale in the context of a comparative study and want to assess whether the scale is suitable for all the groups under study. In this procedure, we described how a combination of instrument design or adaptations and statistical analyses can go a long way to enhance the validity of substantive results in comparative studies. We finally presented an example of measurement equivalence analysis based on multigroup confirmatory factor analysis, and went beyond past research by suggesting how to deal with measurement non-invariance. As an example, we suggested that the degree of inequivalence between parameters as well as the strength of the substantive effects being studied (correlation between variables and mean differences) had to be analyzed. It is an important aspect of our approach that we try to link statistical methods to substantive theories. The psychometric tools that we described have a high level of sophistication and it is probably fair to say that the level of theorizing about cross-cultural differences and similarities has advanced less than the way of treating data. In our view, this imbalance does not imply that we should capitalize on the psychometric aspects of cross-cultural comparisons. The theoretical poverty of an instrument cannot be remedied by statistical sophistication. Analogously, a theoretically well based instrument cannot reveal cross-cultural differences adequately unless the data obtained with it are analyzed adequately. Bias and equivalence have become central concepts in cross-cultural studies. Our paper has outlined procedures about how to integrate ideas about equivalence in cross-cultural studies. We believe that the overall framework presented in this article will help researchers dealing with such complex issues in a straightforward and effective way.
Appendices
Notes biographiques
Marco Caramelli est professeur de management à l’INSEEC Business School à Paris. Il a obtenu un doctorat en sciences de gestion de l’Université de Montpellier en France, et enseigne et conduit des recherches dans différents domaines, dont le management interculturel, l’actionnariat des salariés et la gouvernance d’entreprise. Il est également membre associé de la Fédération française des associations d’actionnaires salariés, et est régulièrement invité comme orateur dans des conférences académiques et professionnelles.
Fons van de Vijver est professeur de psychologie interculturelle à l’Université de Tilburg aux Pays-Bas, et professeur honoraire à la North-West University en Afrique du Sud et à l’Université du Queensland en Australie. Il est l’auteur de plus de 350 publications, essentiellement dans le domaine de la psychologie interculturelle. Ses travaux concernent surtout les questions de biais et d'équivalence de mesures, l’acculturation et le multiculturalisme, les similarités et différences cognitives, les styles de réponses, les traductions et adaptations de tests. Il a été rédacteur en chef de la revue Journal of Cross-Cultural Psychology, et est actuellement le président de la European Association of Psychological Assessment.
Bibliographie
- Adler, N. J. (1983). “A typology of management studies involving culture.” Journal ofInternational Business Studies, Vol. 14, No. 2, pp. 29-47.
- Asparouhov, T., & Muthén, B. (2009). “Exploratory structural equation modeling.” Structural Equation Modeling, Vol. 16, pp. 397-438.
- Bagozzi, R. P., Yi, Y., & Phillips, L. W. (1991). “Assessing construct validity in organizational research.” Administrative Science Quarterly, Vol. 36, No. 3, pp. 421-458.
- Barnette, J. J. (2000). “Effects of stem and Likert response option reversals on survey internal consistency: If you feel the need, there is a better alternative to using those negatively worded stems.” Educational and Psychological Measurement, Vol. 60, No. 3, pp. 361-370
- Berry, J. W. (1989). “Imposed etics-emics-derived etics: The operationalization of a compelling idea.” International Journal of Psychology, Vol. 24, No. 6, pp. 721-735.
- Billiet, J. B., & McClendon, M. J. (2000). “Modeling acquiescence in measurement models for two balanced sets of items.” Structural Equation Modeling, Vol.7, No.4, pp.608-628.
- Boddewyn, J. (1965). “The comparative approach to the study of business administration.” Academy of Management Journal, Vol. 8, No. 4, pp. 261-267.
- Bolino, M. C., & Turnley, W. H. (1999). “Measuring impression management in organizations: A scale development based on the Jones and Pittman taxonomy.” Organizational Research Methods, Vol. 2, No. 2, pp. 187-206.
- Brislin, R. W. (1986). “The wording and translation of research instruments.” In W. J. Lonner & J. W. Berry (Eds.), Fields methods in cross-cultural research (Vol. 8, pp. 291-324). Beverly Hills, CA: Sage.
- Byrne, B. M. (2001). Structural equation modeling with AMOS - Basic concepts, applications, and programming. Mahwah, NJ, USA: Lawrence Erlbaum Associates.
- Byrne, B. M. (2004). “Testing for multigroup invariance using AMOS graphics: A road less traveled.” Structural Equations Modeling, Vol. 11, No. 4, pp. 272-300.
- Byrne, B. M., Shavelson, R. J., & Muthen, B. (1989). “Testing for the equivalence of factor covariance and mean structures: The issue of partial measurement equivalence.” Psychological Bulletin, Vol. 105, No. 3, pp. 456-466.
- Byrne, B. M., & Campbell, T. L. (1999). “Cross-cultural comparisons and the presumption of equivalent measurement and theoretical structure: A look beneath the surface.” Journal of Cross-Cultural Psychology, Vol. 30, No. 5, pp. 555-574.
- Byrne, B. M., & Watkins, D. (2003). “The issue of measurement invariance revisited.” Journal of Cross-Cultural Psychology, Vol. 34, No. 2, pp. 155-175.
- Campbell, D. T., & Fiske, D. W. (1959). “Convergent and discriminant validation by the multitrait-multimethod matrix.” Psychological Bulletin, Vol. 56, pp. 81-105.
- Cavusgil, S. T., & Das, A. (1997). “Methodological issues in empirical cross-cultural research: A survey of the management literature and a framework.” Management International Review, Vol. 37, No. 1, pp. 71-96.
- Chen, F.F. (2007). “Sensitivity of goodness of fit indexes to lack of measurement.” Structural Equation Modeling, Vol. 14, pp. 464-504
- Cheung, G. W., & Rensvold, R. B. (2002). “Evaluating goodness-of-fit indexes for testing measurement invariance.” Structural Equation Modeling, Vol. 9, No. 2, pp. 233-255.
- Cheung, F. M., vandeVijver, F. J. R., & Leong, F. T. L. (2011). “Toward a new approach to the study of personality in culture.” American Psychologist. Advance online publication.
- Churchill, G. A. (1979). “A paradigm for developing better measures of marketing constructs.” Journal of Marketing Research, Vol. 16, No. 1, pp. 64-73.
- Davidson, A. R., Jaccard, J. J., Triandis, H. C., Morales, M. L., & Diaz-Guerrero, R. (1976). “Cross-cultural model testing: Toward a solution of the etic-emic dilemma.” International Journal of Psychology, Vol. 11, No. 1, pp. 1-13.
- Dawis, R. V. (1987). “Scale construction.” Journal of Counselling Psychology, Vol. 34, No.4, pp. 481-489.
- DeVellis, R. F. (2003). Scale development, theory and applications (Vol. 26). Thousand Oaks, CA: Sage.
- DeWinter, J., Dodou, D., & Wieringa, P. (2009). “Exploratory factor analysis with small sample sizes”. Multivariate Behavioral Research, Vol. 44, pp. 147–181.
- Gerbing, D. W., & Anderson, J. C. (1996). “An updated paradigm for scale development incorporating unidimensionality and its assessment.” Journal of Marketing Research, Vol. 25, No. 5, pp. 186-192.
- Hair Jr., J. F., Black, W. C., Babin, B. J., Anderson, R. E., & Tatham, R. L. (2006). Multivariate data analysis (6th ed.). Upper Saddle River, NJ: Pearson.
- Hambleton, R. K. (2001). “The next generation of the ITC test translation and adaptation guidelines.” European Journal of Psychological Assessment, Vol. 17, No. 3, pp. 164-172.
- Hardesty, D. M., & Bearden, W. O. (2004). “The use of expert judges in scale development: Implications for improving face validity of measures of unobservable constructs.“ Journal of Business Research, Vol. 57, pp. 98-107.
- Harkness, J. (2003). “Questionnaire translation.” In J. A. Harkness, F. J. R. Van de Vijver & P. P. Mohler (Eds.), Cross-cultural survey methods. Hoboken, NJ: Wiley.
- Harkness, J., VandeVijver, F. J. R., & Johnson, T. P. (2003). “Questionnaire design in comparative research.” In J. A. Harkness, F. J. R. Van de Vijver & P. P. Mohler (Eds.), Cross-cultural survey methods. Hoboken, NJ: Wiley.
- Hinkin, T. R. (1995). “A review of scale development practices in the study of organizations.” Journal of Management, Vol. 21, No. 5, pp. 967-988.
- Hofstede, G. (2001). Culture’s consequences - comparing values, behaviors, institutions and organizations across nations (2nd ed.). Thousand Oaks, CA: Sage.
- Hui, C. H., & Triandis, H. C. (1985). “Measurement in cross-cultural psychology.” Journal of Cross-Cultural Psychology, Vol. 16, No. 2, pp. 131-152.
- Johnson, T. P. (1998). “Approaches to equivalence in cross-cultural and cross-national survey research.” ZUMA-Nachrichten spezial, Vol.3, pp. 1-40.
- Labouvie, E., & Ruetsch, C. (1995). “Testing for equivalence of measurement scales: Simple structure and metric invariance reconsidered.” Multivariate Behavioral Research, Vol. 30, No. 1, pp. 63-76
- Laroche, M., Ueltschy, L. C., Abe, S., Cleveland, M., & Yannopoulos, P. (2004). “Service quality perceptions and customer satisfaction: Evaluating the role of culture.” Journal of International Marketing, Vol. 12, No. 3, pp. 58-85.
- Little, T. D., Slegers, D. W., & Card, N. A. (2006). “A non-arbitrary method of identifying and scaling latent variables in SEM and MACS models.” Structural Equation Modeling, Vol. 13, No. 1, pp. 59-72.
- Lytle, A. L., Brett, J. M., Barsness, Z. I., Tinsley, C. H., & Janssens, M. (1995). “A paradigm for confirmatory cross-cultural research in organizational behavior.” Research in Organizational Behavior, Vol. 17, pp. 167-214.
- MacCallum, R., Roznowski, M., & Necowitz, L. (1992). “Model modifications in covariance structure analysis: The problem of capitalization on chance.” Psychological Bulletin, Vol. 111, No. 3, pp. 490-504.
- Marsh, H.W., Nagengast, B., Morin, A.J.S., Parada, R.H., Craven, R.G., & Hamilton,
- L.R. (2011). “Construct validity of the multidimensional structure of bullying and victimization: An application of exploratory structural equation modeling.” Journal of Educational Psychology, Vol.103, pp. 701-732.
- Mavondo, F., Gabbott, M., & Tsarenko, Y. (2003). “Measurement invariance of marketing instruments: An implication across countries.” Journal of Marketing Management, Vol.19, No.5/6, pp. 523-540.
- McDonald, R.P. (1970). “Theoretical foundations of principal factor analysis, canonical factor analysis, and alpha factor analysis.” British Journal of Mathematical & Statistical Psychology, No 23, pp. 1-21
- Meade, A.W, Johnson, E., & Braddy, P. (2008). “Power and sensitivity of alternative fit indices in tests of measurement invariance.” Journal of Applied Psychology, Vol. 93, No. 3, pp. 568-592.
- Meade, A.W, Michels, L., & Lautenschlager, G. (2007). “Are internet and paper-and-pencil personality tests truly comparable? An experimental design measurement invariance study.” Organizational Research Methods, Vol. 10, No. 2, pp. 322-345.
- Meade, A. W., & Bauer, D. J. (2007). “Power and precision in confirmatory factor analyic tests of measurement invariance.” Structural Equation Modeling, Vol. 14, No. 4, pp. 611-635.
- Meade, A. W., & Lautenschlager, G. J. (2004a). “A comparison of item response theory and confirmatory factor analytic methodologies for establishing measurement equivalence/invariance.” Organizational Research Methods, Vol. 7, No. 4, pp. 361-388.
- Meade, A. W., & Lautenschlager, G. J. (2004b). “A Monte-Carlo study of confirmatory factor analytic tests of measurement equivalence/invariance.” Structural Equation Modeling, Vol. 11, No.1, pp. 60-72.
- Meiring, D., VandeVijver, F.J.R., & Rothmann, S. (2006). “Bias in an adapted version of the 15FQ+ in South Africa.” South African Journal of Psychology, Vol.36, pp. 340-356.
- Meredith, W. (1993). “Measurement invariance, factor analysis, and factorial invariance.” Psychometrika, Vol. 58, No. 4, pp. 525-543.
- Millsap, R. E. (2011). Statistical approaches to measurement invariance. New York, NY: Routledge.
- Morden, T. (1999). “Models of national culture - a management review.” Cross Cultural Management, Vol. 6, No. 1, pp. 19-44.
- Mullen, M. R. (1995). “Diagnosing measurement equivalence in cross-national research.” Journal of International Business Studies, Vol. 26, No. 3, pp. 573-596.
- O’Connor, B. P. (2000). “SPSS and SAS programs for determining the number of components using parallel analysis and Velicer’s MAP test.” Behavior Research Methods, Vol. 32, No. 3, pp. 396-402.
- Osborne, J. W., & Costello, A. B. (2009). “Best practices in exploratory factor analysis: Four recommendations for getting the most from your analysis.” Pan-Pacific Management Review, Vol. 12, No. 2, pp. 131-146.
- Peng, T. K., Peterson, M. F., & Shyi, Y. P. (1991). “Quantitative methods in cross-national management research: Trends and equivalence issues.” Journal of Organizational Behavior, Vol.12, No.2, pp. 87-107.
- Peter, J. P. (1981). “Construct validity: A review of basic issues and marketing practices.” Journal of Marketing Research, 18, 133-145. Poortinga, Y. H. (1989). Equivalence of cross-cultural data: An overview of basic issues. International Journal of Psychology, Vol. 24, pp. 737-756.
- Poortinga, Y. H. (1989). “Equivalence of cross-cultural data: An overview of basic issues. International Journal of Psychology, Vol.24, pp.737-756.
- Raju, N. S., Byrne, B. M., & Laffitte, L. J. (2002). “Measurement equivalence: A comparison of methods based on confirmatory factor analysis and item response theory.” Journal of Applied Psychology, Vol. 87, pp. 517-529.
- Reise, S. P., Widaman, K. F., & Pugh, R. H. (1993). “Confirmatory factor analysis and item response theory: Two approaches for exploring measurement invariance.” Psychological Bulletin, Vol. 114, No. 3, pp. 552-566.
- Riordan, C. M., & Vandenberg, R. J. (1994). “A central question in cross-cultural research: Do employees of different cultures interpret work-related measures in a equivalent manner?” Journal of Management, Vol. 20, No. 3, pp. 643-673.
- Schaffer, B. S., & Riordan, C. M. (2003). “A review of cross-cultural methodologies for organizational research: A best-practices approach.” Organizational Research Methods, Vol. 6, No. 2, pp. 169-216.
- Sijtsma, K. (2009). “On the use, the misuse, and the very limited usefulness of Cronbach’s Alpha.” Psychometrika, Vol. 74, No. 1, pp.107-120.
- Singh, J. (1995). “Measurement issues in cross-national research.” Journal of International Business Studies, Vol. 26, No. 3, pp. 597-619.
- Smith, T. W. (2003). “Developing comparable questions in cross-national surveys”. In J. A. Harkness, F. J. R. Van de Vijver & P. P. Mohler (Eds.), Cross-cultural survey methods (pp. 69-92). Hoboken, NJ: Wiley.
- Steenkamp, J.-B. E. M., & Baumgartner, H. (1998). “Assessing measurement invariance in cross-national consumer research”. The Journal of Consumer Research, Vol. 25, No. 1, pp. 78-90.
- Thompson, B. (2004). Exploratory and confirmatory factor analysis: Understanding concepts and applications. Washington, DC: American Psychological Society.
- Usunier, J.-C. (1998). International & cross-cultural management research. Thousand Oaks, CA: Sage.
- VandeVijver, F. J. R. (1998). “Towards a theory of bias and equivalence.” In J. Harkness (Ed.), ZUMA-Nachrichten Spezial No.3. Cross-Cultural Survey Equivalence. Mannheim, Germany: ZUMA.
- VandeVijver, F. J. R., & Leung, K. (1997). Methods and data analysis for cross-cultural research. Thousand Oaks, CA: Sage.
- Vandenberg, R. J. (2002). “Toward a further understanding of and improvement in measurement invariance methods and procedures.” Organizational Research Methods, Vol. 5, No. 2, pp. 139-158.
- Vandenberg, R. J., & Lance, C. E. (2000). “A review and synthesis of the measurement invariance literature: suggestions, practices, and recommendations for organizational research.” Organizational Research Methods, Vol. 3, No.1, pp. 4-70.
- Wasti, S. A., Bergman, M. E., Glomb, T. M., & Drasgow, F. (2000). “Test of the generalizability of a model of sexual harassment.” Journal of Applied Psychology, Vol. 85, No. 5, pp. 766-778.
- Worthington, R. L., & Whittaker, T. A. (2006). “Scale development research: A content analysis and recommendations for best practices.” The Counseling Psychologist, Vol. 34, pp. 806-838.
- Zinbarg, R. E., Revelle, W., Yovel, I., & Li, W. (2005). “Cronbach’s α, Revelle’s β, and Mcdonald’s ω: Their relations with each other and two alternative conceptualizations of reliability.” Psychometrika, Vol.70, No.1, pp. 1-11.
Appendices
Biographical notes
Marco Caramelli is a professor of management at INSEEC Business School in Paris. He received a Ph.D in management science from the University of Montpellier II in France, and he teaches and conducts research in a variety of topics, including cross-cultural management, employee ownership, and corporate governance. He also serves at the board of the French federation of the associations of employee shareholders, and is a frequent presenter at many domestic and international professional and academic conferences.
Fons van de Vijver holds a chair in cross-cultural psychology at Tilburg University, the Netherlands and an extraordinary chair at North-West University, South Africa, and the University of Queensland, Australia. He has published over 350 publications, mainly in the domain of cross-cultural psychology. The main topics in his research involve bias and equivalence, psychological acculturation and multiculturalism, cognitive similarities and differences, response styles, translations and adaptations. He is the former editor of the Journal of Cross-Cultural Psychology, and is President of the European Association of Psychological Assessment.
Appendices
Notas biograficas
Marco Caramelli es profesor de Gestión en la Escuela de Negocios INSEEC en París. Obtuvo un doctorado en ciencia de la administración de la Universidad de Montpellier en Francia,. El enseña y realiza investigaciones en diversas áreas como la gestión intercultural, la participación financiera de los trabajadores y el gobierno corporativo. También es miembro asociado de la Federación Francesa de las Asociaciones de empleados accionistas, y es invitado regularmente como ponente en conferencias académicas y profesionales.
Fons van de Vijver tiene una cátedra de psicología transcultural en la Universidad de Tilburg, Países Bajos, además de cátedras extraordinarias en la Universidad Noroeste, Sudáfrica, y en la Universidad de Queensland, Australia. Él cuenta en su haber con más de 350 publicaciones, principalmente en el área de la psicología transcultural. Los tópicos principales en su investigación tratan sobre el sesgo y la equivalencia, la aculturación psicológica y el multiculturalismo, semejanzas y diferencias cognitivas, estilos de respuesta, traducciones y adaptaciones. Es el anterior editor de la revista Journal of Cross-Cultural Psychology, y es el presidente de la European Association of Psychological Assessment (Asociación Europea de Evaluación Psicológica).
List of tables
Table 1
Scale of Competition (US English Version)
Table 2
Exploratory Factor Analysis, Coefficients Alpha and Omega
Table 3
Summary of Fit Statistics for Tests of Invariance
*p < .05. **p < .01. ***p < .001
Table 4
Unstandardized Factor Loadings (λ) and Intercepts (τ) for France, Italy, the United States and Mexico