Abstracts
Abstract
The aim of this paper is to present PACTE’s measurement of and results for the variable “efficacy of the Translation Process” in its experiment on Translation Competence Acquisition (TCA). This is one of the variables that provide information about the acquisition of the strategic sub-competence. We define this variable as the relationship between the time taken to complete a translation task, its distribution in stages, and solution acceptability. We consider translation process efficacy to be based on an optimal relationship between solution acceptability and time, i.e. achieving maximum acceptability in minimum time. In that respect, our initial premise was that finding acceptable solutions should take less time as the TCA process advances.
Our aim as regards this variable was to investigate whether, as Translation Competence is acquired, differences occur in terms of: (1) the time taken to carry out a translation task; (2) the distribution of the time spent on a translation task between stages; (3) the relationship between the time spent on a translation task and solution acceptability.
Keywords:
- translation competence acquisition,
- efficacy of the translation process,
- translation acceptability,
- time taken,
- experimental research
Résumé
Le but de cet article est de présenter les procédés de mesure et les résultats de la variable « efficacité du processus de la traduction », une des variables d’étude de la recherche expérimentale de PACTE sur l’Acquisition de la compétence de traduction (ACT). Cette variable est l’une de celles qui fournissent des informations sur l’acquisition de la sous-compétence stratégique. Nous la définissons comme la relation entre le temps investi pour effectuer une tâche de traduction, sa distribution en phases et l’acceptabilité des solutions obtenues. Nous considérons que l’efficacité du processus de traduction est basée sur une relation optimale entre l’acceptabilité de la solution et le temps investi, c’est-à-dire l’obtention d’un maximum d’acceptabilité dans un minimum de temps. C’est pourquoi nous sommes partis de la prémisse que, au fur et à mesure que l’ACT progresse, on devrait trouver des solutions acceptables plus rapidement.
Notre objectif avec cette variable est d’étudier si des changements se produisent au cours de l’acquisition de la compétence en traduction par rapport à : (1) le temps investi pour effectuer une tâche de traduction ; (2) la distribution en phases du temps investi ; (3) la relation entre le temps investi et l’acceptabilité de la solution.
Mots-clés :
- acquisition de la compétence de traduction,
- efficacité du processus de traduction,
- acceptabilité de la traduction,
- temps employé,
- recherche expérimentale
Resumen
El objetivo de este artículo es presentar los procedimientos de medición y los resultados de la variable «eficacia del proceso traductor», variable de estudio de la investigación experimental del grupo PACTE sobre la Adquisición de la competencia traductora (ACT). Se trata de una de las variables que proporcionan información sobre la adquisición de la subcompetencia estratégica. Definimos esa variable como la relación entre el tiempo invertido para efectuar una tarea de traducción, su distribución en fases y la aceptabilidad de las soluciones obtenidas. Consideramos que la eficacia del proceso traductor se basa en el establecimiento de una relación óptima entre la aceptabilidad de la solución y el tiempo invertido, es decir obtener el máximo de aceptabilidad en el mínimo tiempo. En este sentido, partimos de la premisa de que a medida que avanza la ACT se deberían encontrar soluciones aceptables más rápidamente.
Nuestro objetivo con esta variable es estudiar si, a medida que se adquiere la competencia traductora, se producen cambios en cuanto a: (1) el tiempo invertido para efectuar una tarea de traducción; (2) la distribución en fases del tiempo invertido; (3) la relación entre el tiempo invertido y la aceptabilidad de la solución.
Palabras clave:
- adquisición de la competencia traductora,
- eficacia del proceso traductor,
- aceptabilidad de la traducción,
- tiempo empleado,
- investigación experimental
Article body
1. Introduction
Having completed our research on translation competence (TC) (Hurtado 2017), we began our research into translation competence acquisition (TCA) in January 2010. In June 2011, we performed a pilot test with 15 fourth-year Translation and Interpreting degree students at the Universitat Autònoma de Barcelona (UAB), before carrying out our experiment, involving a total of 130 first to fourth-year trainee translators and recent graduates, in November 2011.
The sub-competences, variables and indicators we used in our TC study served as the basis for our research into TCA.[4] PACTE defines TC as the underlying system of knowledge, skills and attitudes required to translate. We believe that TC: a) is predominantly procedural knowledge; b) comprises different interrelated sub-competences; and c) includes a particularly important strategic component. In our model (PACTE 2003), TC comprises five sub-competences (bilingual, extralinguistic, knowledge of translation, instrumental, and strategic), as well as psycho-physiological components. PACTE’s experimental research on TC has validated this model (see Hurtado 2017).
The aim of this paper is to present our measurement of and results for the dependent study variable “efficacy of the translation process.” This is one of the variables (along with “translation project,” “identification and solution of translation problems,” and “decision-making”) related to the strategic sub-competence.
2. PACTE’s research into translation competence acquisition
2.1. Definitions and theoretical models
There are very few TCA models in existence. Most are based on personal observation and experience, and on studies carried out in other disciplines. Such models include Harris’s natural translation (a universal innate ability possessed by any bilingual speaker) (Harris 1977, 1980; Harris and Sherwood 1978); Toury’s process of socialization as concerns translating (Toury 1995: 241-258); Shreve’s process of development from natural to constructed translation (Shreve 1997); Chesterman’s five-stage model (novice, advanced beginner, competence, proficiency and expertise) (Chesterman 1997: 147-149), which draws on Dreyfus and Dreyfus (1986); Alves and Gonçalves’s model based on connectionist approaches (Alves and Gonçalves 2007); and Kiraly’s four-dimensional model of the emergence of translator competence (Kiraly 2013, 2015), which stresses the complex interplay of competences and their non-parallel emergence. All these authors agree that TC is acquired rather than innate, and that its acquisition is a cyclical process that goes from an initial stage to a stage in which skills are consolidated. Being cyclical, TCA comprises different stages, which vary from author to author. Nonetheless, greater empirical knowledge about the different stages of acquisition is needed. Some authors (Chesterman, PACTE, Shreve, Alves and Gonçalves) liken TCA to the process involved in acquiring any knowledge and emphasize that it is a process whereby actions gradually become proceduralized and automatic.
Various empirical studies on aspects related to TCA have been conducted in recent years. Lachat Leal (2003) studied how experience and learning affect the problem-solving process. Gregorio Cano (2014) looked at the evolution of strategic competence in relation to solving cultural translation problems. Quinci (2014) sought to observe whether linguistic patterns vary according to competence level. Massana (2016) studied TCA in connection with the translation (Portuguese-Spanish) of false friends. Olalla-Soler (2017), meanwhile, investigated the acquisition of translators’ cultural competence.
However, there have been few attempts to empirically study TCA in its entirety on a longitudinal basis. The TransComp and Capturing Translation Processes (CTP) research projects are examples of longitudinal studies on TCA. See Göpferich (2009) for information on the former, and Massey and Ehrensberger-Dow (2011) and Ehrensberger-Dow and Massey (2013) for details on the latter.
As shown in Figure 1, PACTE sees TCA as a spiral, a non-linear process in which novice knowledge (Pre-translation Competence) evolves into TC, involving the development of sub-competences and learning strategies. During the process, both declarative and procedural types of knowledge are integrated, developed and restructured.
Figure 1
The translation competence acquisition model (PACTE 2000)

TCA involves relationships, hierarchies and variations where sub-competences are concerned. On that basis, the TCA process might not be parallel (i.e. develop at the same time and rate) for direct and inverse translation, and might take place at different speeds with different language pairs. Additionally, one sub-competence might assume greater importance than another depending on the field of translation (legal, literary translation, etc.), while both the learning context (formal training, independent learning, etc.) and the methodology used by trainers will affect the process.
2.2. Hypotheses and study variables
We have developed our research’s theoretical hypotheses on the basis of the model described above. Our general hypothesis was that TC is acquired as a result of a process of development and restructuring of different sub-competences. On that basis, we established the following theoretical hypotheses:
TCA is, like all learning processes, a dynamic, non-linear, spiral process.
TCA involves an evolution from novice knowledge (pre-TC) to TC.
TCA is a process in which the development of procedural knowledge-and, consequently, of the strategic sub-competence-is essential.
TCA is a process in which the sub-competences of TC are developed and restructured.
In TCA, the development of the strategic, instrumental, and knowledge of translation sub-competences is particularly important.
In TCA, not all sub-competences develop in parallel, i.e. at the same time and at the same rate.
TCA is dependent upon directionality (direct/inverse translation).
TCA is dependent upon the learning environment.
As in our TC experiment, the study’s dependent variables were “knowledge of translation,” “translation project,” “identification and solution of translation problems,” “decision-making,” “efficacy of the translation process,” and “use of instrumental resources.”
The study’s independent variable was the subjects’ number of years of translation experience, in which regard we distinguished between first-year students, second-year students, third-year students, fourth-year students and recent graduates.
2.3. Simulation of a longitudinal study
To avoid technical problems (developing and testing comparable instruments, retaining subjects for five years) and the inclusion of external variables (external factors that might affect subjects’ language skills and TC, changes in technological tools), we decided to simulate a longitudinal study by simultaneously taking measurements from groups of first, second, third and fourth-year students and a group of recent graduates. We used a screening questionnaire to ensure that the subjects in each group were homogeneous and representative of the corresponding level.
Working with a total of 130 subjects, we collected all our data in November 2011, when those in the first-year group had just begun their curriculum and could still be considered novice translators. The recent graduates had completed their studies in June 2011.
2.4. Sample
Our universe was that of trainee translators and our sample population was drawn from first to fourth-year undergraduate students and recent graduates from the UAB’s Faculty of Translation and Interpreting. We used an initial questionnaire to screen the experimental sample, selecting a group of approximately 30 students corresponding to each year from all those deemed suitable.[5]
The subjects we selected met the following requirements: (1) their first language (L1) was Spanish or Catalan; (2) their age was within a pre-established range representative of each year; (3) they had not transferred from another degree course and had passed a minimum of 80% of their subjects in the previous year (including translation, and L1 and L2 subjects), thus guaranteeing similar language skills and experience of translating.
We worked with six language pairs, as we had in our TC experiment, with English, French and German as L2s, and Spanish and Catalan as L1s. We dropped a subject who was not actually a native Spanish or Catalan speaker and, due to technical problems, later excluded one of the remaining 129 subjects from our analysis of acceptability in direct and inverse translation. In our analysis of indicators related to measuring the time taken, ten Camtasia recordings were unusable in the case of direct translation and four in that of inverse translation (Table 1).
Table 1
Final sample composition for the variable “efficacy of the translation process”

We used the 35 professional translators who had taken part in our TC experiment as a “control group.”[6] We considered this group to be a benchmark for the acquisition process since it has subjects who already had TC (validated in our TC experiment) and had acquired it before we collected our data on TCA. It can be deemed a benchmark group for TCA as it is directly related to the study’s independent variable, in that its members were the subjects with the most years of translation experience and were no longer in the process of acquiring TC.
2.5. Tasks and instruments
Our subjects performed the same experimental tasks as in our TC experiment:
Completion of a questionnaire on knowledge of translation;
Translation of a text into their L1 (direct translation), followed by completion of a questionnaire on the translation problems involved;
Translation of a text into their L2 (inverse translation), followed by completion of a questionnaire on the translation problems involved.
There was a 30-minute break between tasks 2 and 3 to avoid the subjects getting tired. We told them they had approximately an hour to translate each text, although we did not stop any of them working on the grounds of time.
We used the data collection instruments we had previously validated in our TC experiment, namely our Knowledge of Translation Questionnaire; texts for direct and inverse translation; an adapted version of our Sample Selection Questionnaire; and a revised version of our Translation Problems Questionnaire. We used the Camtasia software to record subjects’ on-screen activities.
We guaranteed subjects’ anonymity by assigning them codes.
2.6. Limitations of the study
Given the complexity of studying TCA and the lack of previous empirical studies to use as a basis, our study involves a number of limitations that future research should take into account:
Limitations related to the sample. Our sample was drawn from a single translator training centre. The study should thus be replicated in another educational context.
Limitations related to the type of study. While we endeavoured to make each year’s sample representative of the corresponding level, we did not (for the reasons given previously) perform a longitudinal study. It is therefore important to carry out a real longitudinal study, in which all the external variables that might affect such studies can be controlled.
Limitations related to the control group. Our benchmark group was the group of professional translators from our TC experiment, which we carried out between October 2005 and March 2006. We collected data from our TCA study sample at a later time, and that time difference could distort some results (e.g. use of technological tools).
Limitations related to the texts used in direct and inverse translation. The texts used for direct translation (a news item) and inverse translation (a tourism brochure) belong to different text genres. In the event of the study being replicated, both texts should come from the same genre.
Limitations related to the time taken. While there was no time limit for translating the texts, we recommended spending approximately an hour on each translation. In any case, this could only have influenced the maximum time taken, not the minimum time or the distribution of time between stages.
Lastly, there are limitations stemming from the training received by students. When we collected our data, the first, second, and third-year students were taking the UAB’s new, EHEA-adapted Translation and Interpreting degree course, a competence-based programme with particular emphasis on progression in competence acquisition. The fourth-year students were taking, and the recent graduates had taken, an older Translation and Interpreting degree course not adapted to the EHEA.
3. The “efficacy of the translation process” variable
3.1. Definition
“Efficacy of the translation process” is a variable that provides information about the strategic sub-competence’s acquisition (PACTE 2017a). Our aim in relation to this variable was to investigate whether there are differences in the following as TC is acquired:
The total time taken to carry out a translation task.
The distribution of the time taken to carry out a translation task between three stages (orientation, development and revision, based on the distinction made by Jakobsen 2002).
The relationship between the time taken to carry out a translation task and solution acceptability.
The general hypothesis of our research was that there is a relationship between the degree of TC and the efficacy of the translation process. We consider translation process efficacy to be based on an optimal relationship between solution acceptability and time, i.e. achieving maximum acceptability in minimum time. In that respect, our initial premise was that coming up with acceptable solutions should take less time as TC is acquired. Table 2 shows the variable’s characteristics.
Table 2
The “efficacy of the translation process” variable (related to the strategic sub-competence)

3.2. Indicator measurement
We obtained our data for this variable by analyzing: a) the total time taken to perform a translation task and its distribution between stages; and b) translation acceptability.
3.2.1. Total time taken and time taken at each stage
Total Time Taken is the total time a subject spends on a translation task. We measured this indicator for both direct and inverse translation.
To measure the time taken at each stage of the translation process, we divided the process into three stages, namely orientation (from when subjects receive the text to when they begin translating it), development (from when they begin writing to when they reach the end of the text) and revision (from when they reach the end of the text to when they consider the translation task complete and close the document).
The time taken to translate a text is a quantitative indicator. We measured the Total Time Taken indicator in hours and minutes, and the Time Taken at each Stage indicator as a percentage of the total time taken.
All the subjects in each group began working at the same time. We used Camtasia recordings to determine each subject’s total time and time for each stage.
3.2.2. Acceptability
Acceptability is linked to translation product quality and is a transversal indicator. It is used with the specific indicators of dependent variables to determine the relationship between the results obtained for these indicators and the quality of subjects’ translations.
We used the same texts, criteria and evaluation procedures as in our TC experiment to enable us to compare the data from both experiments. For a more detailed explanation, see PACTE (2017b).
To facilitate data collection and analysis, we focused on Rich Points, i.e. specific source text segments containing prototypical translation problems.
For the direct translation task, we used parallel English, French and German texts belonging to the same text genre and on the same subject (news items on computer viruses), all of them approximately 200 words long. To ensure that the different texts’ Rich Points (RPs) would be comparable, we selected the same types of translation problems in each of them. The results of our TC experiment showed that the level of difficulty involved in the three languages was similar (PACTE 2017c: 176-178, 188-189).
For the inverse translation task, all the subjects worked with the same 138-word text (a tourism brochure).
In our research, we have defined acceptability in terms of meaning, function and language use. This entails determining whether a solution to a translation problem effectively: (1) communicates the meaning of the source text; (2) fulfils the function of the translation (within the context of the translation brief, target readers’ expectations and genre conventions in the target culture); (3) makes appropriate use of language.
With those factors in mind, we established and defined three degrees of solution acceptability, specifically acceptable, semi-acceptable and non-acceptable.
The results of our TC experiment underlined the suitability of the procedure we followed when measuring this indicator, in terms of the texts used and the use and selection of RPs (PACTE 2017d: 297-300).
3.2.3. Data analysis
We began by calculating descriptive statistics for the data derived from each indicator. We then performed statistical (chi-square) tests to gauge the differences between the first and second-year students and between the graduates and the professional translators, where the differences of the greatest scale and relevance to our study appeared in the descriptive statistics. In this paper’s Results section we present only the cases in which statistically significant differences were detected. The significance level we set was 0.05.
We calculated Spearman correlation coefficients to determine whether there was an association between Total Time Taken and Acceptability. With regard to coefficients, we established that:
0.29/-0.29 or below = no association;
between 0.30/-0.30 and 0.69/-0.69 = moderate correlation;
0.70/-0.70 or above = high correlation.
We also ran linear regression models, but they added nothing to our correlation-based data.
3.2.4. Analysis of differences between groups: scales and typology
For description purposes (and bearing in mind that a difference can be a rise or a fall, depending on its direction), when comparing between groups we considered that, on a scale of 0 to 100, a difference of:
under 5 points = no difference;
5 to 9 points = slight difference;
10 to 19 points = substantial difference;
20 to 29 points = very substantial difference;
30 points or over = extremely substantial difference.
On a scale of 0 to 1, the corresponding values are 0.00, 0.05, 0.10, 0.20, and 0.30. We used the latter scale with the indicator Acceptability, and the former with Total Time Taken.
We applied other numerical criteria in the case of the indicator Time Taken at each Stage, as it entails more than one mean value per group due to the total value being divided into three parts. Specifically, for each part we calculated the overall mean for the five groups and took 10% of it as the basis for describing differences between groups. For example, the overall mean percentage of time the five groups spent on the orientation stage in direct translation (see Table 7) is 7, 10% of which is 0.7. We thus consider this figure (0.7) to represent a substantial difference between groups, and then half the figure (0.3) a slight difference, twice the figure (1.4) a very substantial difference, and three times the figure (2.1) an extremely substantial difference.
On the basis of our descriptions, once we had analysed the results obtained for all the experiment’s indicators, we identified different recurrent types of evolution between the first year and the end of training (graduates):
Non-evolution: no difference in the values between successive groups between the first year and the end of training.
Rising evolution: values rise between the first year and the end of training, with each value between successive groups being higher than or equal to the previous one.
Falling evolution: values fall between the first year and the end of training, with each value between successive groups being lower than or equal to the previous one.
Mixed evolution: a combination of rising and falling evolution between the first year and the end of training.
It should be noted that, as explained previously, we carried out our research by simulating a longitudinal study, controlling different factors to guarantee that the students in our sample were representative of their respective levels (see 2.3 and 2.4), rather than by conducting a real longitudinal study. We thus use the term evolution to refer to differences in values between students at successive levels, not to evolution within a particular group of students.
To describe the progression that occurs between the first year and the end of training, we deemed a difference between the first-year and graduate groups of between 20 and 29 points to represent progression, under 10 points no progression, between 10 and 19 points little progression, and over 30 points major progression. In the case of the indicator Time Taken at each Stage, we did not analyse the progression corresponding to each stage. With the total time being divided into three parts, there would be no point in considering the progression reflected by a single set of results in isolation, as the three sets of results balance each other out.
4. Results
In this section we present our results for each indicator and integrate those corresponding to the total time taken and acceptability. We also compare our results from our TCA experiment with those we obtained from the group of 35 professional translators in our TC experiment (PACTE 2017a, 2017b).
4.1. Acceptability
The results for each group are presented in Table 3.
Table 3
Acceptability by group in direct and inverse translation (standard deviation in brackets)

Our results show that, in direct translation, rising evolution occurs. Acceptability begins increasing in the second year and continues ascending, little by little, until the end of training.
According to our results, rising evolution occurs in inverse translation too.
4.2. Total time taken
We now present our results on the total time taken, specifically each group’s mean time expressed in hours and minutes and as a percentage. The former is the total time spent translating the text, and the latter the time in question as a percentage of the maximum time available for the experimental task (translating the text). We calculated each group’s percentage in relation to the second-year group’s mean time of 62 minutes in the case of direct translation, and to the allotted time of 60 minutes in the case of inverse translation.
We compared the first-year group and the graduates on the basis of both the mean times in hours and minutes and the percentages. We used the percentages to describe evolution between the first year and the end of training because, being standardized on a scale of 0 to 100, they enabled us to apply the criteria we had established for describing types of evolution (see section 3.2.3.1).
We compared the graduates and the professional translators on the basis of the mean times in hours and minutes. We did not calculate percentages for the translators, as their maximum times (71 minutes in direct translation and 83 minutes in inverse translation) differed from those of the students. This would have affected the conversion to percentages, as they would have needed to be calculated using a different scale, thus preventing comparisons.
The statistical tests used to detect differences between groups were performed on the basis of the time taken, in hours and minutes. The percentages to which we extrapolated the results allowed us to compare the different groups of students (owing to their respective percentages being based on the same maximum time), but not to draw comparisons between the students and the translators, for whom, as explained, we did not calculate percentages.
Table 4 shows the results obtained for direct translation.
Table 4
Mean total time taken in direct translation, in hh:mm format and as a percentage (standard deviation in brackets)

Differences between groups in terms of total time. The first and fourth-year students are the groups that take the least time. The highest mean is that of the second-year students.
Type of evolution. The percentages show that mixed evolution takes place, with a very substantial rise between the first and second years, a slight fall between the second and third, a substantial fall between the third and fourth, and a substantial rise between the fourth year and the end of training. The difference between the first year and the second is statistically significant (chi-square statistic (1) = 9.9; p < 0.01). There is little difference between the first-year students and the graduates, with the latter taking slightly more time than the former.
Graduates versus translators. At the end of training, the graduates take longer than the professional translators did. The difference involved is statistically significant (chi-square statistic (1) = 9.33; p = 0.0135).
Table 5 shows the results obtained for inverse translation.
Table 5
Mean total time taken in inverse translation, in hh:mm format and as a percentage (standard deviation in brackets)

Differences between groups in terms of total time. The first-year students take the least time to perform the inverse translation task. The second, third and fourth-year students’ mean times are all between 00:50 and 00:55, while the graduates, take the longest to complete the translation. These results are very similar to the translators’ mean time in our TC experiment.
Type of evolution. The percentages show that rising evolution takes place, with a very substantial difference between the first and second years, and slight differences between the third and fourth years and between the fourth year and the end of training. The difference between the first year and the second is statistically significant (chi-square statistic (1) = 16.46; p < 0.001). There is a major difference between the first-year students and the graduates, with the latter taking much more time than the former.
Graduates versus translators. At the end of training, the graduates have a slightly higher mean time than the professional translators did.
4.3. Time taken at each stage
Table 6 shows the mean time in minutes spent on each stage in direct and inverse translation.
Table 6
Mean time spent on each stage in minutes
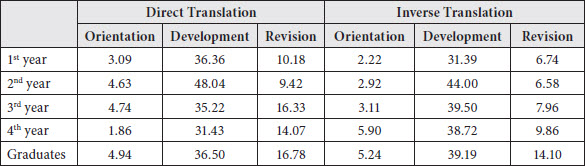
Table 7 shows the time spent on each stage in direct translation as percentages.
Table 7
Time taken at each stage in direct translation as percentages (standard deviation in brackets)

The data we obtained show the following:
Distribution between stages. The stage to which each group devotes the most time is development, followed by revision and then orientation, reproducing the distribution patterns identified in our TC experiment.
-
Differences between groups in terms of distribution between stages:
Orientation. The time spent on this stage rises until the third year and falls sharply in the fourth. It is the stage with the greatest number of substantial differences between successive groups, and also the one whose end-of-training value is closest to that of the translators.
Development. Each group spends longer on this stage than the translators did.
Revision. Each group spends less time on this stage than the translators did.
-
Type of evolution. Mixed evolution takes place in each stage:
Orientation. Mixed evolution occurs, with substantial rises between the first and second and between the second and third years, an extremely substantial fall between the third and fourth, and an extremely substantial rise between the fourth year and the end of training. There is a slight rise from the end-of-training value to that of the translators.
Development. Mixed evolution occurs, with a slight rise between the first and second years, a very substantial fall between the second and third, a slight rise between the third and fourth, and a slight fall between the fourth year and the end of training. There is a substantial fall from the end-of-training value to that of the translators.
Revision. Mixed evolution occurs, with a very substantial fall between the first and second years, an extremely substantial rise between the second and third, and a slight fall between the fourth year and the end of training. There is an extremely substantial rise from the end-of-training value to that of the translators.
Graduates versus translators. The greatest differences between end-of-training values and those of the translators occur in the development and revision stages, on which the graduates spend more time and much less time, respectively.
Table 8 shows the time spent on each stage in inverse translation as percentages.
Table 8
Time taken at each stage in inverse translation as percentages (standard deviation in brackets)
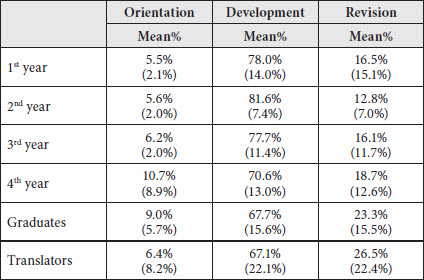
The data we obtained show the following:
Distribution between stages. Like the professional translators, and as in direct translation, each group devotes the most time to the development stage, followed by revision and then orientation. The development stage is longer and the revision stage shorter in inverse translation than in direct translation, mirroring our TC experiment.
-
Differences between groups in terms of distribution between stages:
Orientation. The greatest difference (a rise) happens between the third and fourth years, and is followed by a fall between the fourth year and the end of training. The graduates spend longer on this stage than the translators did.
Development. The differences between successive groups are very slight in this stage. Apart from the graduates, each group spends longer on this stage than the translators did. There is no difference between the end-of-training value and that of the translators.
Revision. This is the stage with the greatest differences between groups. Each group spends less time on this stage than the translators did.
-
Type of evolution. Mixed evolution takes place in the orientation and revision stages. Falling evolution occurs in the development stage, albeit with very slight differences:
Orientation. Mixed evolution occurs, with a slight rise between the second and third years, an extremely substantial rise between the third and fourth, and a very substantial fall between the fourth year and the end of training. There is an extremely substantial fall from the end-of-training value to that of the translators.
Development. Falling evolution occurs, with slight falls between the second and third and between the third and fourth years. There is no difference between the end-of-training value and that of the translators.
Revision. Mixed evolution occurs, with a very substantial fall between the first and second years, substantial rises between the second and third and between the third and fourth, and a very substantial rise between the fourth year and the end of training. There is a substantial rise from the end-of-training value to that of the translators.
Graduates versus translators. The greatest differences between end-of-training values and those of the translators occur in the orientation and revision stages, on which the graduates spend more time and less time, respectively.
4.4. Total time taken and acceptability
In this section we present the relationship between our results on the total time taken and acceptability. As in the TC experiment, we considered correlating our results from the Acceptability and Time Taken at each Stage indicators to be methodologically inappropriate due to each stage having a high standard deviation, indicating many individual differences between subjects. Additionally, our results on the relationship between the Total Time Taken and Acceptability indicators had already shown trends in the relationship between time and acceptability.
We calculated Spearman correlation coefficients to determine whether there was an association between the total time taken and acceptability (Table 9).
Table 9
Spearman correlation coefficients (direct and inverse translation)
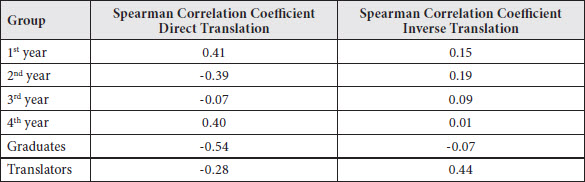
In direct translation, we found moderate correlations in the following cases:
In the first year there is a positive correlation between time and acceptability.
In marked contrast, in the second year there is a negative correlation between time and acceptability.
In the fourth year there is a positive correlation between time and acceptability.
At the end of training there is a negative correlation between time and acceptability, giving the highest Spearman correlation coefficient calculated.
In summary, in direct translation there is a positive correlation (more time, greater acceptability) in the first and fourth years; a negative correlation (less time, greater acceptability) in the second year and at the end of training; and no correlation in the third year.
We found no correlation between the total time taken and acceptability in inverse translation in our TCA experiment. We did detect a moderate positive correlation in the case of the translators from our TC experiment. The longer they spent translating, the more acceptable their solutions were. It seems that their L2 resources were insufficient to solve the translation problems and they thus needed more time to come up with solutions.
5. Discussion
5.1. Total time taken
An analysis of our results on the time each group spent translating shows the following.
Differences in the total time taken according to directionality. In general, less time is spent on inverse translation than direct translation. In our TC experiment, however, the translators spent longer on inverse translation than direct translation, suggesting that they needed more time to solve translation problems when working into their L2. The students do not appear to share this need.
-
Differences in the evolution of the total time taken according to directionality. Mixed evolution occurs in direct translation. The time taken seems to change in response to increases in the students’ ability to identify problems and in the internal resources (i.e. cognitive resources: linguistic and extralinguistic knowledge, knowledge of translation, cognitive strategies, etc.) and external resources (documentation of all kinds) they are able to use to solve them.
Rising evolution occurs in inverse translation. The time taken gradually increases as TC is acquired, possibly because the students are capable of identifying more translation problems and take increasingly longer to solve them due to them translating into their L2.3. Influence of training. Students’ introduction to the practice of translating in each direction causes an increase in the time taken (this increase occurs in the second year in direct translation and the fourth in inverse translation).[7] Experience of translating seems to make them more aware of translation problems, but they take longer to solve them as they still lack sufficient (internal and external) resources. The time taken falls between the second and third years in both directions (most markedly in direct translation), probably because, having gained experience in direct translation by then, students can draw on a wider range of resources and are more adept at using them, enabling them to solve translation problems quicker.
Absence of progression between first-year students and graduates in both directions. The graduates take longer than the first-year students to solve the translation problems.
Need for more time to translate at the end of training. In both directions, and especially direct translation, the graduates take longer to translate than the fourth-year students. In inverse translation the graduates are the slowest group of all. This is probably because their greater experience of translating makes them more concerned about quality, leading, in turn, to them devoting more time to translation.
Distance between graduates and professionals. In both directions, and in direct translation in particular, the graduates take longer to solve the translation problems than the professional translators did.
5.2. Distribution of time between stages
An analysis of our results on the stages between which the time taken to translate is distributed shows the following.
Predominance of the development stage. As the translators did in our TC experiment, each group spends the most time on the development stage, followed by revision and then orientation, in both directions.
Predominance of mixed evolution. Mixed evolution is predominant in both directions, the only exception being the development stage in inverse translation, where falling evolution occurs, albeit with very slight changes. This suggests that as TC is acquired, the distribution of time between the different stages of the translation process is adjusted as students become better able to identify translation problems and the range of resources they can draw on to solve them grows.
-
Differences in the distribution and evolution of stages according to directionality.
Orientation. In direct translation, the time spent on this stage rises until the third year and falls in the fourth. In inverse translation, however, it rises considerably between the third and fourth years. This increase may be due to the training received (given that students study inverse translation in the third year), which could generate greater awareness of the importance of understanding the L1 source text’s difficulties. There is a fall between the fourth year and the end of training, possibly owing to the graduates being able to draw on more cognitive resources. In direct translation, this is the stage with the greatest number of changes between successive groups.
Development. Mirroring our TC experiment, the development stage is longer in inverse translation than in direct translation in every case, possibly because subjects need more time to find solutions when working into their L2. It is worth stressing that very different types of evolution are involved. Mixed evolution occurs in direct translation, and falling evolution, albeit with very few changes in inverse translation. There are, in other words, fewer adjustments in inverse translation than in direct translation.
Revision. Mirroring our TC experiment again, the revision stage is shorter in inverse translation than in direct translation in every case, probably because subjects are able to call on fewer linguistic resources to improve the quality of their translation. In inverse translation, in contrast to direct translation, this is the stage with the greatest number of changes between successive groups.
-
Differences between students and professionals. In every case, in both directions, the students spent more time on the development stage and less on the revision stage than the translators did. It seems that they spend longer than the professionals on the development stage due to needing more time to look for solutions to problems and produce a translation. They may attribute less importance to the revision stage as a result of being less concerned about their end product’s quality and of having had to make a greater effort in the development stage.
Additionally, the difference between the time spent on the development stage in direct translation and in inverse translation is smaller in the case of the students than in that of the translators. The professionals performed the direct translation much quicker than the students (except the third-year group), and may have taken longer to complete the inverse translation task due to a lack of experience of working into their L2.[8]
In direct translation, each group of students spends less time on the orientation stage than the translators did. In inverse translation, however, this only happens in the first three years. Once they have received training in inverse translation, the time they devote to orientation increases greatly, far exceeding that taken by the translators. This might be due to the emphasis training places on the stage’s importance.
Differences between graduates and professionals. In both directions, the stage whose end-of-training values differ most from those of the professional translators is revision, to which the graduates devote less time in each case (especially in direct translation). In the development stage there is only a difference in direct translation, and in the orientation stage in inverse translation, with the graduates taking more time than the translators in both cases.
5.3. Time taken and acceptability: efficacy of the translation process
An analysis of translation process efficacy at each level of the TCA process, based on the relationship between the time taken to translate and the acceptability achieved, shows the following:
-
Differences on the basis of each group’s mean time and acceptability values (see Tables 3, 4 and 5): translation process efficacy in each group. In both directions, there are some differences that could be connected to the assimilation of internal and external resources as TC is acquired.
There is a substantial change between the first and second years in both directions, with statistically significant differences in each case. The first-year students are the fastest group in inverse translation and the second-fastest in direct translation. They seem to fail to identify translation problems due to their lack of translation experience. They consequently translate quickly, but obtain the lowest acceptability values. Translation process efficacy is, thus, very low. From the second year onward, there are differences between direct and inverse translation.
-
In direct translation, translation process efficacy increases as TC is acquired.
The second-year students are the group that takes the most time. It seems that having been introduced to the practice of translation enables them to identify translation problems. However, as they are not yet able to draw on all the resources necessary to solve such problems, they require more time and fail to come up with good solutions. There seems to be a certain degree of translation process efficacy at this stage of training.
There is a reduction in the time taken in the third year, but acceptability rises very little. There appears to be no progress in terms of translation process efficacy.
The fourth-year students are the group that takes the least time and most closely matches the speed of the professional translators. There is thus a greater degree of translation process efficacy at this stage of training, as the students obtain a good acceptability value while working faster. They seem to be the most efficient of the groups.
At the end of training, there is a considerable increase in the time taken compared to the fourth-year students, but only a small rise in acceptability. There appears to be no progress in terms of translation process efficacy in relation to the fourth-year students.
-
In inverse translation, the degree of translation process efficacy is lower and increases less as TC is acquired.
In the second year there is a statistically significant increase in the time taken but only a very small rise in acceptability, which is still very low. The students probably spend longer on the task because they are able to draw on more resources and are more aware of translation problems, although they are not yet capable of solving them acceptably. The degree of translation process efficacy apparently remains very low at this stage of training.
There are no differences between the second and third years in terms of the time taken and acceptability. There appears to be no progress as regards translation process efficacy at this stage of training.
There is an increase in the time taken in the fourth year and at the end of training, with the graduates being the group that takes the longest, and also in acceptability. It seems that, having studied inverse translation, these students are more familiar with the specific problems such translation poses and need more time to solve them. The acceptability of their solutions increases, albeit without attaining a very high level. There appears to be a slightly greater degree of translation process efficacy at this stage.
-
Differences within each group in terms of the time taken and the acceptability achieved (correlations): the most efficient subjects in each group. We found moderate correlations between the time taken and acceptability in most of the groups in direct translation, but none in inverse translation.
-
In direct translation there is a moderate positive correlation (more time, greater acceptability) in the first and fourth years, a moderate negative correlation (less time, greater acceptability) in the second year and at the end of training, and no correlation in the third year. These results could be connected to the mixed evolution of the total time taken at the different stages of training. They show that the relationship between time and acceptability alters as subjects become better at identifying translation problems and are able to draw on more resources to solve them.
In the first year (positive correlation), the students who take longer to complete the translation obtain more acceptable solutions. At this stage of training the subjects need more time to solve translation problems acceptably. It is worth emphasizing that the first-year students are the fastest of all the groups, but have the lowest mean acceptability value.
In the second year (negative correlation), in marked contrast to the first, the students who take less time to translate obtain more acceptable solutions. Nonetheless, the second-year students have the highest mean time of all the groups and their mean acceptability value is still not particularly high.
In the third year there is no correlation between time and acceptability. There is a reduction in the time taken, but only a small increase in acceptability.
In the fourth year (positive correlation), the students who take longer to translate obtain more acceptable solutions. They are probably able to draw on more resources, are more aware of translation problems and have a greater concern for quality, resulting in them spending more time on their work. It should be stressed that they have the lowest mean time of all the groups and their mean acceptability value rises to 0.65, making them the group with the greatest degree of translation process efficacy.
At the end of training (negative correlation), the graduates who take less time to complete the translation obtain more acceptable solutions. Their correlation, while still moderate, is the highest among the different groups, and is higher than that of the professional translators. The graduates’ results are probably a consequence of them being able to draw on more resources and using them faster to come up with acceptable solutions. It is worth underlining that they take considerably longer and achieve only a little more acceptability than the fourth-year students, although they have the highest mean acceptability value of all the groups.
In inverse translation we found no correlations of any kind. This may be due to the lower degree of translation process efficacy referred to previously when comparing each group’s time and mean acceptability values. The experiment’s conditions are probably also a factor. With more time for the inverse translation task, the students might have achieved better acceptability values, as the professional translators did.
-
Low level of progression between first-year students and graduates. There is no progression in terms of the time taken to translate in either direction. Acceptability, however, increases and thus progression does occur in that respect. There thus appears to be only a small rise in translation process efficacy, especially in the case of inverse translation.
Low degree of translation process efficacy at the end of training. The time taken increases at the end of training, but so does acceptability. In direct translation, the graduates are the group with the best acceptability value. The same applies in inverse translation, although here their value is similar to that of the fourth-year students and is not very high. It seems that they still need longer to come up with better solutions to translation problems and, thus, improve the efficacy of their translation process, particularly in the case of inverse translation.
Distance between graduates and professionals. The graduates take longer than the professional translators in both directions, and the two groups’ acceptability values are similar in each case. The graduates’ translation process is thus less efficient than that of the translators.
6. Conclusions
Our research was based on the empirical hypothesis that there is a relationship between the degree of TC and the efficacy of the translation process (see Table 2). We consider such efficacy to be based on an optimal relationship between solution acceptability and time. Our initial premise was that coming up with acceptable solutions should take less time as TC is acquired.
The data we obtained seem to support our empirical hypothesis, showing differences in terms of translation process efficacy at each level of the TCA process. They also seem to support our operational hypotheses, as we have observed differences at each level of the TCA process in relation to the time taken, its distribution between stages and solution acceptability. Additionally, we have observed the following.
Predominance of mixed evolution. The time taken to translate undergoes mixed evolution in direct translation and rising evolution in inverse translation. Mixed evolution also occurs in the different stages between which the time taken is distributed, apart from the development stage in inverse translation (where falling evolution takes place, albeit with very slight changes). Additionally, in direct translation there are alternating positive and negative correlations where the relationship between the time taken and acceptability is concerned.
-
Low level of progression between first-year students and graduates. There is no progression in terms of the time taken to translate in either direction. Progression does occur in the case of acceptability, however. The level of progression in translation process efficacy is therefore low.
It is worth reiterating that our analysis of the indicator Total Time Taken has been greatly influenced by the experiment’s conditions (with all subjects having approximately an hour for each task).
Distance between graduates and professionals. With regard to the total time taken, the graduates take longer than the professional translators did to solve translation problems. Where distribution between stages is concerned, the graduates’ revision stage is shorter than that of the translators in both directions (especially direct translation), which could be due to the former being less concerned about quality. In direct translation the graduates devote more time to the development stage than the translators did, suggesting that they need more time to look for solutions to translation problems. In inverse translation the graduates spend longer on the orientation stage than the translators did, indicating that they need more time to prepare to tackle a translation. Lastly, the graduates do not come close to the translators in terms of translation process efficacy in either direction, especially in inverse translation.
-
Differences according to directionality. We have detected various differences between direct and inverse translation:
Less time spent on inverse translation than direct translation.
Different types of evolution in terms of the time taken. Mixed evolution occurs in direct translation and rising evolution in inverse translation.
Differences in stages’ evolution and the way they function. The greatest number of adjustments occur in the orientation stage in direct translation and in the revision stage in inverse translation. Additionally, there are very few adjustments in the development stage in inverse translation.
-
Differences in translation process efficacy. Based on each group’s mean time and acceptability values, we have observed that translation process efficacy increases, albeit only slightly, as TC is acquired in direct translation. In inverse translation there is a lower level of such efficacy and the increase that takes place as TC is acquired is smaller.
There are (positive or negative) correlations within most of the groups in direct translation, but none in inverse translation, an absence that could be chiefly due to heterogeneity in subjects’ use of time to translate. The heterogeneity in question may be caused by differences between subjects in terms of how well they use documentation resources, internal support resources, etc.
The absence of a relationship between the time taken and acceptability in inverse translation may be a consequence of subjects lacking awareness of translation problems when working into their L2, being unable to draw on sufficient L2 resources, and having fewer strategies for translating into their L2, in which case more time would be of no benefit to them.
-
Difference in the progression of translation process efficacy between the first year and the end of training. Specifically, there is a lower level of progression in inverse translation.
It should be noted that the students had received more hours of training in direct translation than in inverse translation, which has probably been a factor in the differences observed. The fact that the text genre used for direct translation and that used for inverse translation were different may also have influenced the results.
Influence of training. The training that subjects have undergone affects the time they take to translate, its distribution between stages and the efficacy of their translation process.
The results we have obtained for this variable corroborate, for the time being, our conception of TCA as a dynamic, non-linear, spiral process and our theoretical hypothesis no.1. This can be seen particularly clearly in our results in direct translation, given the mixed evolution of the time taken to translate and its distribution between stages, and the evolution of the relationship between time and acceptability, with positive and negative correlations alternating as TC is acquired. The relationship’s evolution can also be seen to be non-linear in inverse translation, although to a lesser degree.
We obviously still need to compare our results for this variable with those obtained for the rest of the experiment’s indicators to be able to confirm all our theoretical hypotheses. Additionally, we wish to emphasize that, given the limitations of the study (see section 2.6.), the experiment ought to be replicated in another educational context, involving a real longitudinal study (controlling all external variables) and using the same text genre for direct and inverse translation.
Appendices
Notes
-
[1]
Translated from Spanish by Paul Taylor.
-
[2]
Members of the research team, in alphabetical order.
-
[3]
Also affiliated with the Uniwersytet Wrocławski, Wrocław, Poland.
-
[4]
See PACTE (2014. and PACTE (2015) for our first results on TCA.
-
[5]
See PACTE (2015. 34) for more details on the sample’s characteristics.
-
[6]
See Kuznik (2017) for more details on the TC sample’s characteristics.
-
[7]
The second-year students had taken single-semester introductory subjects on direct translation. The fourth-year students had studied single-semester subjects on inverse translation.
-
[8]
On average, inverse translation represented just 9.1% of the workload of the translators who participated in our TC experiment (Kuznik 2017).
Bibliography
- Alves, Fabio and Gonçalves, José Luiz (2007): Modelling Translator’s Competence: Relevance and Expertise under Scrutiny. In: Yves Gambier, Miriam Shlesinger, and Radegundis Stolze, eds. Translation Studies: doubts and directions. Selected Papers from the IV Congress of the European Society for Translation Studies. Amsterdam/Philadelphia: John Benjamins, 41-55.
- Chesterman, Andrew (1997): Memes of Translation. Amsterdam/Philadelphia: John Benjamins.
- Dreyfus, Hubert L. and Dreyfus, Stuart E. (1986): Mind Over Machine. Oxford: Blackwell.
- Ehrensberger-Dow, Maureen and Massey, Gary (2013): Indicators of Translation Competence: Translators’ Self-Concepts and the Translation of Titles. Journal of Writing Research. 5(1):103-131.
- Göpferich, Susanne (2009): Towards a Model of Translation Competence and Its Acquisition: The Longitudinal Study ‘TransComp.’ In: Susanne Göpferich, Arnt L. Jakobsen, and Inger M. Mess, eds. Behind the Mind: Methods, Models and Results in Translation Process Research. Copenhagen: Samfundslitteratur, 11-37.
- Gregorio Cano, Ana (2014): Estudio empírico-descriptivo del desarrollo de la competencia estratégica en la formación de traductores. Doctoral dissertation, unpublished. Granada: Universidad de Granada.
- Harris, Brian (1977): The Importance of Natural Translation. Working Papers on Bilingualism. 12:96-114.
- Harris, Brian (1980): How a Three-year-old Translates. In: Evangelos A. Afrendas, ed. Patterns of Bilingualism. Singapore: National University of Singapore Press, 370-393.
- Harris, Brian and Sherwood, Bianca (1978): Translating as an Innate Skill. In: David Gerver and Henry W. Sinaiko, eds. Language, Interpretation and Communication. Oxford: Plenum Press, 155-170.
- Hurtado Albir, Amparo, ed. (2017): Researching Translation Competence by PACTE Group. Amsterdam/Philadelphia: John Benjamins.
- Jakobsen, Arnt L. (2002): Translation drafting by professional translators and by translation students. In: Gyde Hansen, ed. Empirical Translation Studies: process and product. Copenhagen: Samfundslitteratur, 191-204.
- Kiraly, Don (2013): Towards a View of Translator Competence as an Emergent Phenomenon: Thinking outside the Box(es) in Translator Education. In: Don Kiraly, Silvia Hansen-Schirra, and Karin Maksymski, eds. New Prospects and Perspectives for Educating Language Mediators. Tubingen: Gunter Narr, 197-224.
- Kiraly, Don (2015): Occasioning translator competence: Moving beyond social constructivism toward a postmodern alternative to instructionism. Translation and Interpreting Studies. 10(1):8-32.
- Kuznik, Anna (2017): Characteristics of the sample. In: Amparo Hurtado Albir, ed. Researching Translation Competence by PACTE Group. Amsterdam/Philadelphia: John Benjamins, 97-105.
- Lachat Leal, Cristina (2003): Estrategias y problemas de traducción. Doctoral dissertation, unpublished. Granada: Universidad de Granada.
- Massana, Gisela (2016): La adquisición de la competencia traductora portugués-español: un estudio en torno a los falsos amigos. Doctoral dissertation, unpublished. Barcelona: Universitat Autònoma de Barcelona.
- Massey, Gary and Ehrensberger-Dow, Maureen (2011): Investigating Information Literacy: A Growing Priority in Translation Studies. Across Languages and Cultures. 12(2):193–211.
- Olalla-Soler, Christian (2017): La competencia cultural del traductor y su adquisición. Un estudio experimental en la traducción alemán-español. Doctoral dissertation, unpublished. Barcelona: Universitat Autònoma de Barcelona.
- PACTE (2000): Acquiring Translation Competence: Hypotheses and Methodological Problems in a Research Project. In: Allison Beeby, Doris Ensinger, and Marisa Presas, eds. Investigating Translation. Amsterdam/Philadelphia: John Benjamins, 99-106.
- PACTE (2003): Building a Translation Competence Model. In: Fabio Alves, ed. Triangulating Translation: Perspectives in process oriented research. Amsterdam/Philadelphia: John Benjamins, 43-66.
- PACTE (2014): First results of PACTE group’s experimental research on translation competence acquisition: The acquisition of declarative knowledge of translation. In: Ricardo Muñoz Martín, ed. Minding Translation / Con la traducción en mente. MonTI. SI(1):85-115.
- PACTE (2015): Results of PACTE’s Experimental Research on the Acquisition of Translation Competence: the Acquisition of Declarative and Procedural Knowledge in Translation. The Dynamic Translation Index. Translation Spaces. 4(1):29-35.
- PACTE (2017a): Efficacy of the translation process. In: Amparo Hurtado Albir, ed. Researching Translation Competence by PACTE Group. Amsterdam/Philadelphia: John Benjamins, 211-218.
- PACTE (2017b): Acceptability. In: Amparo Hurtado Albir, ed. Researching Translation Competence by PACTE Group. Amsterdam/Philadelphia: John Benjamins, 119-130.
- PACTE (2017c): Identification and Solution of Translation Problems. In: Amparo Hurtado Albir, ed. Researching Translation Competence by PACTE Group. Amsterdam/Philadelphia: John Benjamins, 171-189.
- PACTE (2017d): Conclusions: Defining features of Translation Competence. In: Amparo Hurtado Albir, ed. Researching Translation Competence by PACTE Group. Amsterdam/Philadelphia: John Benjamins, 281-302.
- Quinci, Carla (2014): Translators in the making: an empirical longitudinal study on translation competence and its development. Doctoral dissertation, unpublished. Trieste: Università degli studi di Trieste.
- Shreve, Gregory M. (1997): Cognition and the Evolution of Translation Competence. In: Joseph H. Danks, Gregory M. Shreve, Stephen B. Fountain, et al., eds. Cognitive Processes in Translation and Interpreting. Thousand Oaks: Sage, 120-136.
- Toury, Gideon (1995): Descriptive Translation Studies—and beyond. Amsterdam/Philadelphia: John Benjamins.
List of figures
Figure 1
The translation competence acquisition model (PACTE 2000)
List of tables
Table 1
Final sample composition for the variable “efficacy of the translation process”
Table 2
The “efficacy of the translation process” variable (related to the strategic sub-competence)
Table 3
Acceptability by group in direct and inverse translation (standard deviation in brackets)
Table 4
Mean total time taken in direct translation, in hh:mm format and as a percentage (standard deviation in brackets)
Table 5
Mean total time taken in inverse translation, in hh:mm format and as a percentage (standard deviation in brackets)
Table 6
Mean time spent on each stage in minutes
Table 7
Time taken at each stage in direct translation as percentages (standard deviation in brackets)
Table 8
Time taken at each stage in inverse translation as percentages (standard deviation in brackets)
Table 9
Spearman correlation coefficients (direct and inverse translation)